



fig2
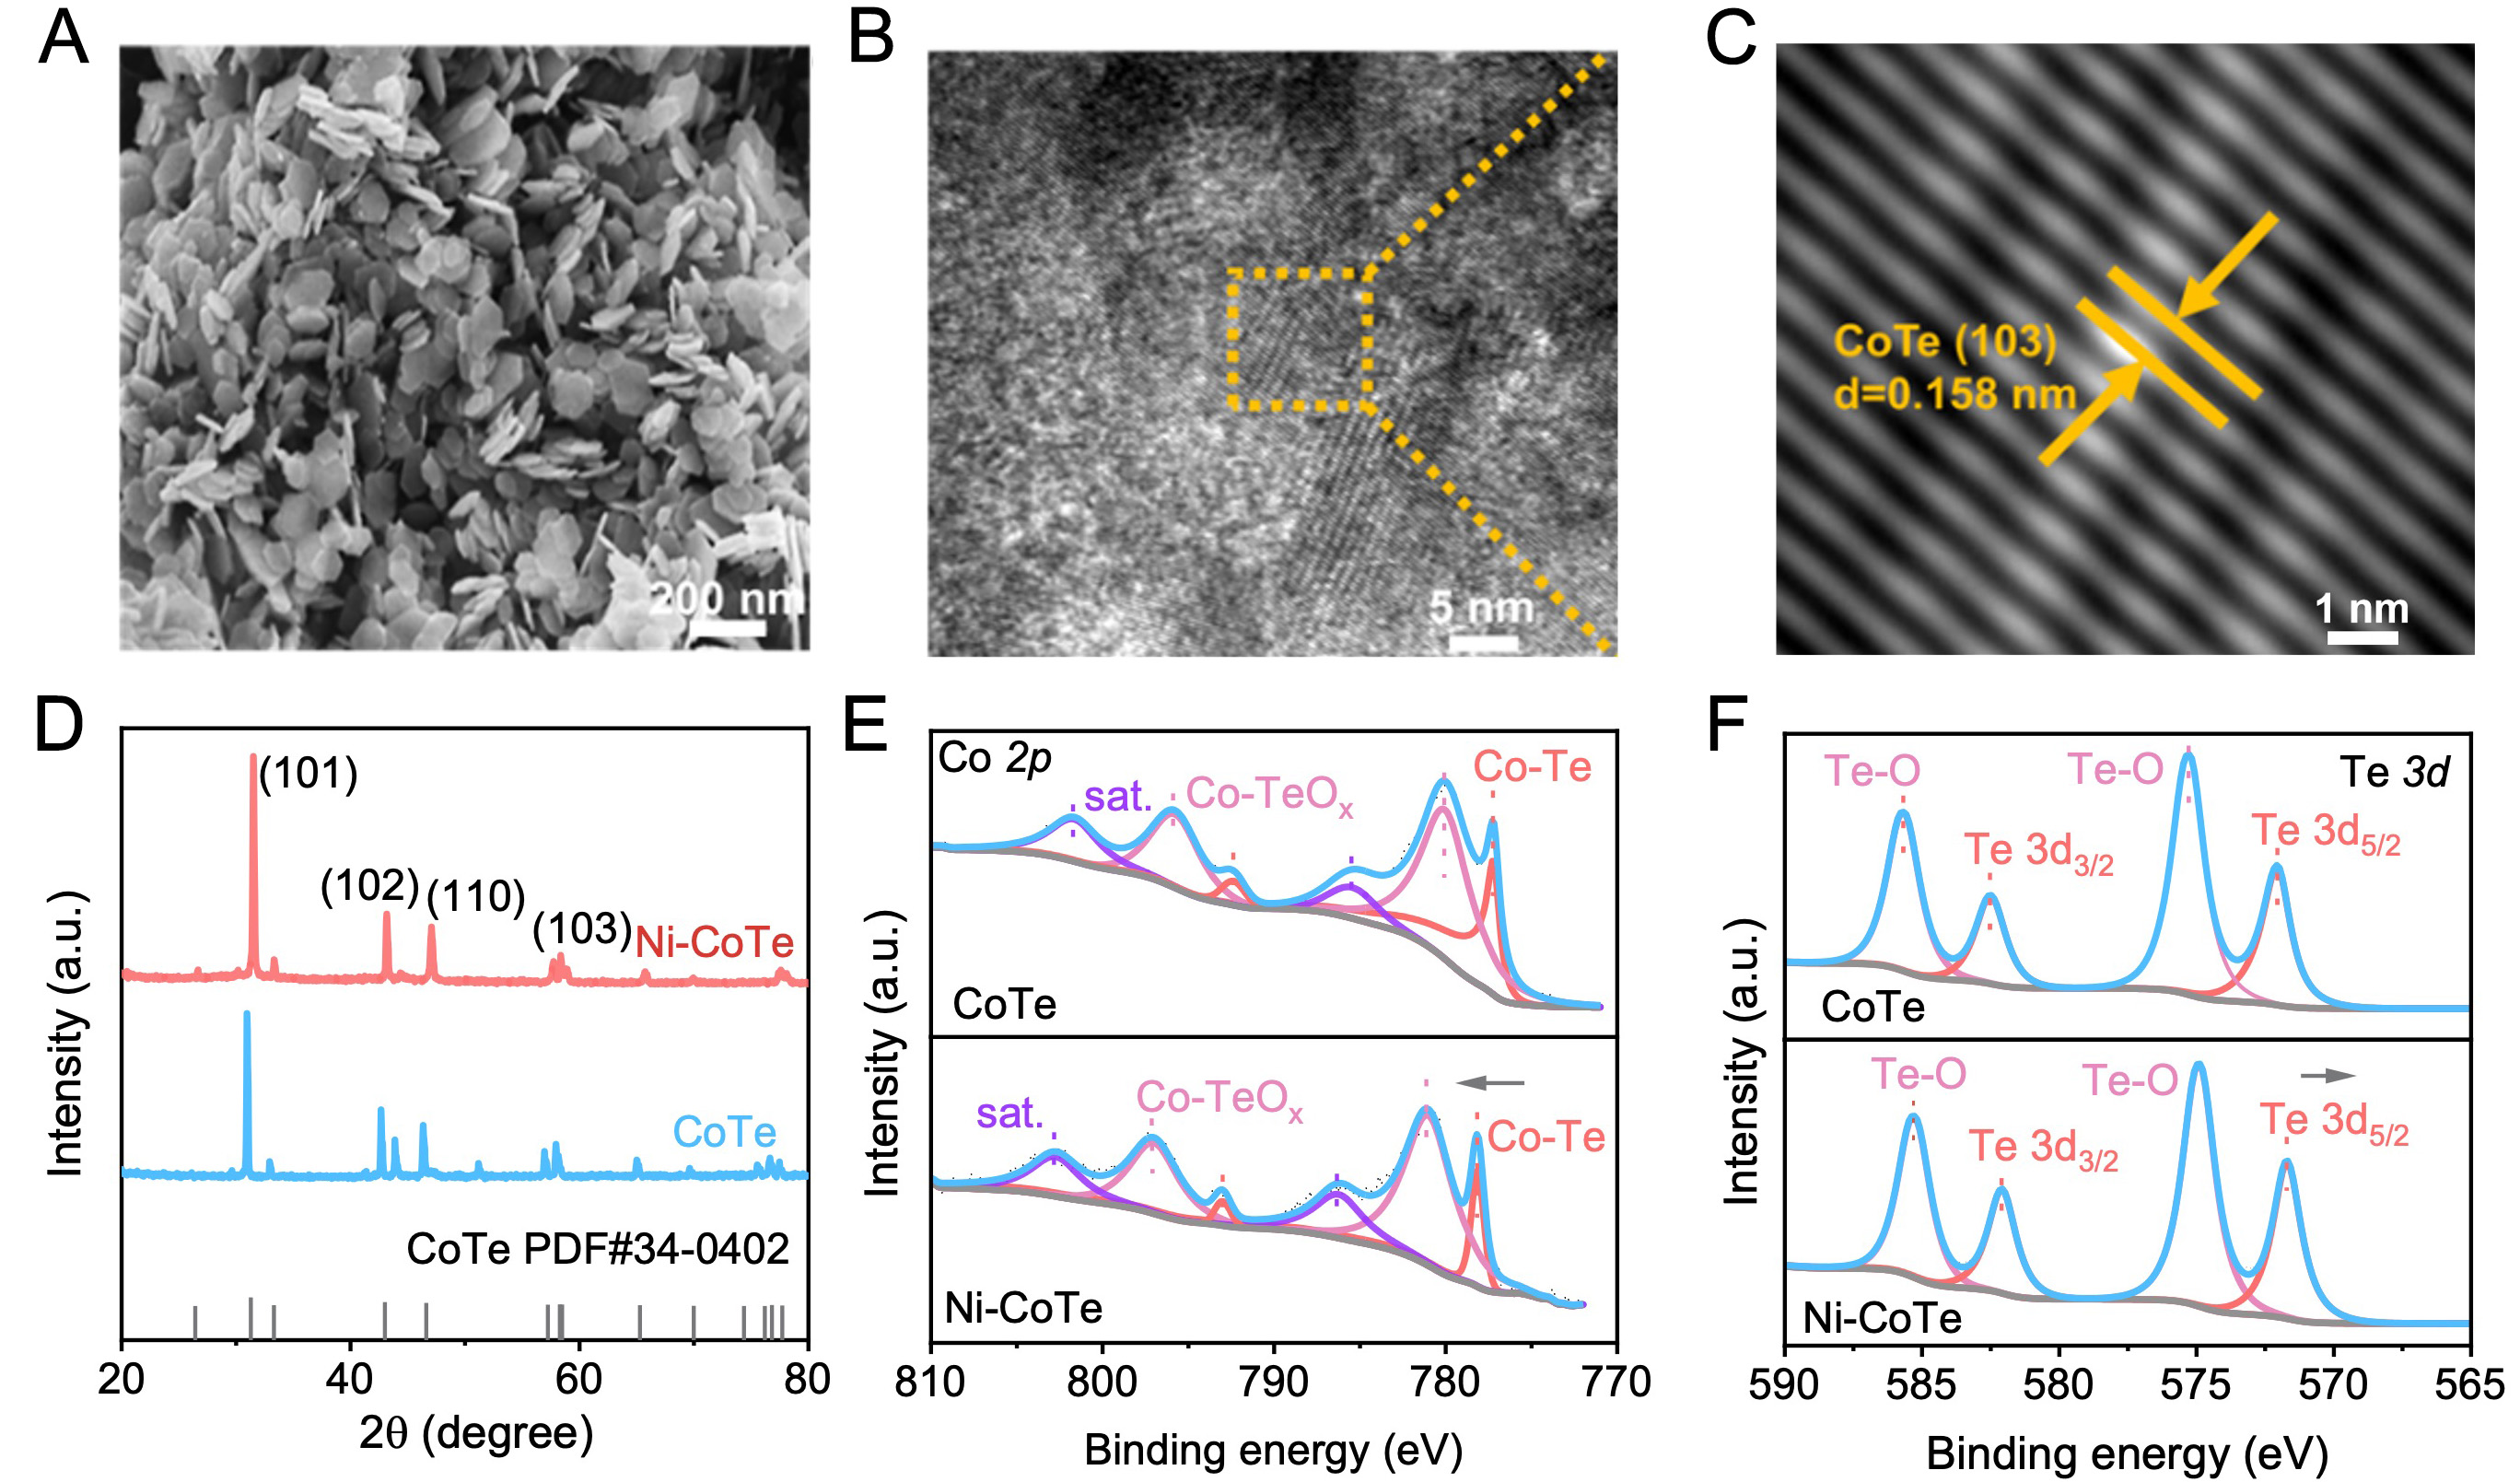
Figure 2. (A) Scanning electron microscopy (SEM) image of the Ni-CoTe catalyst; (B) High-resolution transmission electron microscopy (HRTEM); (C) Inverse fast Fourier-transform (IFFT) lattice images of Ni-CoTe; (D) X-ray diffraction (XRD) patterns of CoTe and Ni-CoTe; (E) X-ray photoelectron spectroscopy (XPS) spectra of Co 2p and (F) Te 3d for the Ni-CoTe and CoTe catalysts.





