



fig4
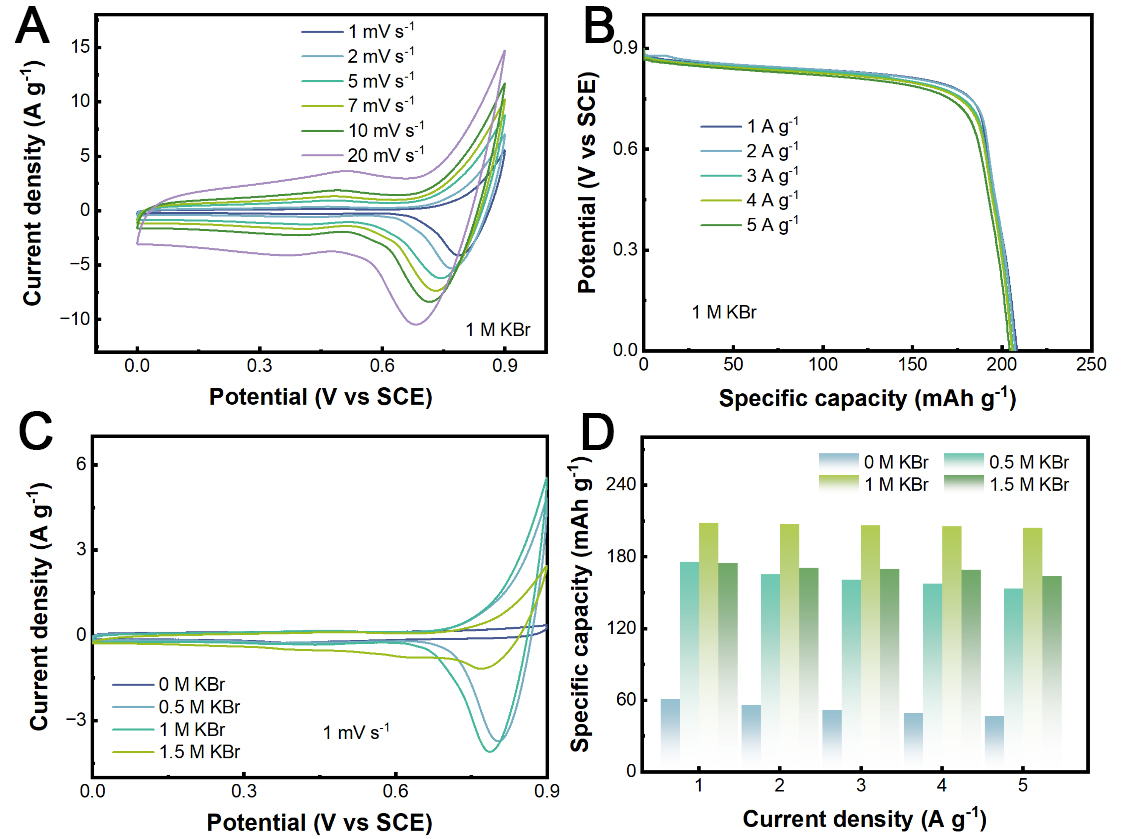
Figure 4. (A) CV curves obtained at different scan rates and (B) Discharge for 1 M KBr electrolyte in the three-electrode system. Comparison of (C) CV curves and (D) discharge specific capacity for different concentrations of KBr electrolyte. CV: Cyclic voltammetry; SCE: saturated calomel electrode.





