



fig3
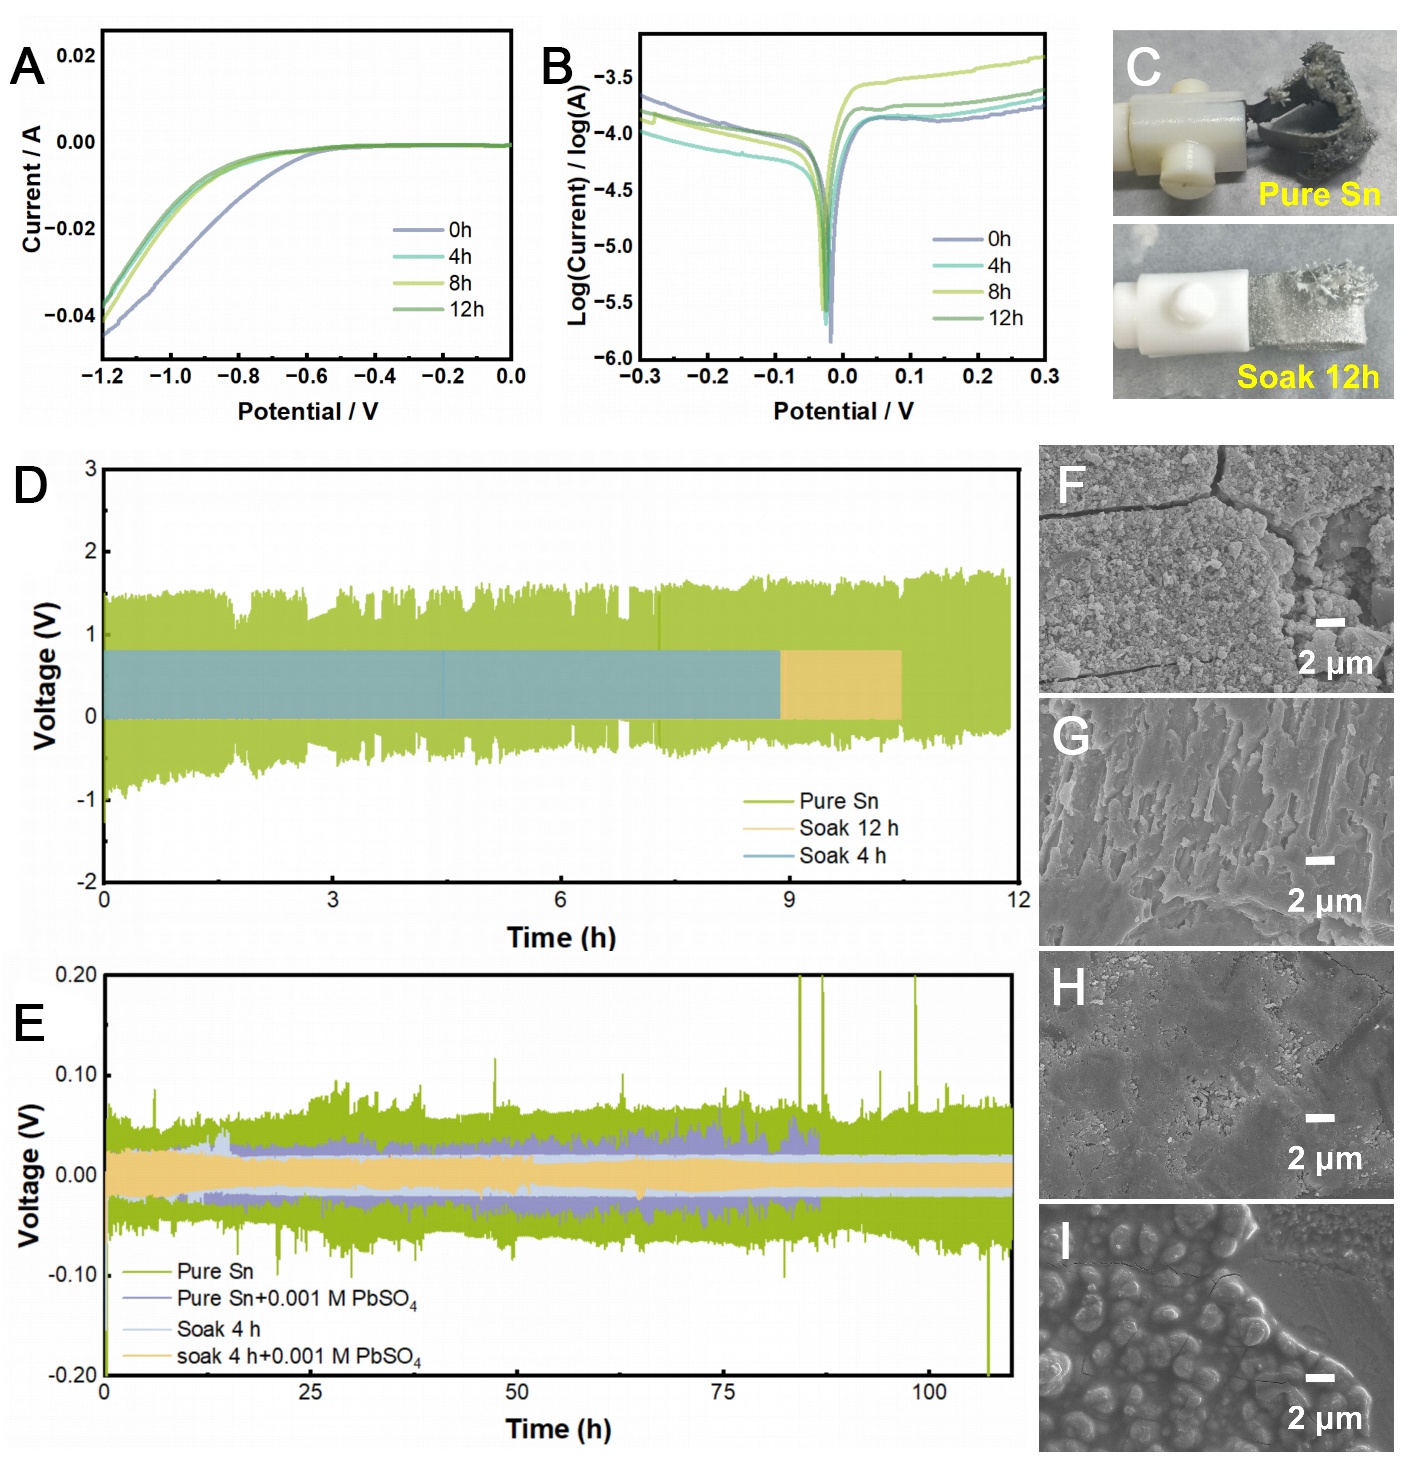
Figure 3. Electrochemical and morphological evaluation of surface-regulated Sn electrodes. (A) LSV curves and (B) Tafel plots of Sn foils treated for different durations; (C) Optical photographs and (D) voltage-time profiles of symmetric cells based on different Sn electrodes at a current density of 5 mA mg-1; (E) Voltage-time profiles of Sn-based symmetric cells at 0.1 mA cm-2 with or without PbSO4 additive; Post-cycling SEM images of (F) pure Sn, (G) pure Sn + 0.001 M PbSO4, (H) the 4 h-treated Sn electrode, and (I) the 4 h-treated Sn electrode + 0.001 M PbSO4. SEM: Scanning electron microscopy; LSV: linear sweep voltammetry.





