


fig5
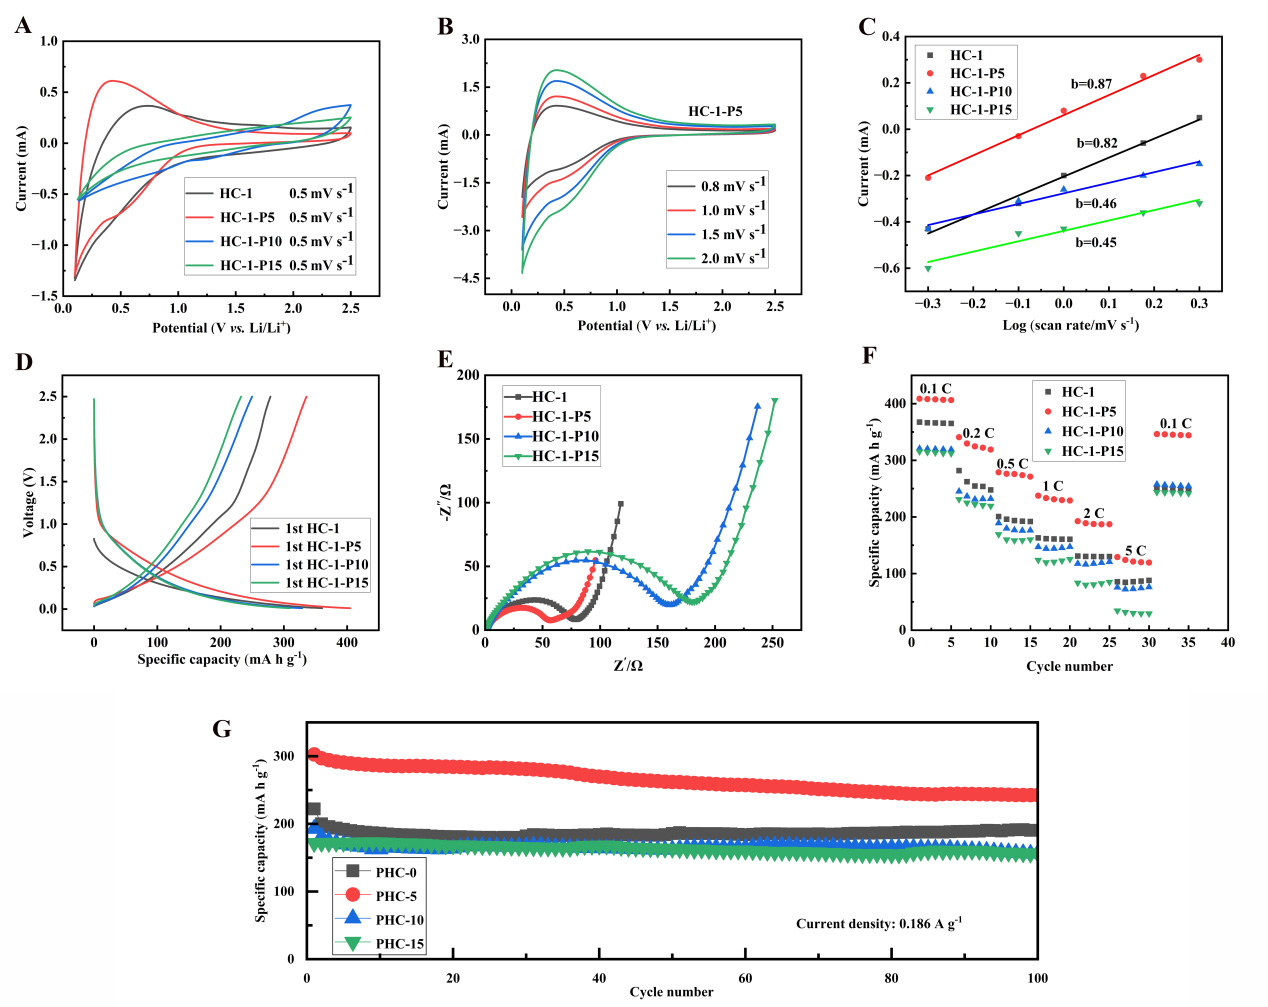
Figure 5. (A) CV curves; (B) CV profiles of HC-1-P5 at various scan rates; (C) Linear fitting plots based on CV data; (D) Initial galvanostatic charge-discharge curves of HC-1 with 5, 10, and 15 wt% phosphorus doping at 37.2 mA g-1; (E) Nyquist plots; (F) Rate capability; (G) Cycling stability measured at 0.186 A g-1. CV: Cyclic voltammetry; HC: hard carbon.


