


fig15
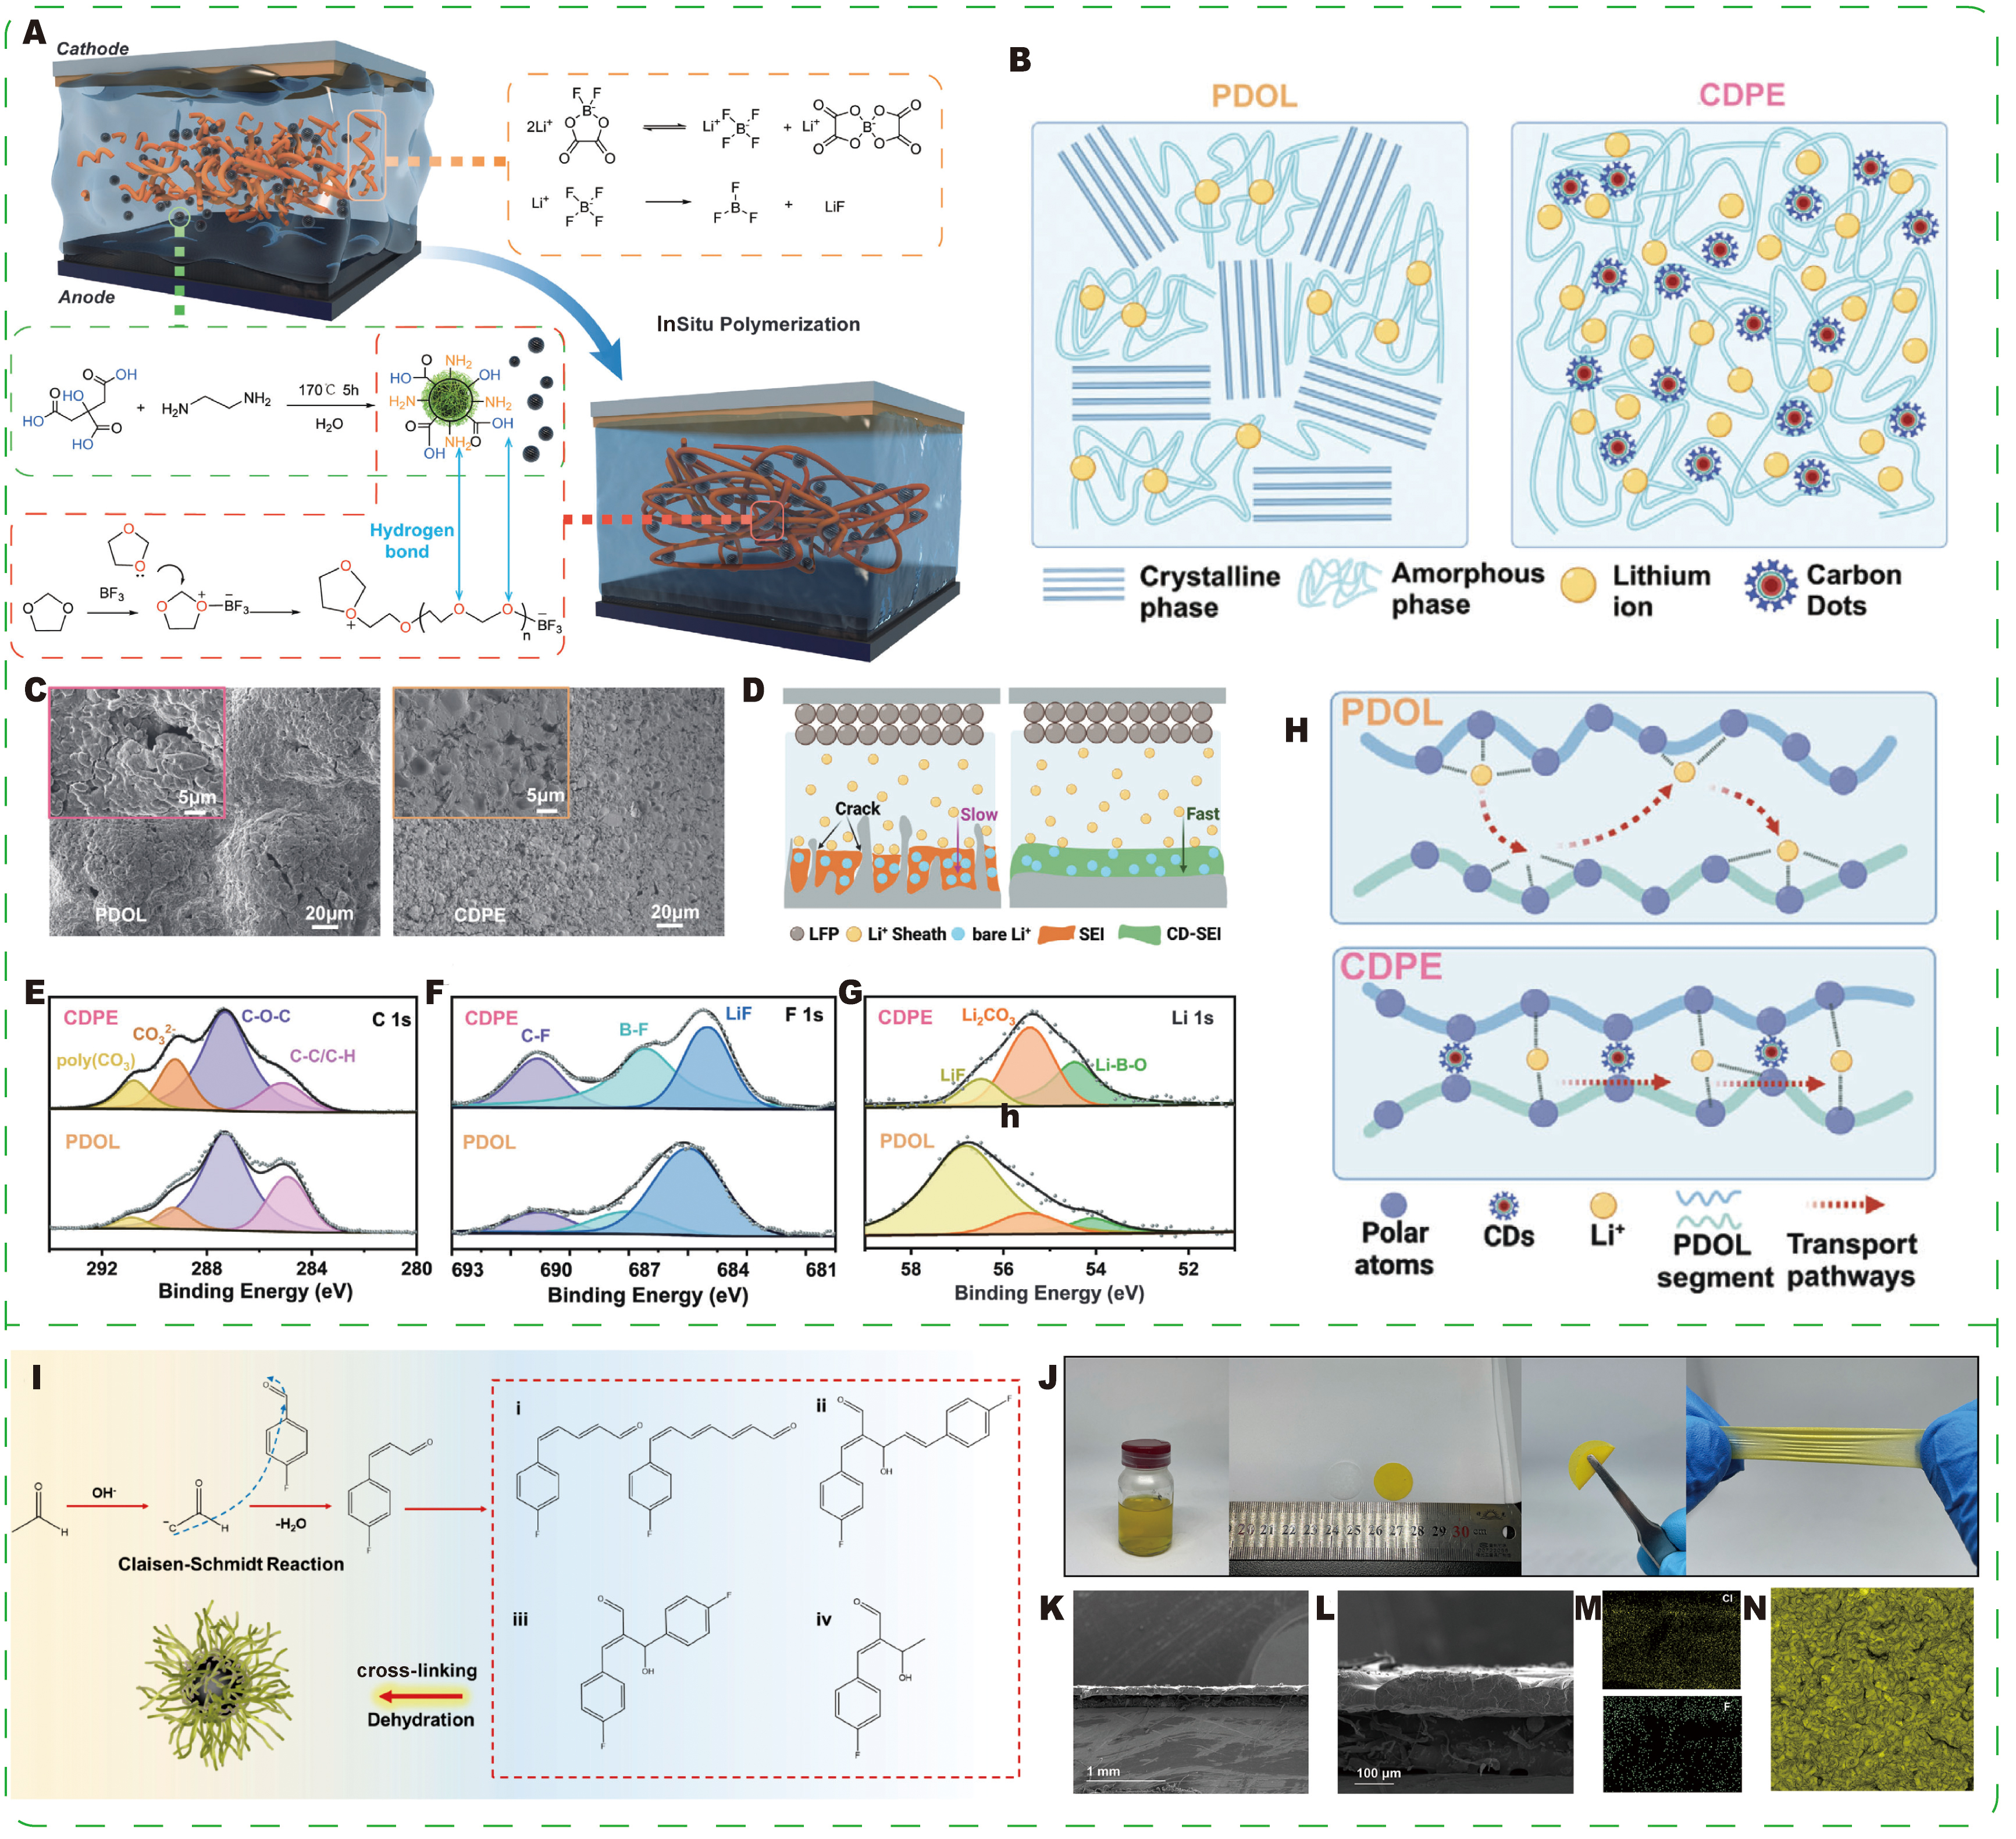
Figure 15. (A) Schematic illustration of the preparation process of CDPE. (B) Schematic illustration of the structural differences between PDOL and CDP. (C) SEM images of the lithium metal anode surface obtained after 50 cycles in Li||Li symmetric cells. (D) Schematic illustration of the mechanisms of SEI formation and lithium-ion deposition in PDOL and CDPE. (E-G) XPS analysis of the lithium metal surface after long-term cycling: (E) C 1s spectrum, (F) F 1s spectrum, and (G) Li 1s spectrum. (H) Schematic illustration of lithium-ion transport pathways in CDPE. (A-H) Reprinted with permission from Ref.[41]. Copyright © John Wiley & Sons. (I) Schematic diagram of the synthesis process of HF-CDs. (J) Digital photographs of PEO/P-FCD electrolyte slurry, electrolyte membrane, and membrane bending and stretching. (K and L) SEM cross-sectional images of the PEO/P-FCD composite electrolyte at different magnifications. (M) Elemental mapping images of chlorine (Cl) and fluorine (F). (N) Fluorescence image of the composite electrolyte. (I-K) Reprinted with permission from Ref.[143]. Copyright © American Chemical Society.


