


Figure12
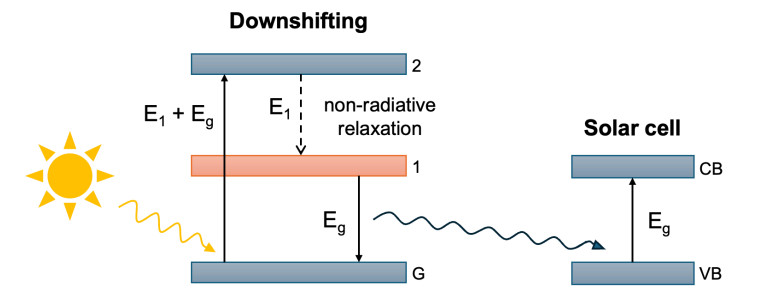
Figure 12. Band diagram for DS process visualizing the conversion of one high-energy photon into one low-energy photon tuned to the employed solar cell's bandgap.
Figure 12. Band diagram for DS process visualizing the conversion of one high-energy photon into one low-energy photon tuned to the employed solar cell's bandgap.


All published articles are preserved here permanently:
https://www.portico.org/publishers/oae/


