



fig5
From: Environmental impact of China's semi-solid-state batteries: a cradle-to-gate life cycle assessment
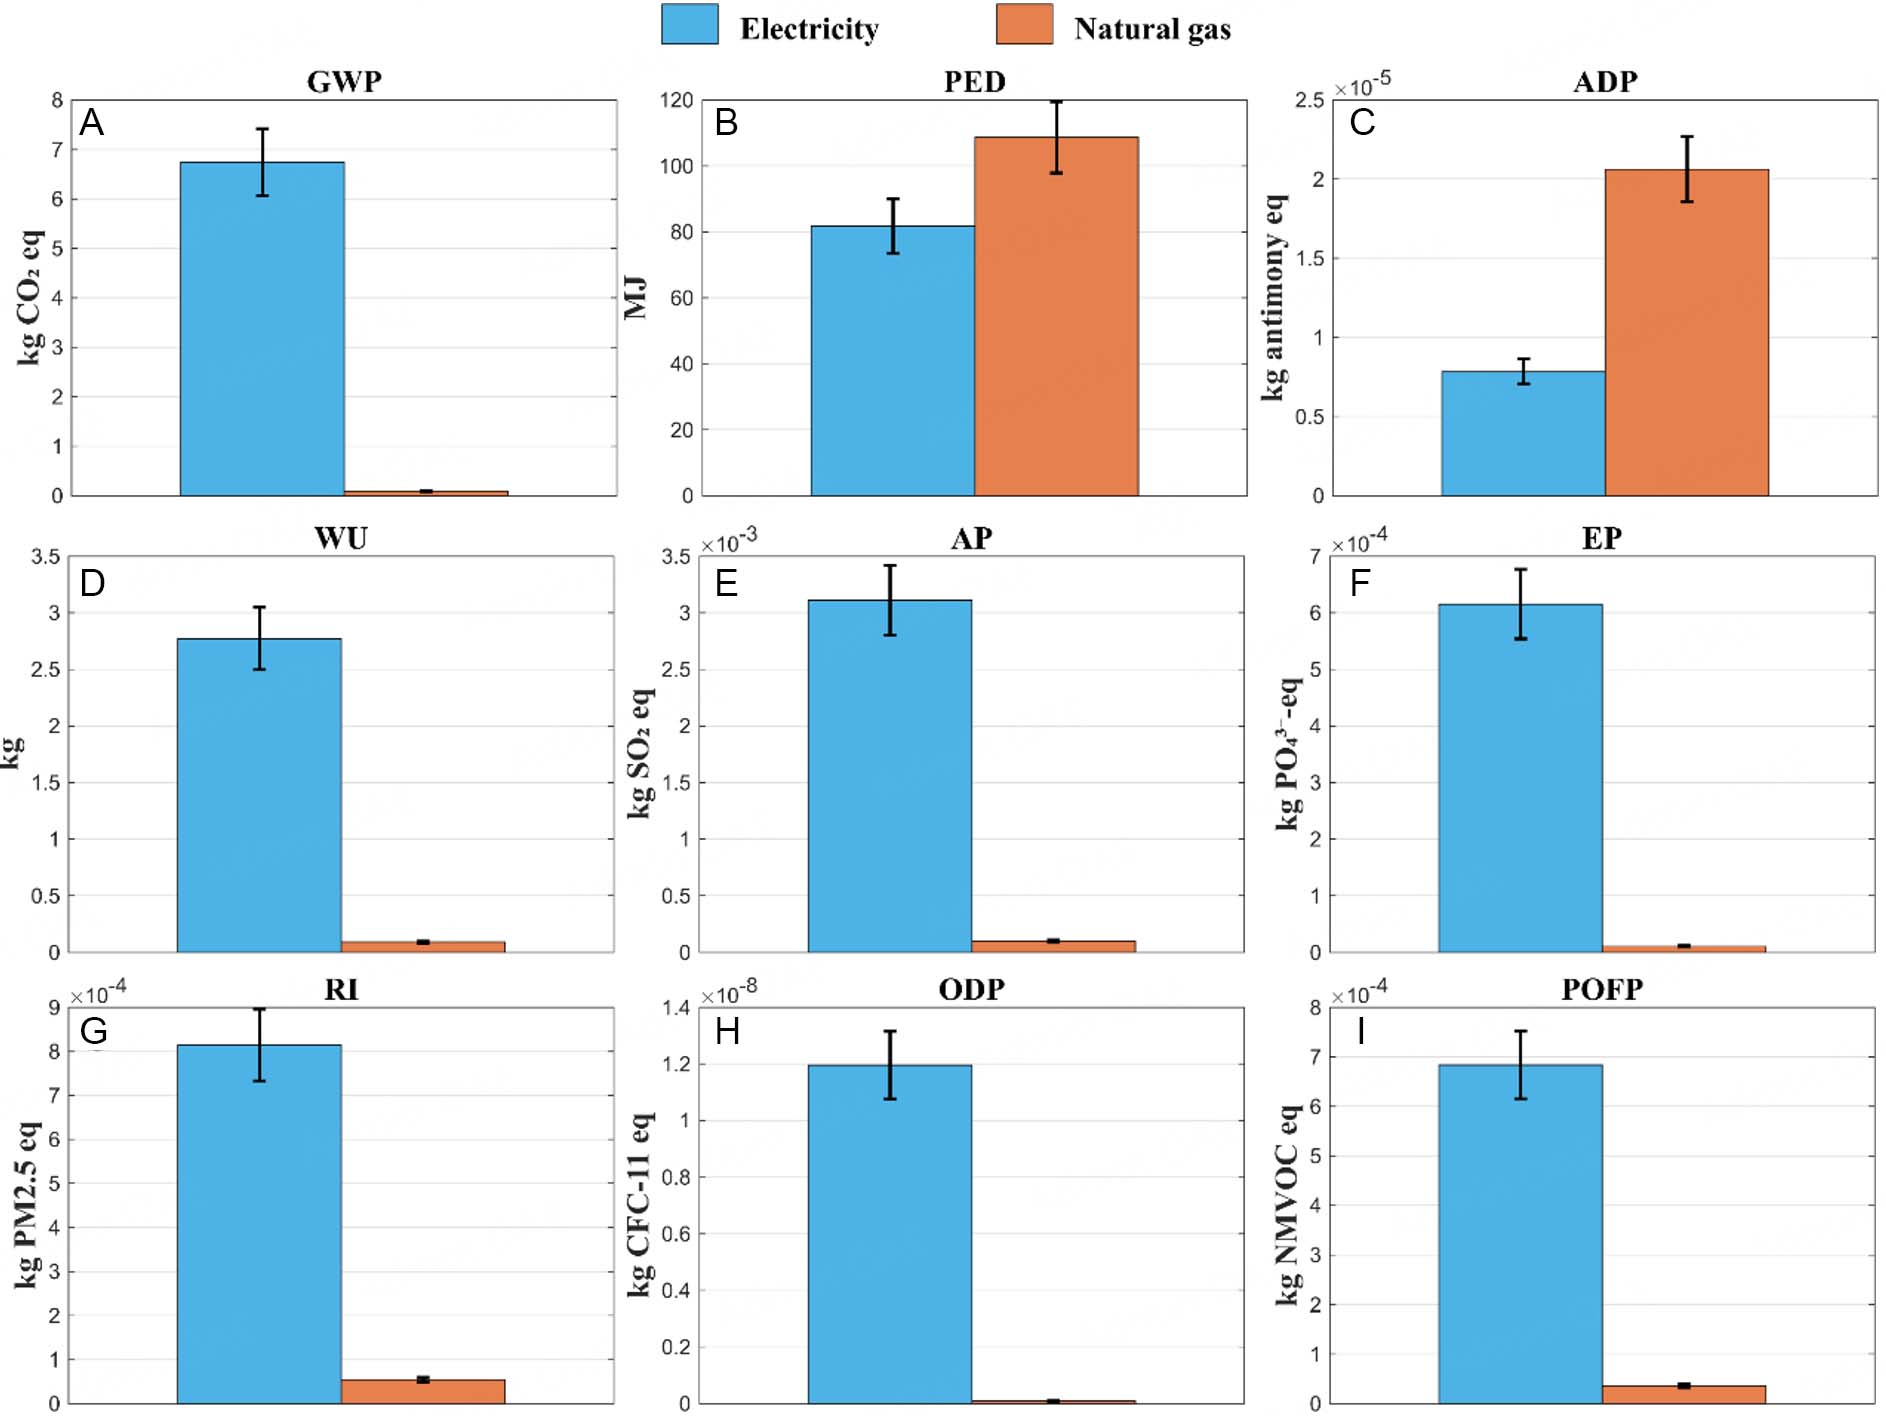
Figure 5. Results of environmental impacts in the manufacturing stage of SSSB. The figure results were calculated from[35]. (A) Global warming potential (GWP), (B) primary energy demand (PED), (C) abiotic depletion potential (ADP), (D) water use (WU), (E) acidification potential (AP), (F) eutrophication potential (EP), (G) respirable particulate formation potential (RI), (H) ozone depletion potential (ODP), (I) photochemical ozone formation potential (POFP). Error bars are fully coupled with energy uncertainty limits in Figure 4, calculated by substituting the upper and lower energy bounds of Figure 4 into the LCIA framework.





