



fig5
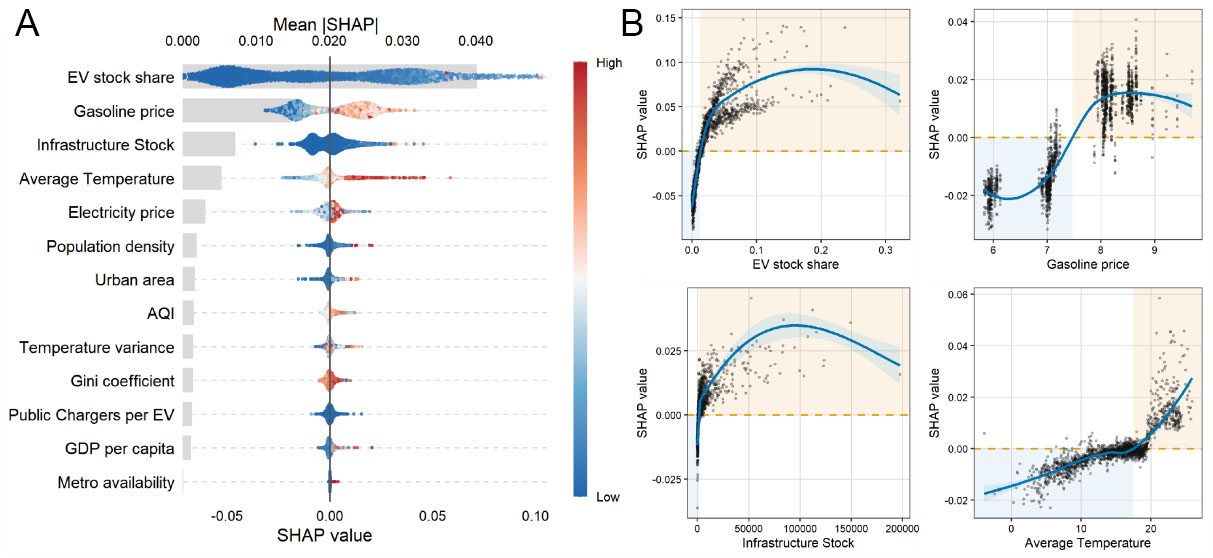
Figure 5. SHAP-based interpretation of the final random forest model. (A) SHAP summary plot for all 13 substantive predictors. Calendar year was included as a categorical control in the model but is omitted from the display. The grey bars represent the mean absolute SHAP values, while each point represents one city-year observation. Point color indicates the normalized feature value, ranging from low (blue) to high (red). Predictors are ranked according to their mean absolute SHAP values; (B) SHAP dependence plots for the four predictors with the highest point estimates of mean absolute SHAP importance: EV stock share, gasoline price, infrastructure stock, and average temperature. Black points represent individual observations, blue curves show LOESS-smoothed relationships with 95% confidence intervals, and orange dashed lines indicate a SHAP value of zero. EV: Electric vehicle; AQI: air quality index; SHAP: SHapley Additive exPlanations.





