



fig1
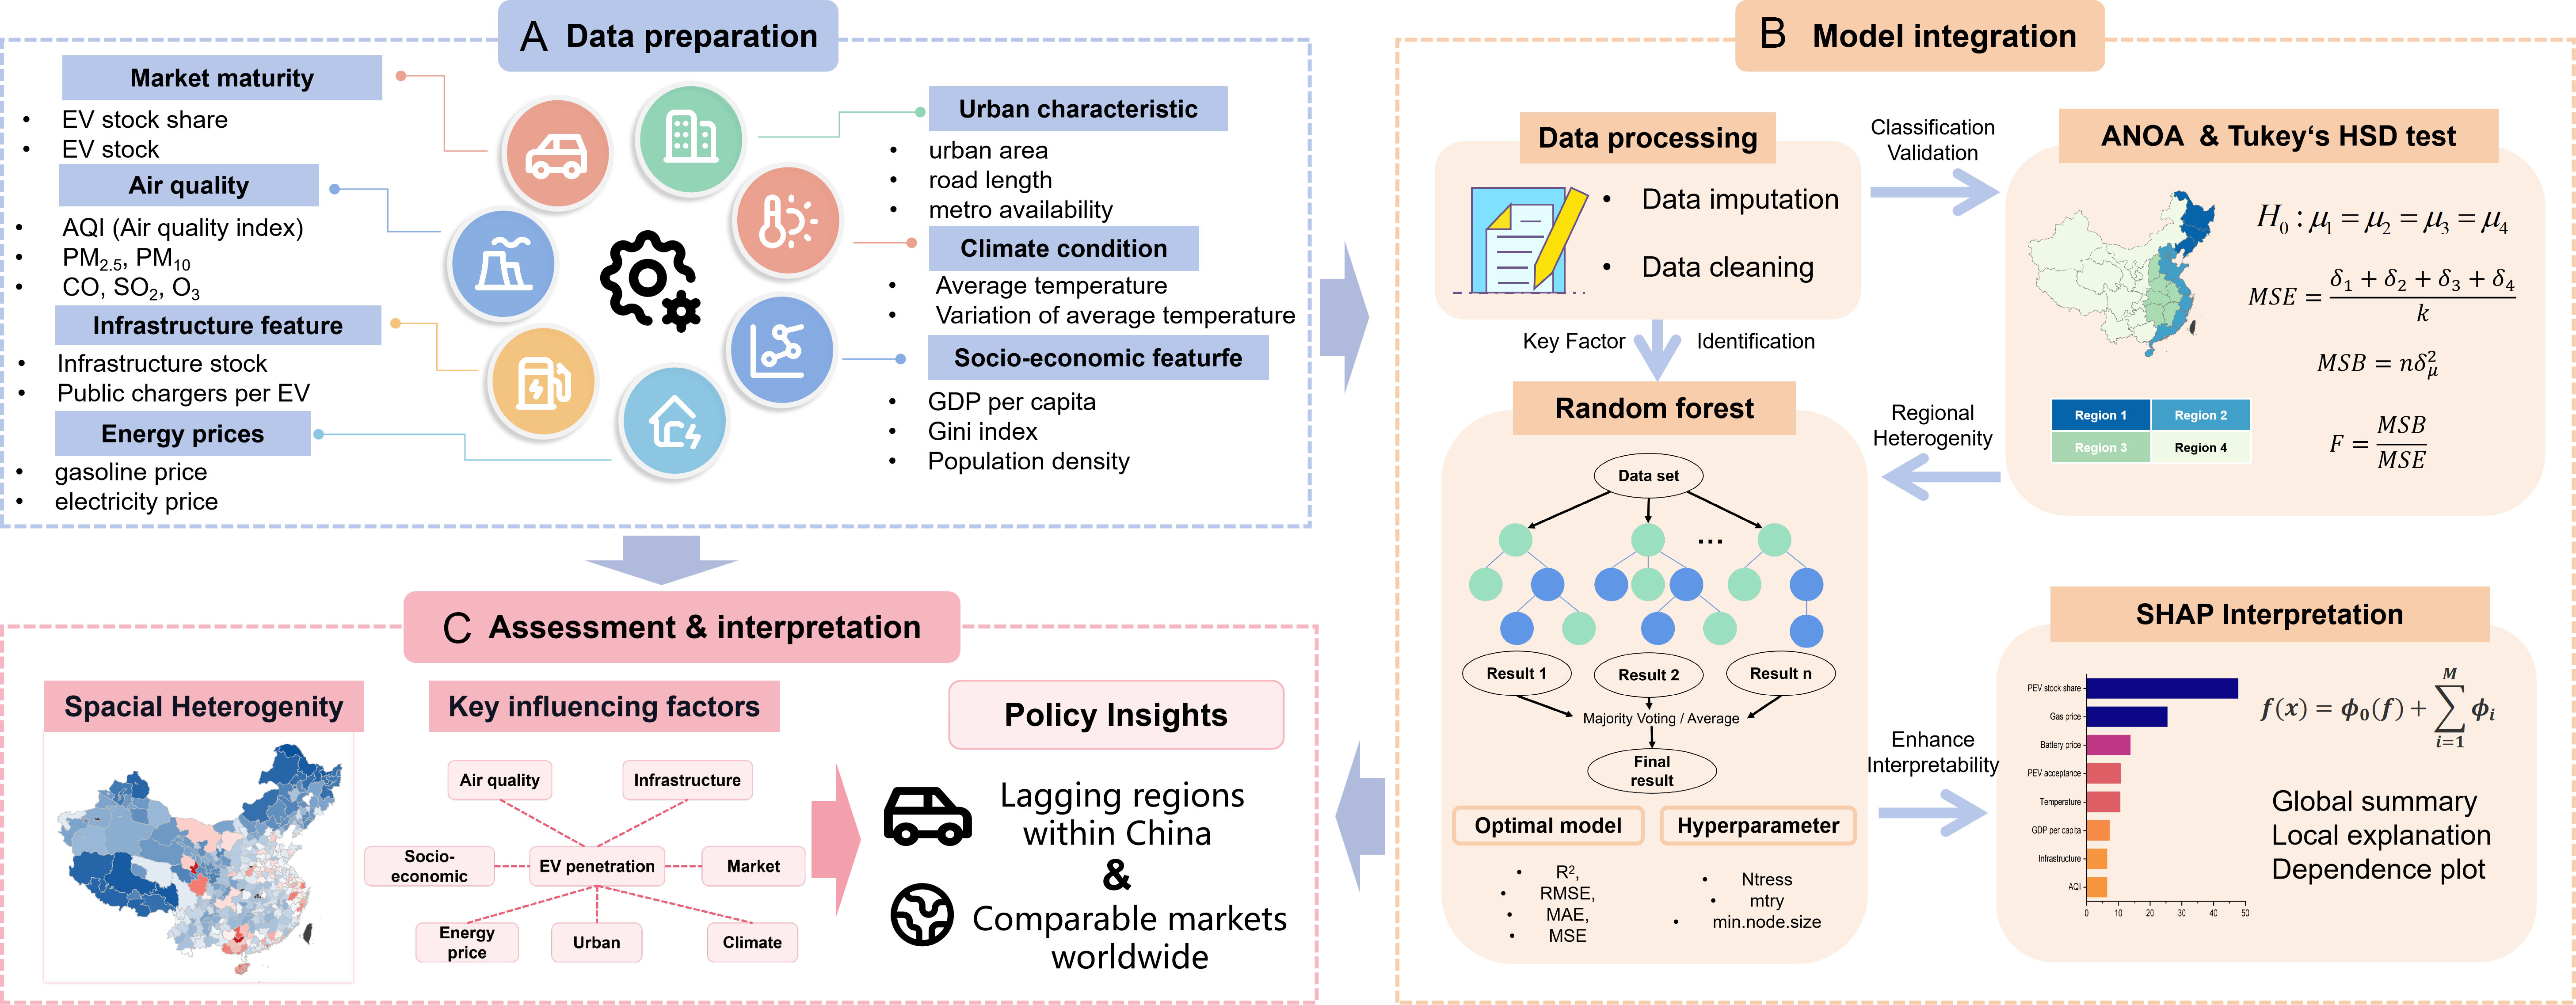
Figure 1. Overall workflow of the study; (A) Data preparation, in which a comprehensive dataset covering market maturity, public infrastructure, air quality, climate, energy prices, socioeconomic conditions, and urban characteristics was assembled; (B) Model integration, which includes data processing (imputation and cleaning), regional validation using ANOVA and Tukey’s HSD test, machine learning modeling, and SHAP interpretation; (C) Assessment and interpretation, where spatial heterogeneity is visualized, key driving factors are synthesized, and policy implications are derived to support region-specific EV promotion strategies. The base map was derived from the standard map of China approved under map approval number GS(2019)1822 and obtained from the Standard Map Service System of the Ministry of Natural Resources of the People’s Republic of China (http://bzdt.ch.mnr.gov.cn/download.html?searchText=GS(2019)1822). The base map boundaries were not modified. RMSE: Root mean squared error; MAE: mean absolute error; MSE: mean squared error; EV: electric vehicle; HSD: honestly significant difference; ANOVA: analysis of variance; SHAP: SHapley Additive exPlanations.





