



fig4

Coordinated reduction of pollutant and carbon emissions through smart city construction: TOE-based mechanisms and spatial spillovers in China

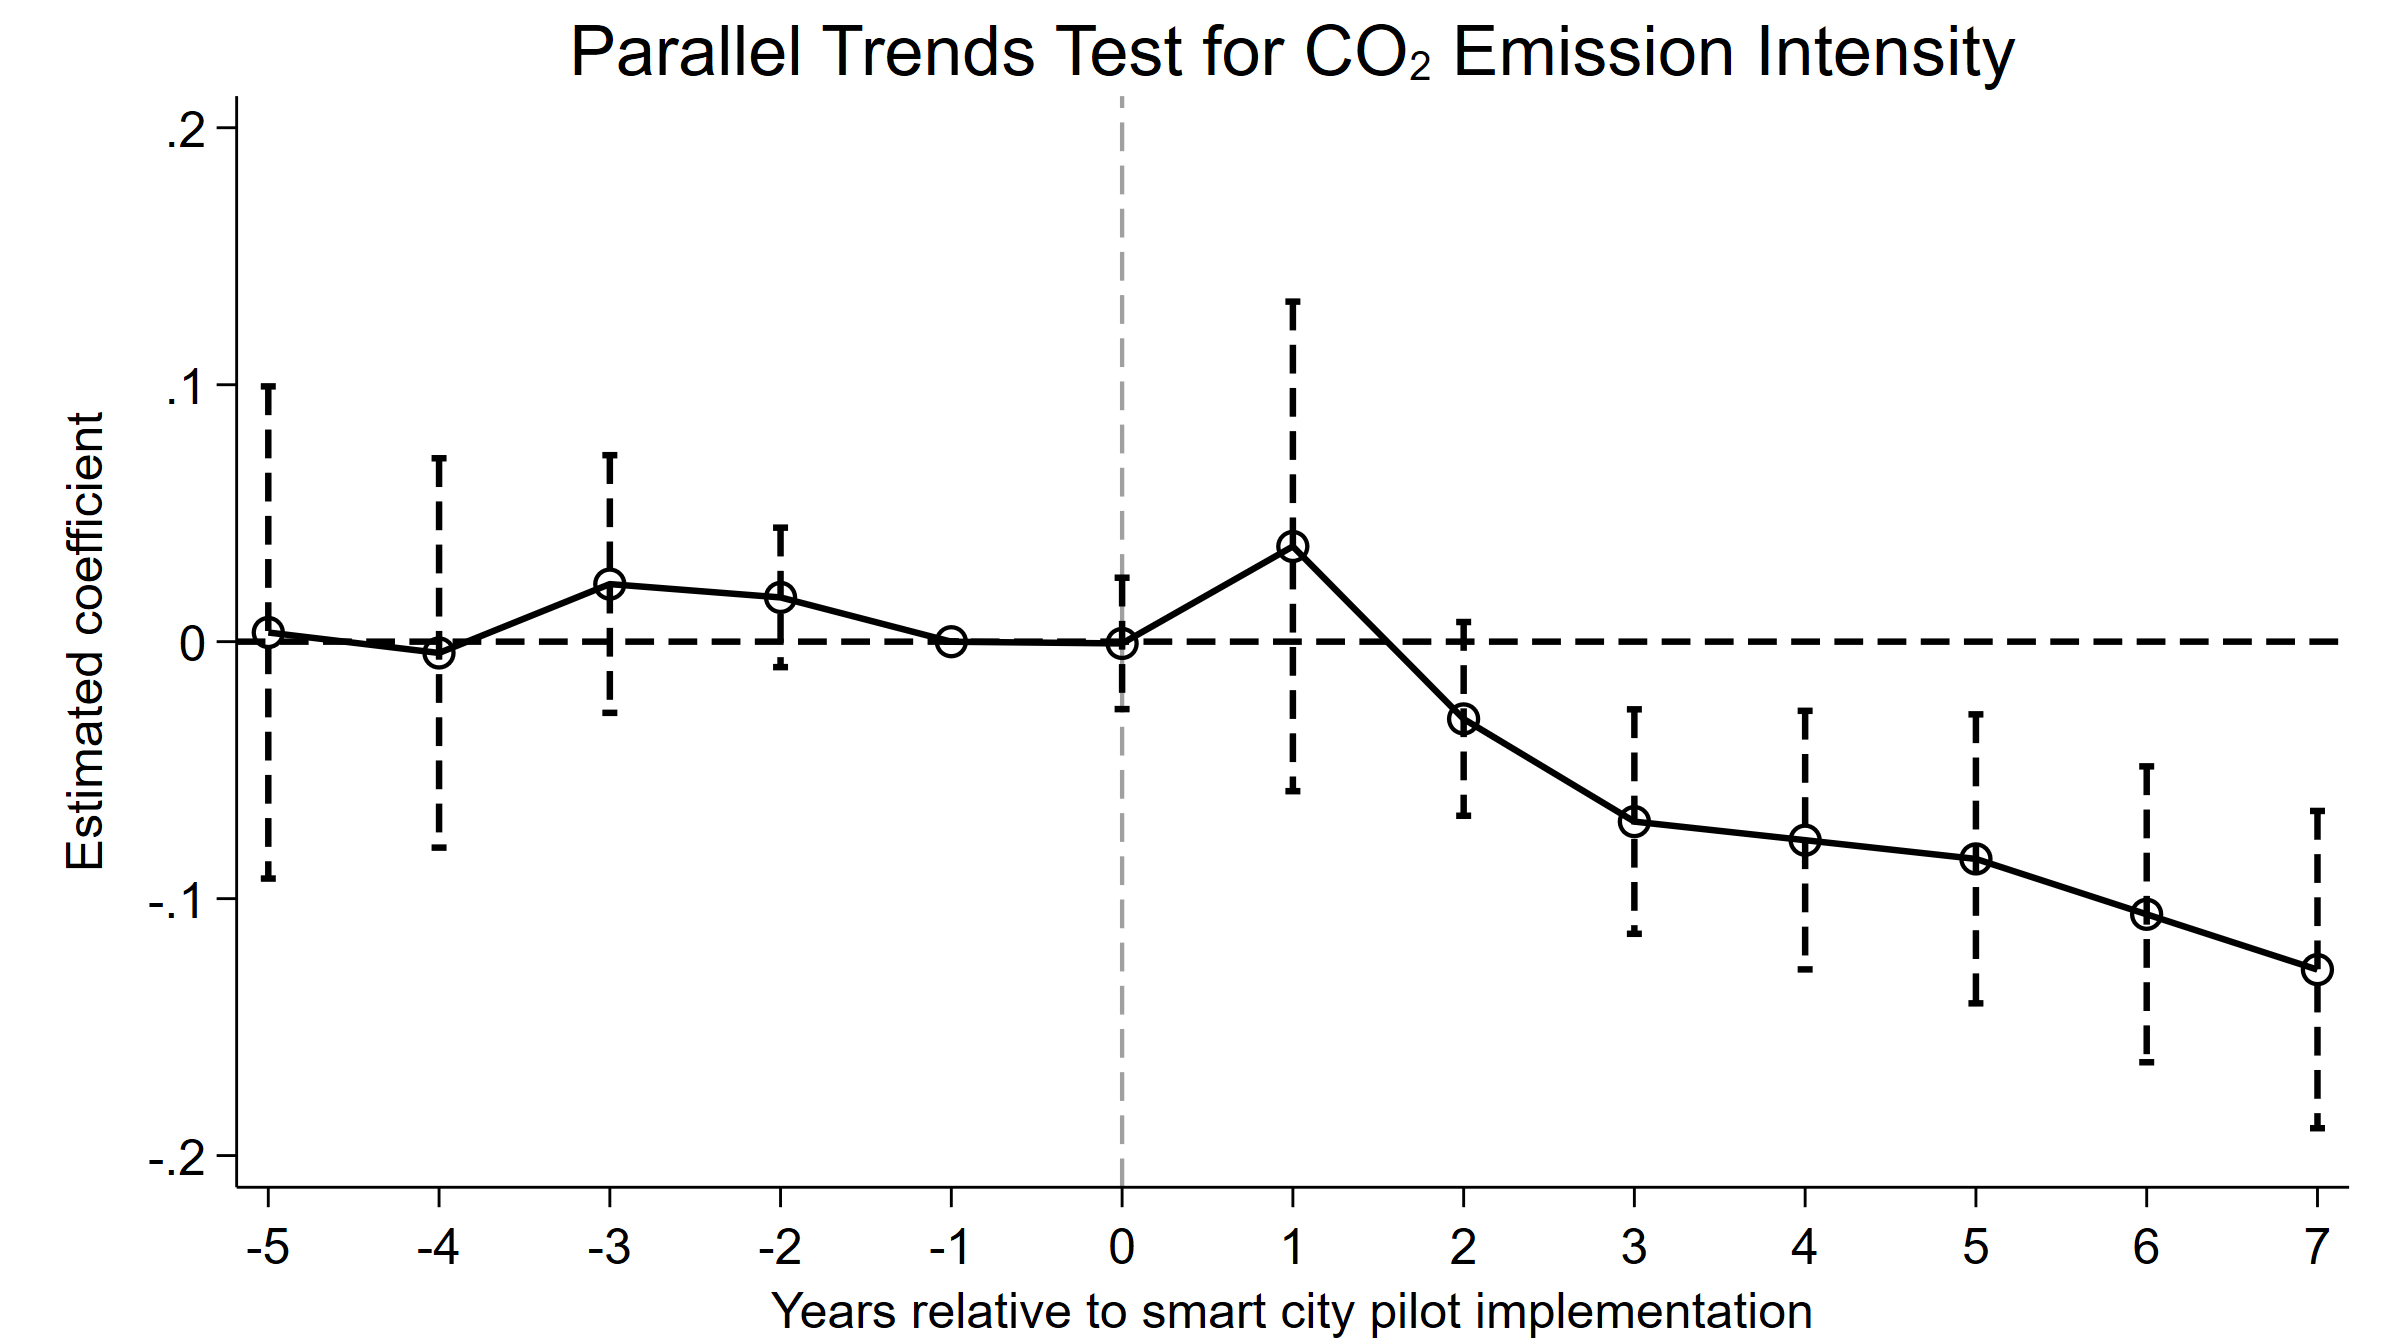
Figure 4. Parallel trend test of CO2 emission intensity. The horizontal dashed line denotes the zero-effect benchmark, the vertical dashed line marks the year of policy implementation (event time = 0), and the capped vertical bars represent 95% confidence intervals.


Carbon Footprints
ISSN 2831-932X (Online)

Portico

All published articles are preserved here permanently

https://www.portico.org/publishers/oae/

Portico

All published articles are preserved here permanently

https://www.portico.org/publishers/oae/

