



fig7
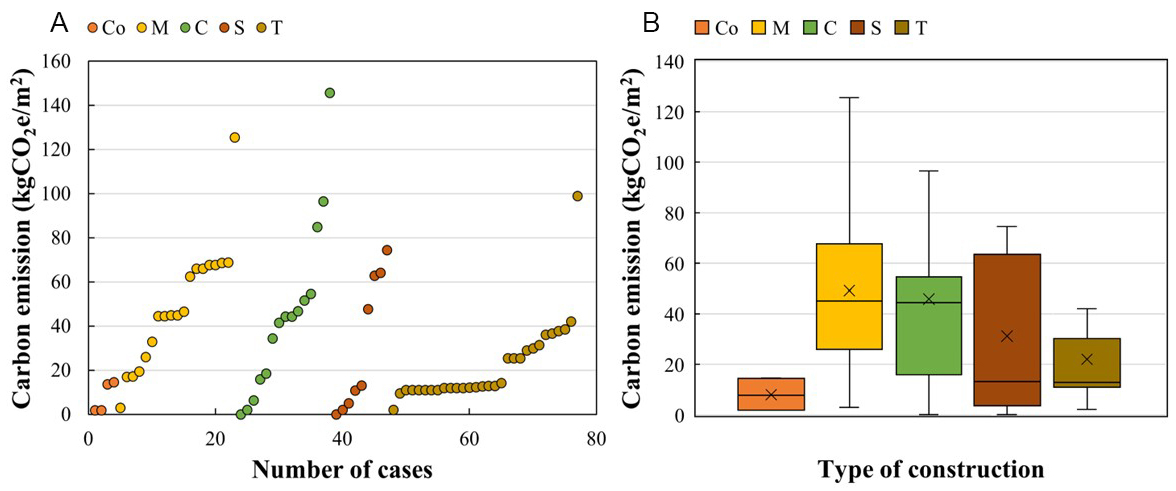
Figure 7. CEs calculation results of stage A4-A5 in the case studies. (A) Distribution of all results; (B) Quartile plot. The box range represents the interquartile range(Q1-Q3), the horizontal line inside the box indicates the median, and the cross symbol (×) denotes the mean value. 19 cases did not provide structural information. The sample sizes for Co, M, C, S, and T were 4, 19, 15, 9, and 30, respectively.





