



A review of bottom up studies on life cycle carbon emissions for rural dwellings
 0
0 Abstract
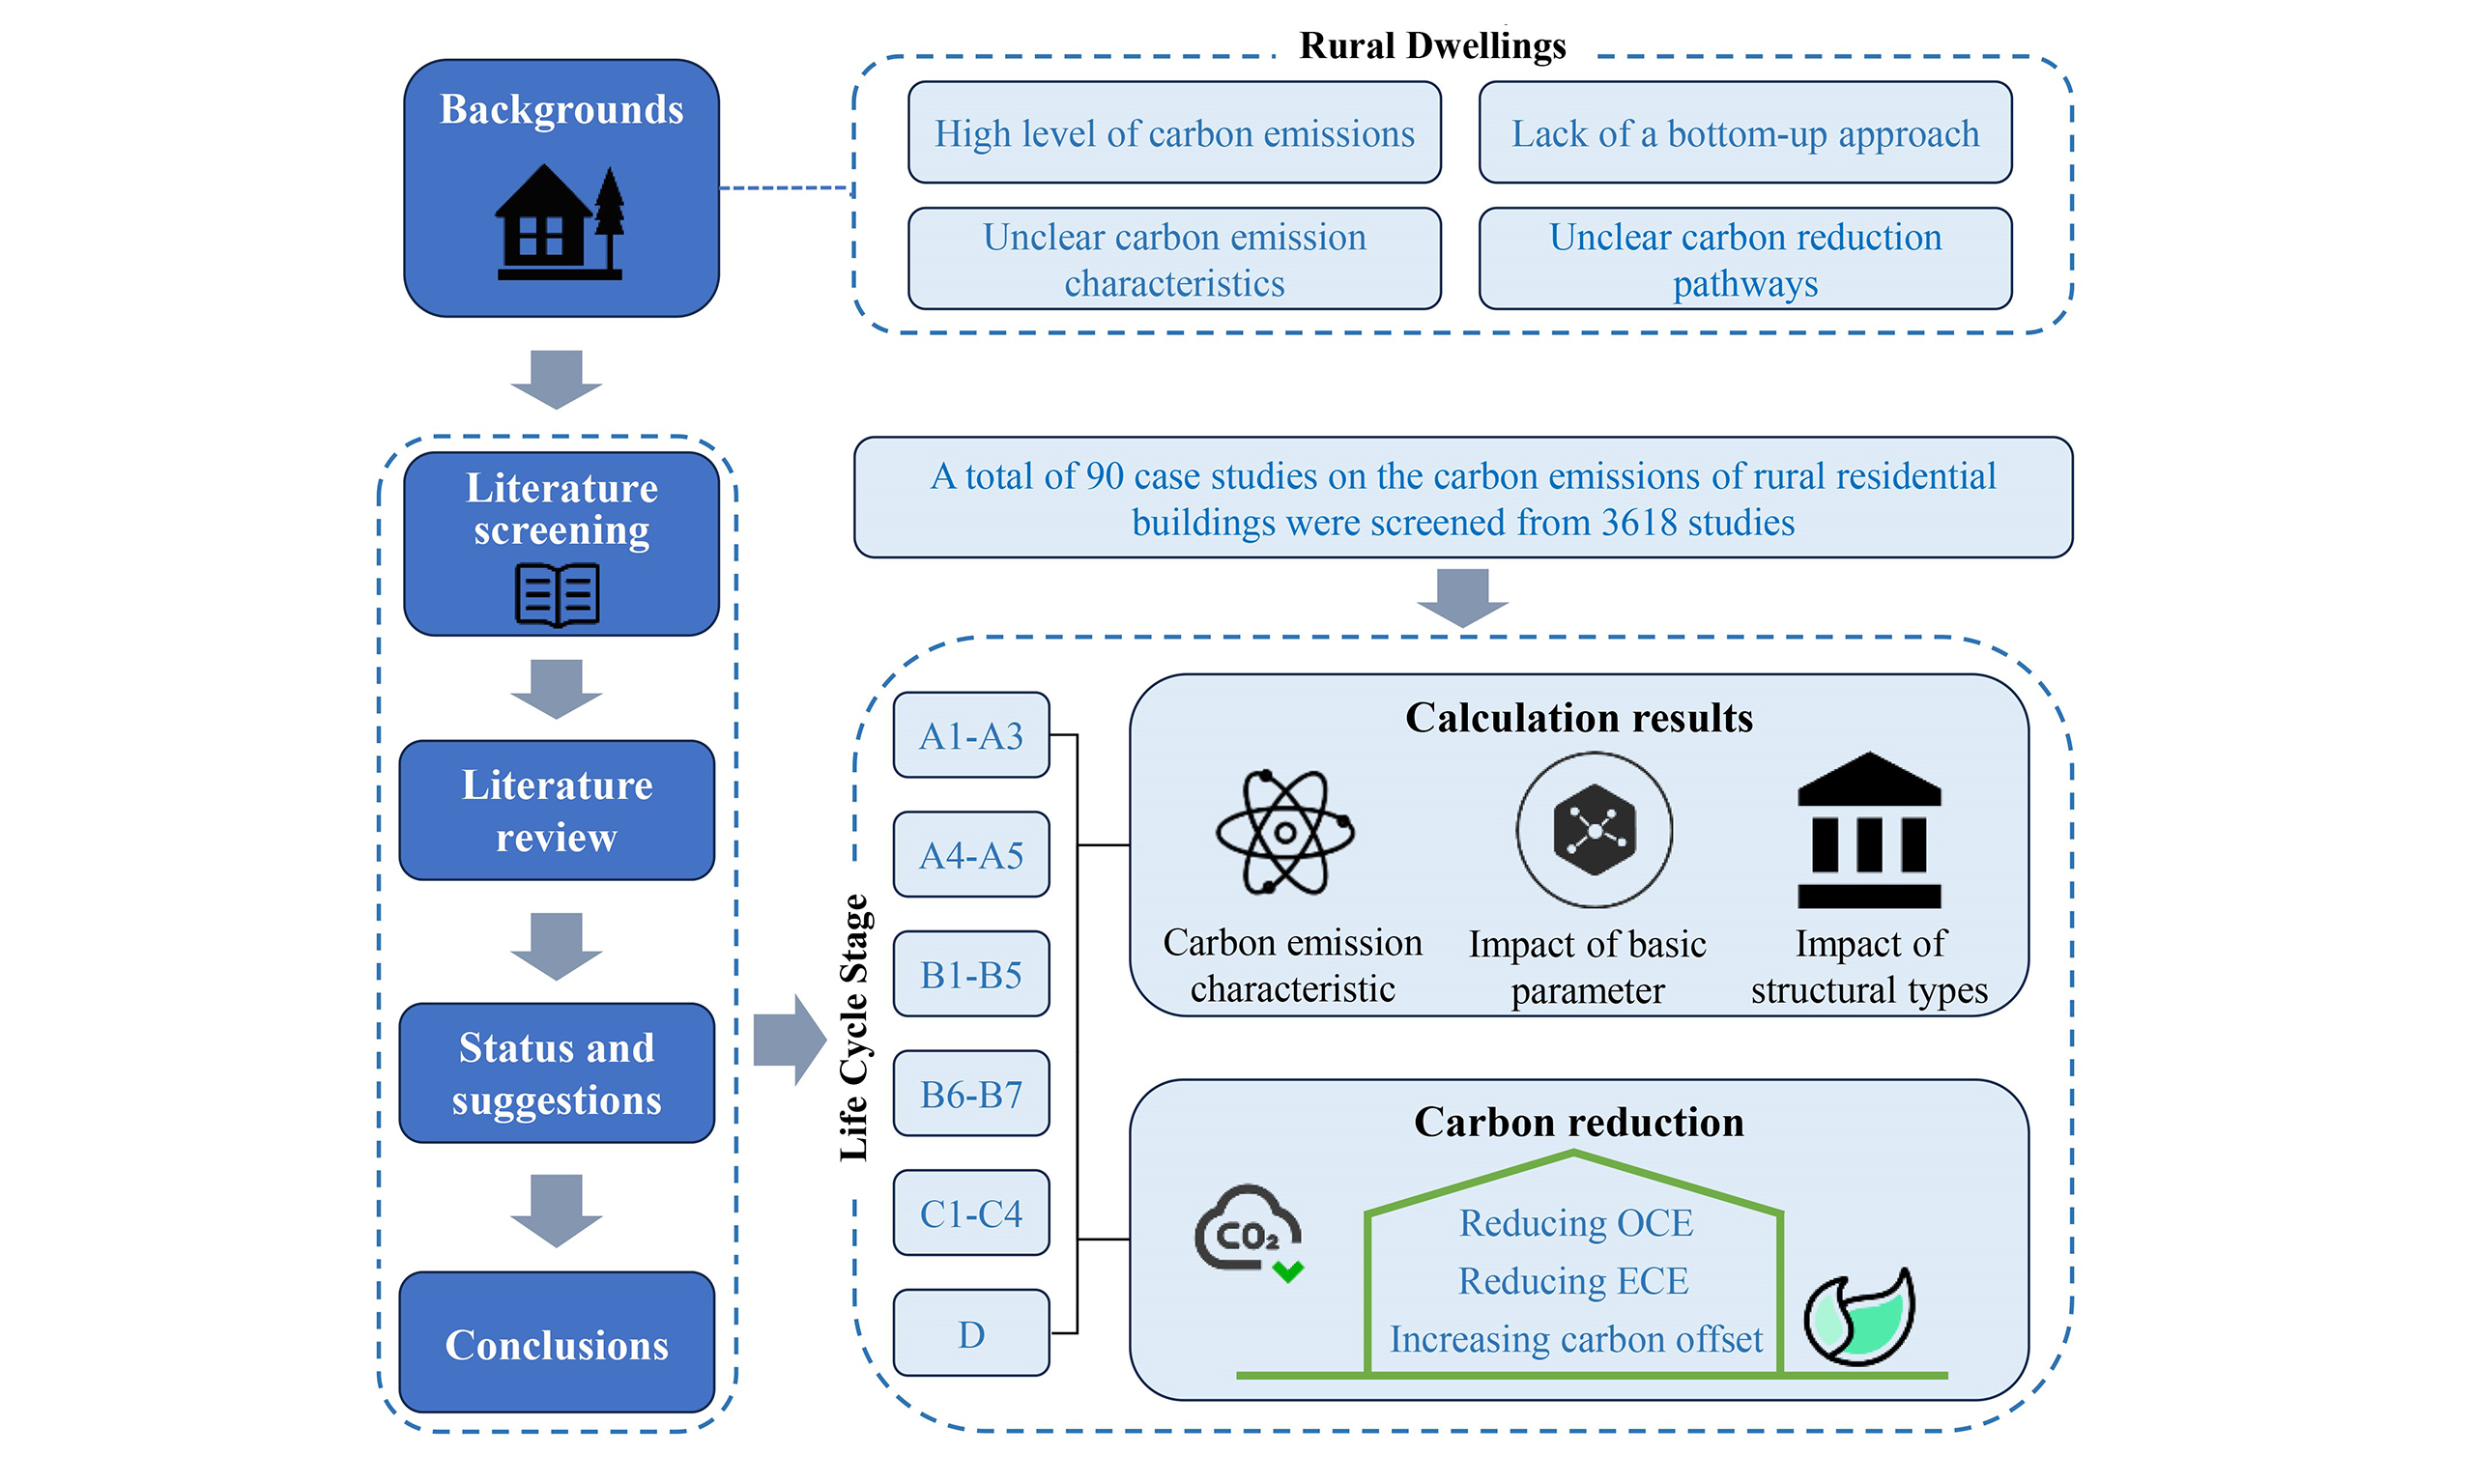
The low-carbon transition of the building sector plays a pivotal role in global carbon mitigation, yet rural dwellings remain a critical but underexplored field in decarbonization efforts. In 2024, a substantial population of 42.3% still resides in rural areas where housing contributes significantly to carbon emissions. Unlike standardized urban construction, rural dwellings are characterized by diverse building practices and energy structures, rendering conventional top-down, city-centric assessment methods inadequate for identifying the carbon emission characteristics and targeted reduction pathways of rural dwellings. To address this gap, this study presents a systematic, bottom-up review of 90 scientific studies encompassing 309 rural dwelling cases predominantly located in Asia and Europe (93.8% of cases). We conducted a stage-by-stage statistical analysis of life cycle carbon emissions (LCCE) to quantify contributions across different stages. Our findings revealed that while material production is the most frequently studied stage, the operational stage contributes the highest proportion of total LCCE. Furthermore, the carbon emission factors (CEFs) for materials and energy exhibit order-of-magnitude variations, highlighting a lack of a standardized CEF database. These results underscore the necessity of shifting from macro-level statistics to fine-grained, context-specific assessment frameworks. By synthesizing fragmented data and summarizing strategies for reducing embodied carbon, lowering operational emissions, and enhancing carbon sequestration, this study established a foundational roadmap for developing accurate standards and effective decarbonization policies tailored to rural contexts. The implications of this work are vital for guiding low-carbon transitions in rural dwellings.
Keywords
INTRODUCTION
The excessive emission of greenhouse gases has led to the continuous deterioration of the global climate[1,2]. In 2023, global carbon emissions (CEs) reached a historic high of 39.02 billion tons[3]. As one of the key sectors contributing to CEs, the construction and use of buildings can cause many environmental problems[4,5], and the building sector accounted for 34% of global CEs[6]. Energy conservation and carbon reduction in the building sector constitute one of the key pillars for achieving global carbon neutrality.
According to statistics, 42.3% of the world’s population—approximately 3.44 billion people—still resides in rural areas[7]. This is a significant figure, indicating the substantial need for rural dwellings to meet the housing demands of these populations. For example, data released by China’s National Bureau of Statistics showed that in 2024, 33.0% of the country’s total population continued to live in rural areas[8]. According to the Seventh National Population Census, there were a total of 16.8 million rural dwellings, representing 36.8% of all dwellings nationwide[9]. Similarly, in India, over 60% of the population lives in rural areas[10], also requiring a large stock of rural dwellings. Additionally, the issue of excessive construction persists in rural areas. A large number of idle houses in these areas have further added to the total housing stock. Taking a study in Guangdong Province, China, as an example, leveraging remote sensing imagery in conjunction with deep learning algorithms, this study successfully identified 5.2 million new constructions and 4.8 million legacy dwellings across the rural landscapes of Guangdong Province. Comparative analysis revealed a substantial disparity in spatial footprint, indicating that the average floor area of newly constructed residences is more than threefold that of their older counterparts[11]. As a result, rural areas are plagued by extensive over - construction, along with the squandering of resources and energy. This leads to an alarmingly high level of CEs. Therefore, to achieve global carbon neutrality, there is an urgent need to study the life cycle carbon emission (LCCE) of rural dwellings and formulate corresponding strategies to reduce carbon emissions.
Current research on the dwellings CEs in rural areas predominantly relied on macro-level statistics, employing top-down approaches to derive average CE values at the national or regional scale. For example, according to statistics by the Tsinghua University Building Energy Efficiency Research Centre in 2020, 0.51 billion tCO2 were emitted from rural dwellings, which accounted for 23.4% of China’s total CEs from building operation[12]. Ottelin et al.[13] adopted a top-down approach to assess CEs in both European urban and rural areas. Their findings revealed that, under comparable economic and household characteristics, the average CEs of dwellings in rural areas is 7% higher than those in urban areas. Pang et al.[14] employed a hybrid top-down and bottom-up approach to calculate the CEs of Swiss households, and the result showed that urban dwellings generally have lower direct CEs than rural dwellings, but higher indirect CEs. Despite highlighting the aggregate CEs of rural dwellings at national or regional levels, top-down approaches lack the resolution to present emission characteristics at the individual building level. In comparison, the bottom-up process can offer detailed CE characteristics across each life cycle stage, and promote the formulation of tailored carbon mitigation strategies.
To bridge this gap, and provide implications for environmental management and policy-making, this study conducted a comprehensive literature review based on bottom-up CE analysis of rural dwellings, and the majority of the case studies (93.8%) are concentrated in Asia and Europe. First, based on the basic framework of ISO 21930, a detailed review was conducted on the CEs at each life cycle stage of 309 cases from 90 studies, revealing issues related to calculation methods and basic parameters. Second, based on the fundamental principles of building LCCE and carbon reduction, the embodied and operational carbon emissions (OCE) mitigation technologies and their effectiveness adopted in the aforementioned cases were systematically analyzed. Finally, recommendations at a more macro level, including carrying out fundamental research on the LCCE calculation standards and basic parameters, and local technical strategies for carbon reduction were proposed.
METHODOLOGY
Literature search
This study conducted a systematic review of literature related to the CEs of rural dwellings, with a focus on the calculation methods, results, and carbon reduction strategies across the holistic life-cycle stages. The workflow consists of four main stages: (1) literature identification, (2) screening, (3) eligibility assessment, and (4) study inclusion.
A systematic literature search was performed using the Web of Science Core Collection. This database was selected as the sole source because it indexes a comprehensive range of high-impact, peer-reviewed journals in the fields of environmental science and construction engineering, ensuring the academic quality and reliability of the included studies. This study defined the following search keywords: TS = ((“carbon emission*” OR “carbon footprint*” OR “greenhouse gas*”) AND (“rural*” OR “village*”) AND ("residential" OR "housing" OR "dwelling*" OR "detached*" OR "house" OR "home*") AND (“low-carbon” OR “low-energy” OR “passive”)).
The screening process was conducted in two stages by two independent reviewers to minimize bias. First, all retrieved records were imported into Zotero (a reference management software), and duplicates were removed. Second, the remaining records were screened based on their titles and abstracts. Finally, the full texts of the potentially eligible articles were assessed against the pre-defined eligibility criteria. Any discrepancies between the reviewers were resolved through discussion or consultation with a third reviewer.
Additionally, a snowballing technique was applied to the reference lists of the initially identified articles to retrieve any potentially relevant studies not captured by the database search. In the first stage, we retrieved a total of 3,618 articles.
Inclusion and exclusion criteria
To further align with the primary research objectives of this review, we screened the titles and abstracts of 3,618 articles, followed by a full-text review of articles. Screening was conducted based on the following criteria:
(1) Lack of specific case studies: Articles that were purely theoretical, conceptual reviews, or lacked empirical data from actual building cases were excluded.
(2) Unspecified building function: Studies where the building function was not explicitly defined as residential or housing were excluded to avoid mixing with commercial or public buildings.
(3) Incompatible building scale: Studies involving high-rise buildings (more than three floors) were excluded, as this review focuses specifically on low-rise rural dwellings.
(4) Absence of quantitative data: Articles that did not provide explicit numerical results for CE calculations were excluded.
After this process, 84 articles that were specifically related to CEs of low-rise rural dwellings were retained. Additionally, 6 more studies were screened using the snowball technique (retrieving new studies through mining the reference lists of the 84 studies). Ultimately, 90 studies were screened [Figure 1]. Subsequent analyses were based on the case data from these 90 studies.
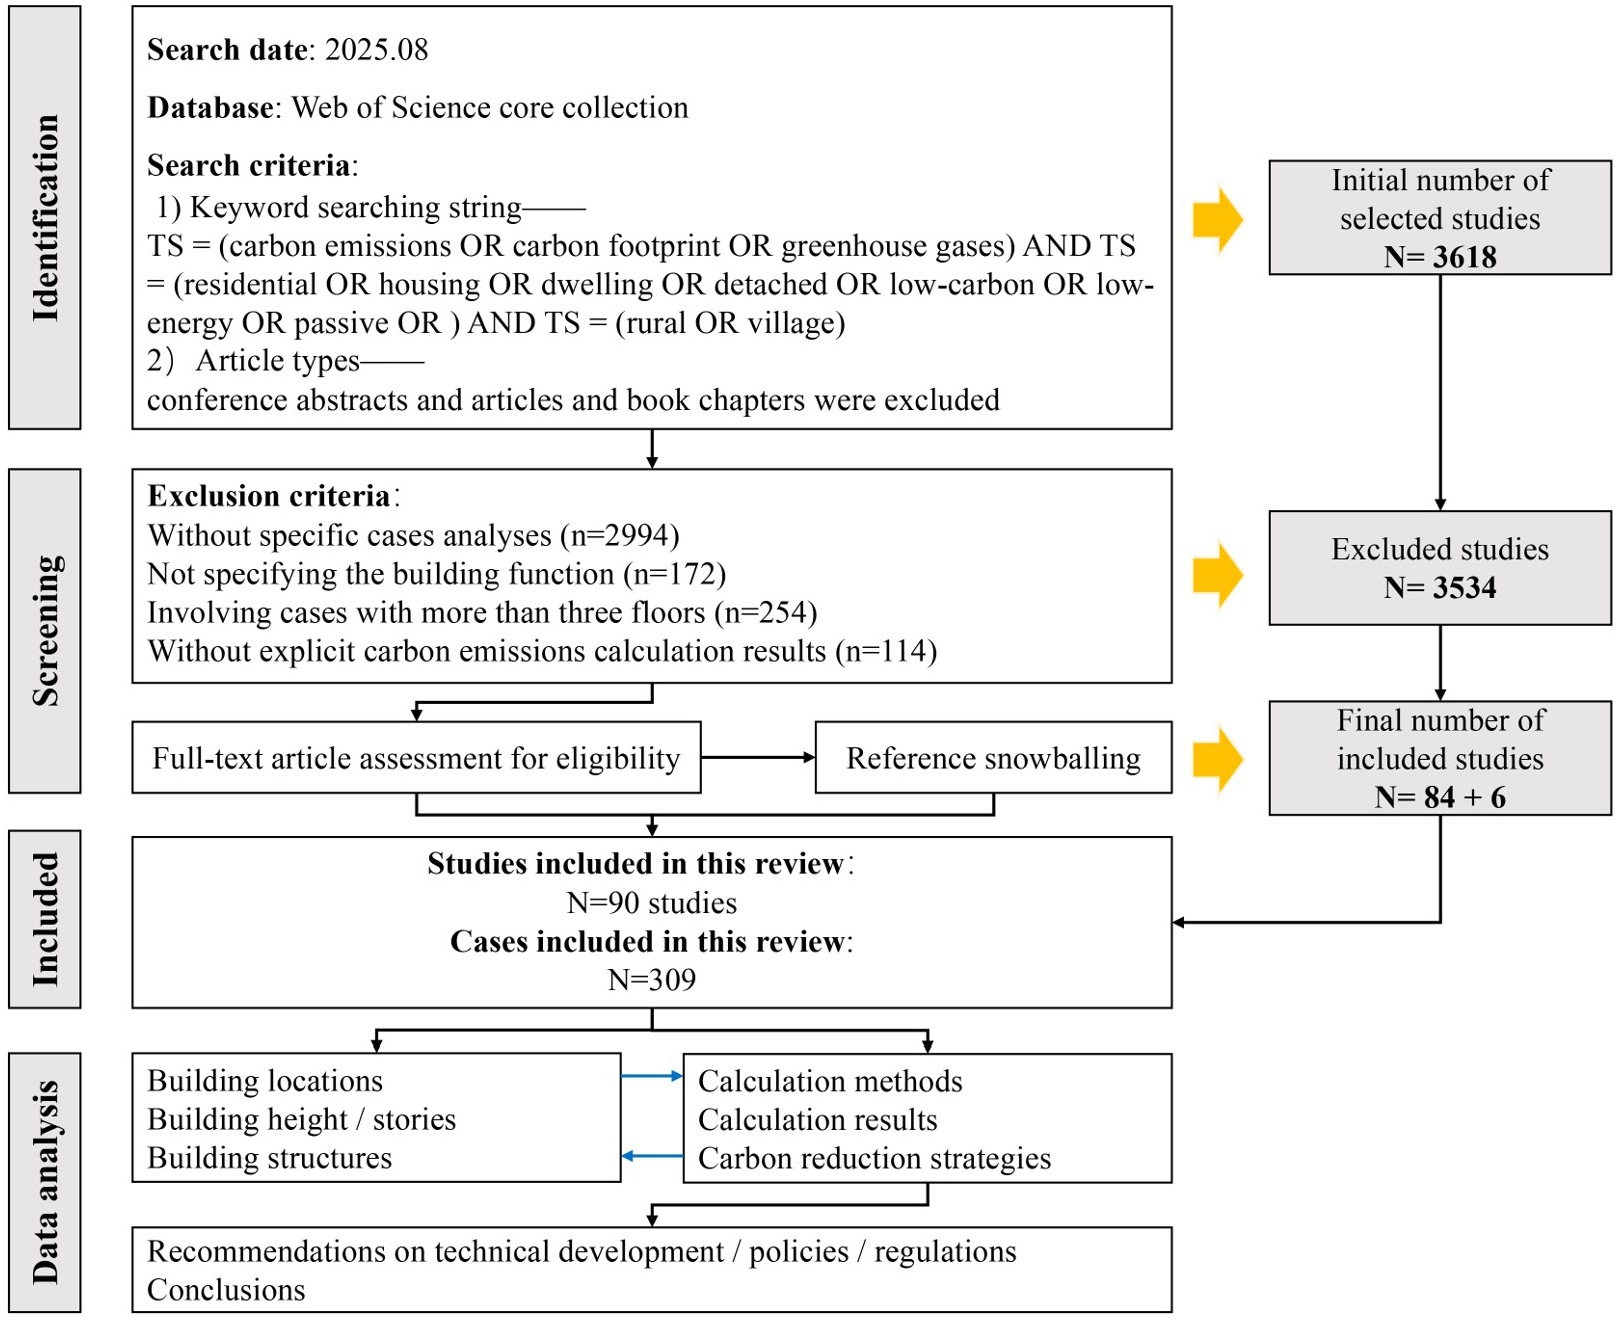
Figure 1. The selection process for the papers and the number of studies within the paper.
Data extraction
The information extracted from the aforementioned 90 studies is divided into three parts. The first part covers the basic building information, which mainly includes the building's region, climate zone, height or number of stories, structural type, and whether it holds certifications such as green or low-carbon building status. The second part focuses on the LCCE of the building cases, detailing the CEs for each life cycle stage. The third part mainly collects the carbon reduction strategies and carbon reduction effectiveness. It should be noted that since not all studies encompassed a complete life cycle scope, we only extracted the LCCE results as calculated in the respective literature. Furthermore, as the climate zone was not specified in most studies, we inferred the corresponding climate zone based on the specific geographic location of each building case.
The core of this research involves the descriptive statistical analysis of fragmented data from the aforementioned 90 studies. After extracting CE data of each life cycle stage from the selected case studies, descriptive statistics (including median) were calculated to characterize the overall dataset. The median was selected as the primary measure of central tendency due to the non-normal distribution of life cycle assessment (LCA) data. This approach allowed us to present a robust overview of current practices based on our synthesized dataset, rather than relying on potentially skewed averages from individual source papers.
Data standardization
To facilitate a unified analysis and comparison, we standardized the units of CE results from the literature. Regarding embodied carbon emission (ECE), we calculated the total amount and divided it by the gross floor area, resulting in a unit of kgCO2e/m2. As for OCE, given that the assumed service lives vary across different studies, we calculated the total OCE over the life cycle and normalized them to an annual per-square-meter basis; therefore, the unit is expressed as kgCO2e/m2/year. To maintain the authenticity of the original findings and avoid introducing bias through estimation, life cycle stages that were not reported or calculated in the primary studies were excluded from the corresponding analyses.
To address the variations in system boundaries across the collected studies, we adopted a stage-specific data extraction strategy. Rather than relying on aggregated total values, we disaggregated the CE data into distinct life cycle stages (e.g., product stage, construction, use, and end-of-life). We extracted available data for each specific module as reported in the literature. Consequently, all subsequent statistical analyses were performed separately for each life cycle stage. This approach ensures that comparisons are made between equivalent stages, thereby mitigating the impact of differing system boundaries among the source studies.
Overview of the reviewed cases
The 90 screened studies contain a total of 309 building cases. CE assessment results for 309 building instances were compiled. The geographical location, climate type, structure type, number of floors, floor area, and expected service life of the building cases are summarized in Supplementary Figures 1-6.
According to ISO 21930:2017, the holistic life cycle of a building is structured into five primary stages comprising 17 distinct modules. These include material production (A1-A3), construction (A4-A5), usage (B1-B7), end-of-life (C1-C4), and supplementary benefits (D). Notably, Module D is categorized as voluntary information falling outside the scope of the system boundary. In terms of CE categorization, CEs arising from Modules A1-A5, B1-B5, and C1-C4 are collectively termed ECE. Conversely, emissions from Modules B6-B7 are defined as OCE, with Module D serving as a factor related to both ECE and OCE.
Although ISO 21930 establishes the fundamental framework for defining life cycle stages and system boundaries in building assessments, its strict implementation is not consistently observed in practical applications. As shown in Table 1, the 90 reviewed studies were calculated for production (88, 97.8%), construction (61, 67.8%), use (48, 53.3%), and end-of-life stages (48, 53.3%). The number of studies where B6-B7 was calculated was 60 (66.7%). The number of cases where module D was calculated was only 19 (21.1%). Few studies calculated the specific modules in both the use and end-of-life stages for ECE, with the largest number being 27 (30.0%) for maintenance (B2). Sixty (66.7%) studies calculated the operational energy consumption (B6), while only eight (8.9%) calculated the operational water consumption (B7) for OCE.
Life cycle stages considered in the case studies
| Literature | Year | Location | Production stage | Cons. stage | Use stage | Use stage | End-of-life stage | D module | |||||||||||
| A1 | A2 | A3 | A4 | A5 | B1 | B2 | B3 | B4 | B5 | B6 | B7 | C1 | C2 | C3 | C4 | ||||
| Li et al.[15] | 2021 | China M. | ● | ● | ● | ○ | ○ | ○ | ○ | ○ | ○ | ○ | ○ | ○ | ○ | ○ | ○ | ||
| Zhang et al.[16] | 2021 | China M. | ● | ● | ● | ● | ● | ○ | ○ | ○ | ○ | ○ | ● | ○ | ● | ● | ○ | ○ | ○ |
| Gong et al.[17] | 2012 | China M. | ● | ● | ● | ○ | ○ | ○ | ○ | ○ | ● | ○ | ● | ○ | ○ | ○ | ○ | ||
| Yang et al.[18] | 2021 | China M. | ● | ● | ◑ | ○ | ○ | ○ | ○ | ○ | ● | ○ | ◑ | ○ | ○ | ○ | ○ | ||
| Yu et al.[19] | 2011 | China M. | ● | ● | ● | ○ | ○ | ○ | ○ | ○ | ○ | ○ | ○ | ○ | ○ | ○ | ○ | ○ | ◑ |
| Li et al.[20] | 2017 | China M. | ○ | ○ | ○ | ○ | ● | ○ | ○ | ○ | ○ | ○ | ○ | ○ | ○ | ○ | ○ | ○ | ○ |
| Zhang et al.[21] | 2023 | China M. | ● | ○ | ● | ○ | ○ | ○ | ○ | ○ | ● | ○ | ● | ○ | |||||
| Cai et al.[22] | 2023 | China M. | ● | ● | ● | ○ | ○ | ○ | ○ | ○ | ● | ● | ○ | ● | ● | ○ | ● | ||
| Liu et al.[23] | 2023 | China M. | ● | ● | ● | ○ | ○ | ○ | ○ | ○ | ● | ○ | ○ | ● | ○ | ○ | ○ | ||
| Yan et al.[24] | 2024 | China M. | ● | ● | ○ | ○ | ○ | ○ | ○ | ○ | ● | ○ | ○ | ○ | ○ | ○ | ○ | ||
| Zhao et al.[25] | 2024 | China M. | ● | ● | ● | ○ | ○ | ○ | ○ | ○ | ○ | ○ | ○ | ○ | ○ | ○ | ○ | ||
| Huang et al.[26] | 2025 | China M. | ● | ● | ● | ○ | ● | ● | ● | ○ | ● | ○ | ○ | ○ | |||||
| Song et al.[27] | 2025 | China M. | ● | ● | ● | ○ | ○ | ○ | ○ | ○ | ● | ○ | ● | ○ | ○ | ○ | ○ | ||
| Suzuki et al.[28] | 1995 | Japan | ● | ○ | ● | ○ | ○ | ○ | ○ | ○ | ○ | ○ | ○ | ○ | ○ | ○ | ○ | ||
| Gerilla et al.[29] | 2007 | Japan | ● | ◑ | ◑ | ○ | ● | ○ | ○ | ○ | ● | ○ | ○ | ○ | ○ | ◑ | ○ | ||
| Jeong et al.[30] | 2012 | South Korea | ● | ○ | ○ | ○ | ○ | ○ | ○ | ○ | ○ | ○ | ○ | ○ | ○ | ○ | ○ | ||
| Mehravar et al.[31] | 2022 | Iran | ● | ○ | ○ | ○ | ○ | ○ | ○ | ○ | ○ | ○ | ○ | ○ | ○ | ○ | ○ | ||
| Hosseinian et al.[32] | 2021 | Iran | ● | ● | ● | ● | ● | ○ | ○ | ○ | ○ | ○ | ○ | ○ | ○ | ○ | ○ | ○ | ○ |
| Piroozfar et al.[33] | 2019 | Palestine | ● | ○ | ○ | ○ | ○ | ○ | ○ | ○ | ○ | ○ | ○ | ○ | ○ | ○ | ○ | ||
| Balasbaneh et al.[34] | 2017 | Malaysia | ● | ● | ○ | ○ | ● | ○ | ○ | ○ | ○ | ○ | ○ | ● | ○ | ● | ● | ||
| Wan Omar et al.[35] | 2018 | Malaysia | ● | ● | ● | ○ | ○ | ○ | ○ | ○ | ○ | ○ | ○ | ○ | ○ | ○ | ○ | ○ | ○ |
| Balasbaneh et al.[36] | 2020 | Malaysia | ● | ● | ● | ○ | ● | ○ | ○ | ○ | ○ | ○ | ● | ● | ○ | ○ | ● | ||
| Omar et al.[37] | 2014 | Malaysia | ● | ● | ● | ○ | ○ | ○ | ○ | ○ | ○ | ○ | ○ | ○ | ○ | ○ | ○ | ○ | ○ |
| Bin Marsono et al.[38] | 2015 | Malaysia | ● | ○ | ○ | ○ | ○ | ○ | ○ | ○ | ○ | ○ | ○ | ○ | ○ | ○ | ○ | ||
| Atmaca et al.[39] | 2015 | Turkey | ● | ○ | ○ | ○ | ○ | ○ | ○ | ○ | ● | ○ | ◑ | ○ | ○ | ○ | ○ | ||
| Kayaçetin et al.[40] | 2024 | Turkey | ● | ● | ○ | ○ | ○ | ● | ○ | ● | ○ | ● | ○ | ||||||
| Myint et al.[41] | 2024 | Myanmar | ● | ● | ○ | ○ | ○ | ○ | ○ | ○ | ○ | ○ | ○ | ○ | ○ | ○ | ○ | ||
| Ajay et al.[42] | 2025 | Nepal | ● | ○ | ● | ○ | ○ | ○ | ○ | ○ | ● | ○ | ● | ○ | |||||
| Francis et al.[43] | 2024 | India | ● | ● | ○ | ○ | ● | ○ | ● | ○ | ○ | ○ | ○ | ○ | ○ | ○ | ○ | ||
| Passer et al.[44] | 2012 | Austria | ● | ● | ● | ● | ○ | ● | ● | ● | ● | ● | ○ | ○ | ● | ● | |||
| Krasny et al.[45] | 2017 | BiH | ● | ○ | ○ | ○ | ○ | ○ | ○ | ○ | ● | ○ | ○ | ○ | ○ | ○ | ○ | ||
| Pal et al.[46] | 2017 | Finland | ● | ◑ | ◑ | ○ | ● | ○ | ● | ○ | ● | ○ | ○ | ○ | ○ | ○ | ○ | ||
| Thiers et al.[47] | 2012 | France | ● | ○ | ◑ | ○ | ● | ○ | ○ | ○ | ● | ○ | ● | ○ | |||||
| Thiers et al.[48] | 2008 | France | ● | ○ | ○ | ○ | ○ | ○ | ○ | ○ | ● | ○ | ◑ | ○ | |||||
| Houlihan Wiberg et al.[49] | 2014 | Norway | ● | ○ | ○ | ○ | ○ | ○ | ● | ○ | ● | ○ | ○ | ○ | ○ | ○ | ○ | ||
| Kristjansdottir et al.[50] | 2017 | Norway | ● | ○ | ○ | ○ | ○ | ○ | ◑ | ○ | ● | ○ | ○ | ○ | ○ | ○ | ○ | ||
| Famuyibo et al.[51] | 2013 | Ireland | ● | ○ | ○ | ○ | ◑ | ○ | ○ | ○ | ● | ○ | ◑ | ○ | ○ | ○ | ○ | ||
| Moran et al.[52] | 2017 | Ireland | ● | ○ | ○ | ○ | ○ | ○ | ○ | ○ | ● | ○ | ○ | ○ | ○ | ○ | ○ | ||
| Asdrubali et al.[53] | 2013 | Italy | ● | ○ | ○ | ○ | ○ | ○ | ● | ○ | ● | ◑ | |||||||
| Blengini et al.[54,55] | 2010 | Italy | ● | ● | ● | ○ | ● | ○ | ○ | ○ | ● | ○ | ● | ○ | ● | ○ | ● | ||
| Vitale et al.[56] | 2018 | Italy | ● | ● | ● | ○ | ○ | ○ | ○ | ○ | ● | ○ | ● | ● | |||||
| Proietti et al.[57] | 2013 | Italy | ● | ● | ● | ○ | ◑ | ○ | ◑ | ○ | ● | ○ | ● | ● | ● | ● | ● | ||
| Souaid et al.[58] | 2024 | Holland | ● | ● | ● | ○ | ● | ○ | ● | ○ | ○ | ○ | ● | ● | ● | ● | ○ | ||
| Parece et al.[59] | 2024 | Portugal | ● | ○ | ○ | ○ | ○ | ○ | ● | ○ | ○ | ○ | ○ | ○ | ○ | ○ | ○ | ||
| Bastos et al.[60] | 2014 | Portugal | ● | ○ | ○ | ○ | ○ | ○ | ● | ○ | ● | ○ | ○ | ○ | ○ | ○ | ○ | ||
| Monteiro et al.[61] | 2012 | Portugal | ● | ● | ○ | ○ | ◑ | ○ | ○ | ○ | ● | ○ | ○ | ○ | ○ | ○ | ○ | ||
| Zabalza Bribián et al.[62] | 2009 | Spain | ● | ○ | ○ | ○ | ○ | ○ | ○ | ○ | ● | ○ | ○ | ○ | ○ | ○ | ○ | ||
| Ortiz et al.[63] | 2009 | Spain | ● | ● | ○ | ○ | ● | ○ | ○ | ○ | ● | ○ | ○ | ○ | ○ | ○ | ○ | ||
| Pacheco-Torres et al.[64] | 2014 | Spain | ● | ● | ● | ○ | ● | ○ | ○ | ○ | ○ | ○ | ○ | ○ | ○ | ○ | ○ | ○ | ○ |
| Davis et al.[65] | 2024 | Spain | ● | ● | ● | ○ | ○ | ○ | ● | ○ | ● | ● | ○ | ○ | ○ | ○ | ○ | ||
| Izaola et al.[66] | 2023 | Spain | ● | ○ | ○ | ○ | ○ | ○ | ● | ○ | ○ | ○ | ○ | ○ | ○ | ||||
| Petrović et al.[67] | 2023 | Sweden | ● | ● | ● | ● | ● | ● | ● | ||||||||||
| Gustavsson et al.[68] | 2010 | Sweden | ● | ● | ● | ○ | ◑ | ○ | ○ | ○ | ○ | ○ | ● | ○ | ◑ | ○ | ○ | ◑ | ● |
| Gustavsson et al.[69] | 2010 | Sweden | ● | ○ | ○ | ○ | ○ | ○ | ○ | ○ | ● | ○ | ○ | ○ | ○ | ○ | ○ | ||
| Nässén et al.[70] | 2007 | Sweden | ● | ● | ● | ○ | ○ | ○ | ○ | ○ | ○ | ○ | ○ | ○ | ○ | ○ | ○ | ||
| Karami et al.[71] | 2015 | Sweden | ● | ● | ● | ○ | ○ | ○ | ○ | ○ | ○ | ○ | ● | ○ | ○ | ○ | ○ | ○ | ○ |
| Petrovic et al.[72] | 2019 | Sweden | ● | ● | ● | ○ | ● | ○ | ● | ○ | ● | ● | ◑ | ○ | |||||
| Peñaloza et al.[73] | 2016 | Sweden | ● | ● | ● | ○ | ○ | ○ | ○ | ○ | ○ | ○ | ● | ○ | ● | ◑ | |||
| Jonsson et al.[74] | 1998 | Sweden | ● | ○ | ○ | ● | ○ | ○ | ● | ○ | |||||||||
| Citherlet et al.[75] | 2007 | Switzerland | ● | ○ | ● | ○ | ● | ○ | ● | ○ | ● | ||||||||
| Bertini et al.[76] | 2025 | Belgium | ● | ● | ● | ○ | ○ | ○ | ● | ○ | ● | ○ | ○ | ○ | ● | ● | ○ | ||
| Norouzi et al.[77] | 2025 | UK | ● | ● | ● | ● | ● | ○ | ● | ○ | |||||||||
| Keyhani et al.[78] | 2024 | UK | ● | ○ | ● | ● | ● | ○ | ○ | ○ | ○ | ○ | ● | ● | ○ | ||||
| Mohammadpourkarbasi et al.[79] | 2023 | UK | ○ | ○ | ○ | ○ | ○ | ○ | ○ | ○ | ○ | ○ | ● | ○ | ○ | ○ | ○ | ○ | ○ |
| Norouzi et al.[80] | 2023 | UK | ● | ● | ● | ● | ● | ● | ● | ● | ○ | ● | ● | ||||||
| Newberry et al.[81] | 2023 | UK | ● | ● | ○ | ○ | ○ | ● | ○ | ● | ○ | ● | ○ | ||||||
| Cuéllar-Franca et al.[82] | 2012 | UK | ● | ● | ● | ○ | ● | ○ | ○ | ○ | ● | ◑ | ● | ● | ● | ○ | ● | ||
| Moncaster et al.[83] | 2013 | UK | ◑ | ◑ | ◑ | ○ | ○ | ◑ | ◑ | ◑ | ○ | ○ | ◑ | ◑ | ◑ | ◑ | ○ | ||
| Monahan et al.[84] | 2011 | UK | ● | ● | ● | ○ | ○ | ○ | ○ | ○ | ○ | ○ | ○ | ○ | ○ | ○ | ○ | ||
| Asif et al.[85] | 2007 | UK | ● | ○ | ○ | ○ | ○ | ○ | ○ | ○ | ○ | ○ | ○ | ○ | ○ | ○ | ○ | ||
| Iddon et al.[86] | 2013 | UK | ● | ○ | ○ | ○ | ○ | ○ | ● | ○ | ● | ○ | ○ | ○ | ○ | ○ | ○ | ||
| Hacker et al.[87] | 2008 | UK | ● | ○ | ○ | ○ | ○ | ○ | ○ | ◑ | ● | ○ | ○ | ○ | ○ | ○ | ○ | ||
| Essaghouri et al.[88] | 2023 | Morocco | ● | ○ | ○ | ○ | ○ | ○ | ● | ○ | ○ | ○ | ○ | ○ | ○ | ||||
| Hansen et al.[89] | 2024 | Denmark | ● | ○ | ○ | ○ | ○ | ○ | ● | ○ | ○ | ○ | ○ | ○ | ● | ● | ○ | ||
| Rossi et al.[90] | 2012 | BE + PT + SE | ● | ○ | ○ | ◑ | ● | ○ | ○ | ○ | ○ | ○ | ○ | ||||||
| Rossi et al.[91] | 2012 | BE + PT + SE | ● | ◑ | ◑ | ◑ | ● | ○ | ○ | ◑ | ○ | ○ | ○ | ||||||
| Hafner et al.[92] | 2017 | DE + AT | ● | ○ | ○ | ○ | ● | ○ | ● | ○ | ○ | ○ | ○ | ○ | ● | ● | ○ | ||
| Quintana-Gallardo et al.[93] | 2021 | DE + SI + ES | ● | ● | ● | ○ | ● | ○ | ● | ● | ● | ● | ○ | ● | ● | ● | ○ | ||
| Moghayedi et al.[94] | 2025 | South Africa | ● | ● | ● | ○ | ● | ○ | ○ | ● | ● | ○ | ● | ● | ● | ● | ● | ||
| Moghayedi et al.[95] | 2024 | Africa | ● | ● | ● | ● | ○ | ○ | ○ | ○ | ○ | ● | ● | ||||||
| Salazar et al.[96] | 2009 | Canada | ● | ● | ● | ○ | ○ | ● | ○ | ○ | ○ | ○ | ● | ○ | ● | ||||
| Zhang et al.[97] | 2014 | Canada | ● | ● | ● | ○ | ● | ○ | ● | ● | ● | ○ | ● | ● | ○ | ○ | ○ | ||
| Keoleian et al.[98] | 2001 | USA | ● | ○ | ● | ○ | ● | ○ | ○ | ○ | ● | ○ | ● | ● | ○ | ● | ○ | ||
| Arvizu-Piña et al.[99] | 2023 | Mexico | ● | ○ | ○ | ○ | ○ | ○ | ● | ○ | ○ | ○ | ○ | ○ | ○ | ||||
| Ortiz et al.[100,101] | 2010 | CO + ES | ● | ● | ● | ○ | ● | ○ | ○ | ○ | ● | ○ | ○ | ○ | ○ | ○ | ○ | ||
| Sandanayake et al.[102] | 2016 | Australia | ● | ● | ● | ○ | ○ | ○ | ○ | ○ | ○ | ○ | ○ | ○ | ○ | ○ | ○ | ||
| Mosteiro-Romero et al.[103] | 2014 | USA + CH | ● | ● | ● | ○ | ◑ | ○ | ◑ | ○ | ● | ○ | ● | ● | ○ | ○ | ● | ||
| Shi et al.[104] | 2023 | CN + Fin | ● | ● | ○ | ● | ● | ○ | ● | ● | |||||||||
| Summary | |||||||||||||||||||
| Sum - stages/modules | Total | 88 (97.8%) | 61 (67.8%) | 48 (53.3%) | 60 (66.7%) | 48 (53.3%) | 19 (21.1%) | ||||||||||||
| Calculated (●) | 87 (96.7%) | 55 (51.1%) | 39 (43.3%) | 60 (66.7%) | 39 (43.3%) | 16 (17.8%) | |||||||||||||
| Quoted (◑) | 1 (1.1%) | 6 (6.7%) | 9 (10.0%) | 0 (0%) | 9 (10.0%) | 3 (3.3%) | |||||||||||||
| Sum - items | Total | 88 (97.8%) | 53 (58.9%) | 54 (60.0%) | 2 (2.2%) | 27 (30.0%) | 2 (2.2%) | 23 (25.6%) | 6 (6.7%) | 60 (66.7%) | 8 (8.9%) | 20 (22.3%) | 17 (18.9%) | 13 (14.4%) | 15 (16.7%) | 19 (21.1%) | |||
| Calculated (●) | 87 (96.7%) | 49 (54.4%) | 47 (52.2%) | 2 (2.2%) | 23 (25.6%) | 1 (1.1%) | 19 (21.1%) | 4 (4.4%) | 60 (66.7%) | 7 (7.8%) | 15 (16.7%) | 15 (16.7%) | 12 (13.3%) | 12 (13.3%) | 16 (17.8%) | ||||
| Quoted (◑) | 1 (1.1%) | 4 (4.4%) | 7 (7.8%) | 0 (0%) | 4 (4.4%) | 1 (1.1%) | 4 (4.4%) | 2 (2.2%) | 0 (0%) | 1 (1.1%) | 5 (5.6%) | 2 (2.2%) | 1 (1.1%) | 3 (3.3%) | 3 (3.3%) | ||||
CALCULATION OF LCCE
The analysis yielded a total of 255 datasets for ECE, 173 for OCE, and 162 for LCCE. As shown in Figure 2 and Table 2, the calculation results vary significantly across different cases, therefore, in the following analysis, the calculation results are described based on quartiles, including the median (med), first quartile (25%), and third quartile (75%). The ECEmed (ECE25%-ECE75%) were 305.7 (178.3-536.7) kgCO2e/m2, accounting for 35.0% of LCCE. The OCEmed (OCE25%-OCE75%) was 792.0 (300.0-1,921.5) kgCO2e/m2, accounting for 66.1% of LCCE, and the LCCEmed (LCCE25%-LCCE75%) was 1,186.2 (546.2-2,104.6) kgCO2e/m2.
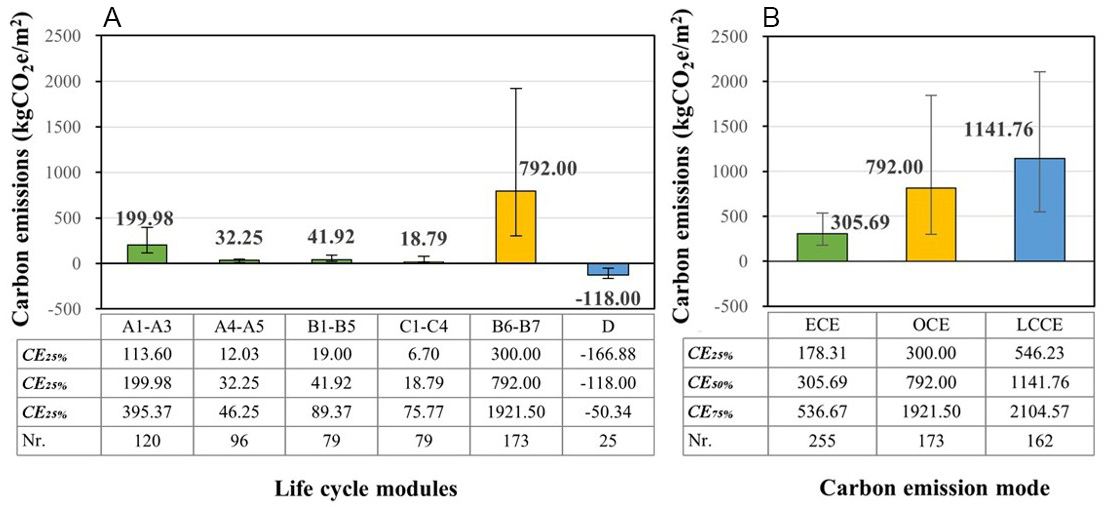
Figure 2. CE values per each life cycle stage within the analyzed case studies. (A) CE calculation results for each life cycle stage in the case studies; (B) ECE, OCE, and LCCE calculation results. Data are presented as median (interquartile range, IQR). The top and bottom of the error bars represent the 75th (Q3) and 25th (Q1) percentiles, respectively. The sample sizes for stages A1-A3, A4-A5, B1-B5, B6-B7, C1-C4, D, ECE, OCE, and LCCE were 120, 96, 79, 173, 79, 25, 255, 173, and 162, respectively.
CE values per life cycle stage within the analyzed case studies
| Items | ECE | OCE | ECE or OCE | ||||
| Stage | A1-A3 | A4-A5 | B1-B5 | C1-C4 | Total | B6-B7 | D |
| Q2 (kgCO2e/m2) | 200.0 | 32.3 | 41.9 | 18.8 | 305.7 | 792.0 | -118.0 |
| Q1-Q3 (kgCO2e/m2) | 113.6-395.4 | 12.0-46.2 | 19.0-89.4 | 6.7-75.8 | 178.3-536.7 | 300.0-1921.5 | -166.9--50.3 |
| Number of datasets | 120 | 96 | 79 | 79 | 255 | 173 | 25 |
For the ECE, 120 sets of results regarding the A1-A3 stages were reported. On the whole, CEA1-A3.med (CEA1-A3.25%-CEA1-A3.75%) was 200.0 (113.6-395.4) kgCO2e/m2; For the remaining A4-A5, B1-B5, and C1-C4 stages, the medians were 32.3, 41.9, and 18.8 kgCO2e/m2, respectively. For the OCE, 173 sets of results regarding the B6-B7 stages were provided, and CEB6-B7.med (CEB6-B7.25%-CEB6-B7.75%) was 792.0 (300.0-1,921.5) kgCO2e/m2. The D module was represented by only 25 sets of calculation results, and the CED.med (CED.25%-CED.75%) was -118.0 (-166.9 to -50.3) kgCO2e/m2.
Out of the 309 cases, 158 provided calculation results for both ECE and OCE. Among the 158 cases, 63 were explicitly identified as complying with building certification standards, including passive house (PH), nearly Zero Energy Building (nZEB), Active House, and Low-energy House (hereinafter referred to as the certified group, CF). The remaining 95 cases lacked such specifications and were designated as the non-certified group (NC). The Pmed value for ECE was 53.9%, while that for OCE was 47.8% in group CF, and 23.6% and 76.2%, respectively, in the NC group. The results clearly show that the proportion of ECE significantly increased in group CF [Figure 3].
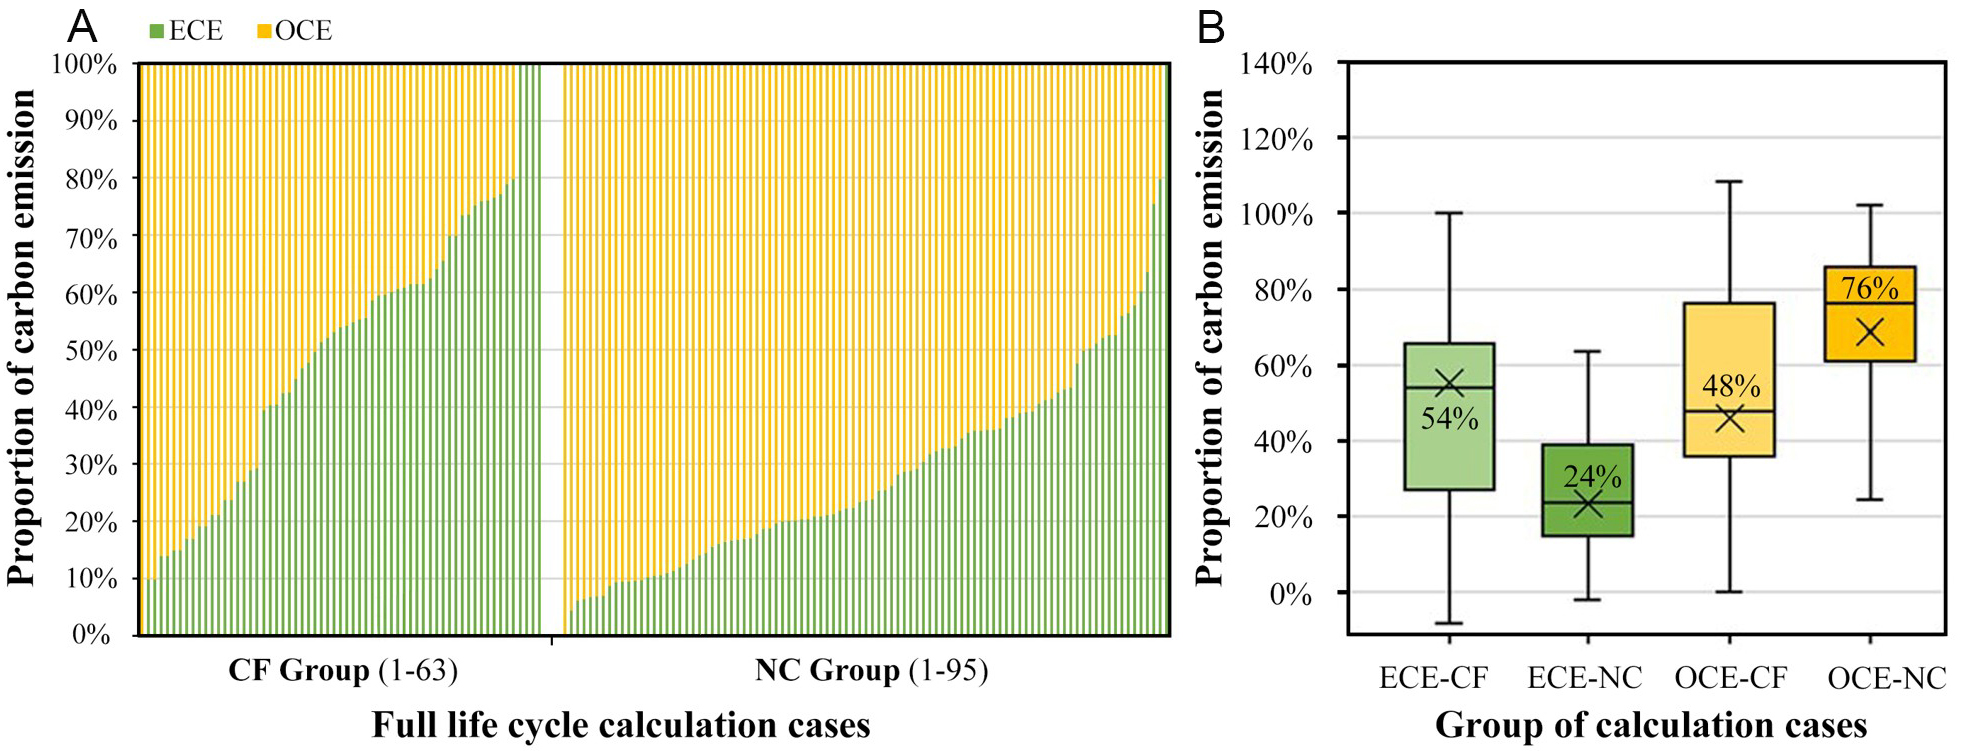
Figure 3. Proportion of CEs in the reviewed case studies. (A) Proportion of ECE and OCE in CF and NC groups; (B) Quartile plot. The box range represents the interquartile range(Q1-Q3), the horizontal line inside the box indicates the median, and the cross symbol (×) denotes the mean value. The sample sizes for the CE and the NCF group were 63 and 95, respectively.
The proportion was influenced by several factors. For example, the contributing share of OCE was correspondingly low for cases where the carbon emission factor (CEF) of power was low. A study of a wooden single-family house in Sweden showed that the operating energy and water consumption only accounted for 21% and 6%, respectively, of the LCCE over a 100-year calculation period as Sweden’s electricity was mainly composed of renewable energy[70]. The CEF was only
Calculation of ECE
ECE values are closely related to the buildings’ structural type[105]. The reviewed studies provided a total of 255 ECE data sets. Among them, there were 66 of masonry, 83 of timber, 18 of steel, 63 cases of concrete structures, and 26 of composite structures. The median statistical results of the ECE are shown in Figure 4. The median ECE for concrete, masonry, timber, steel, and composite structures were 362.50, 359.92, 172.21, 244.86, and 843.00 kgCO2e/m2, respectively, with timber structures having the lowest value. In addition, three bio-based structural buildings from Europe had a median ECE of 178.31 kgCO2e/m2, which was similar to that of wood structures [Figure 4]. It is important to note the varying sample sizes across different structural typologies. While masonry (n = 66) and timber (n = 83) datasets provide a statistically robust basis for analysis, the results for composite structures (n = 26), steel (n = 18), and particularly bio-based materials
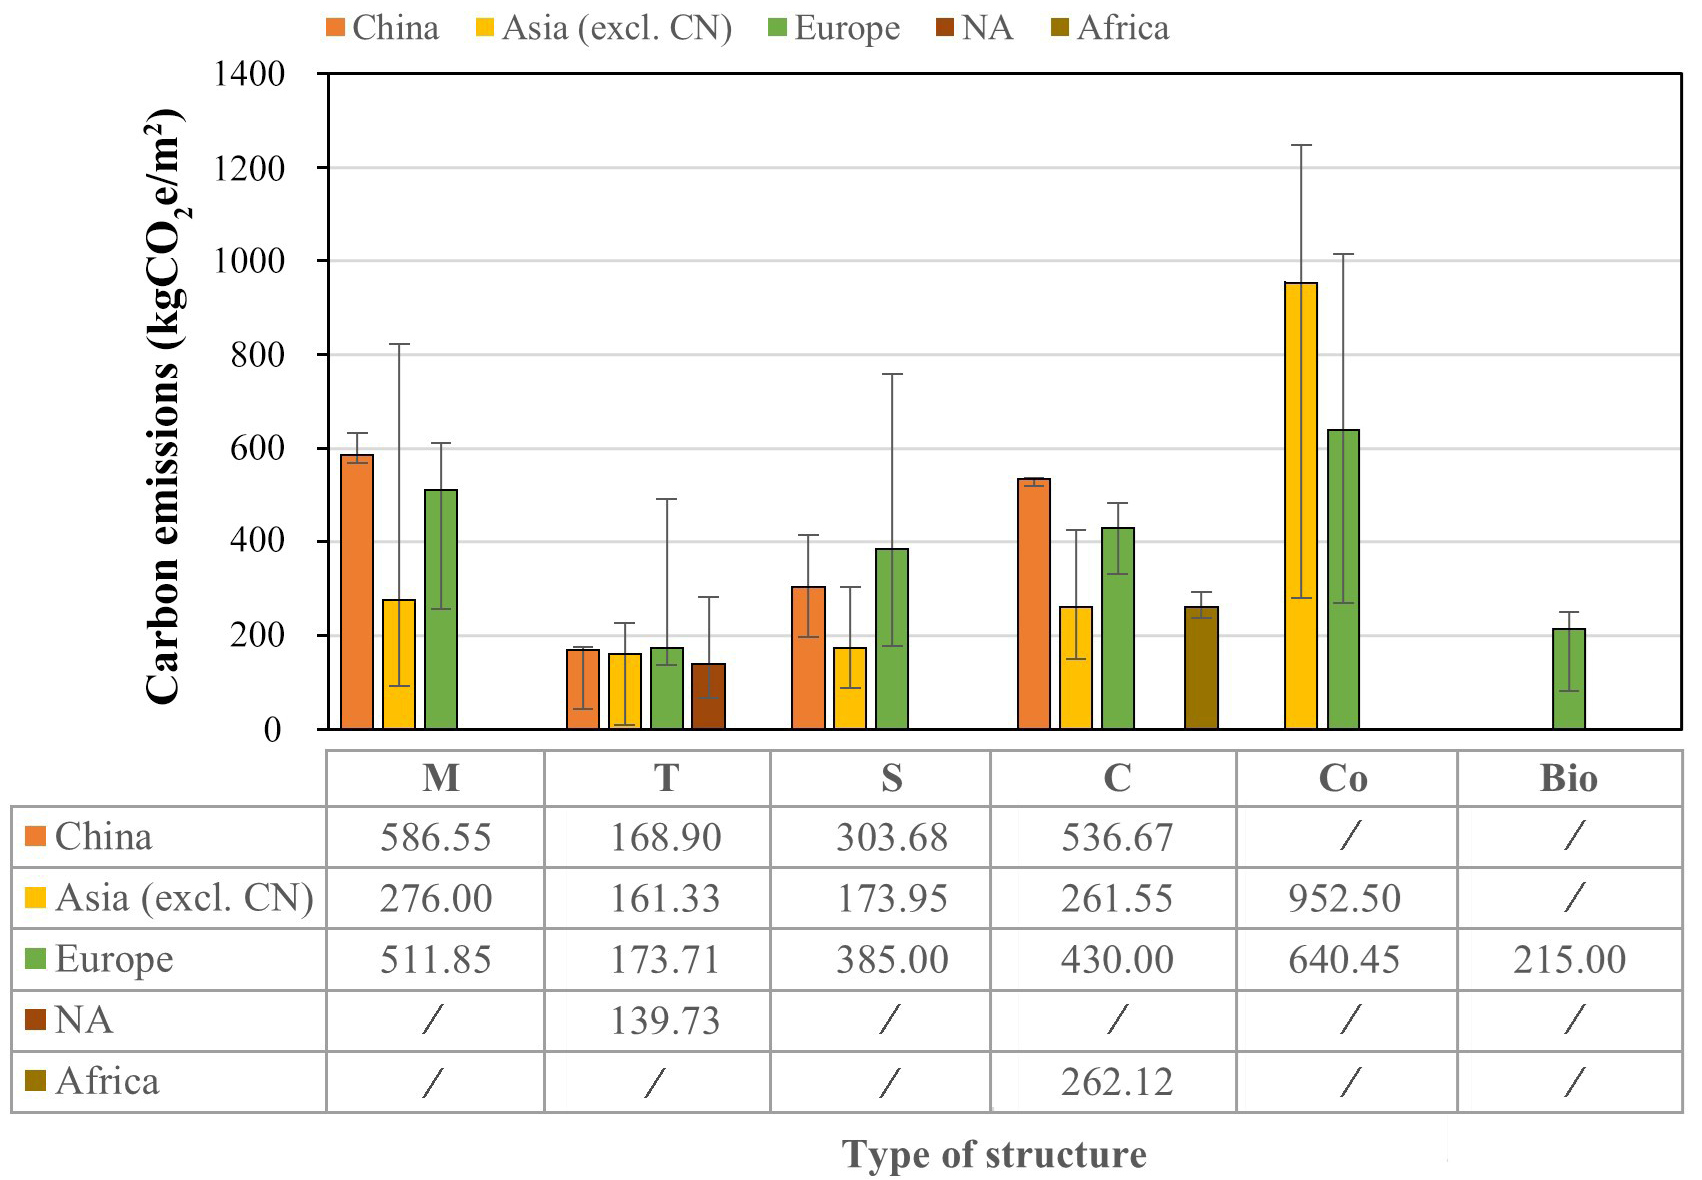
Figure 4. ECE calculation results by types of structure and countries/regions. M, T, S, C, Co, Bio respectively refer to masonry structure, timber structure, steel structure, concrete structure, composite structure, and bio-material building. Data are presented as median (interquartile range, IQR). The top and bottom of the error bars represent the 75th (Q3) and 25th (Q1) percentiles, respectively. The sample sizes for M, T, S, C, Co, and Bo were 66, 83, 18, 63, 26, and 3, respectively.
Due to inconsistencies in basic parameters such as CEFs of energy and building materials, and architectural design codes among different countries and regions, there are also certain variations in building ECE between them. Overall, the median ECE values for the China group and the Europe were 377.42 and
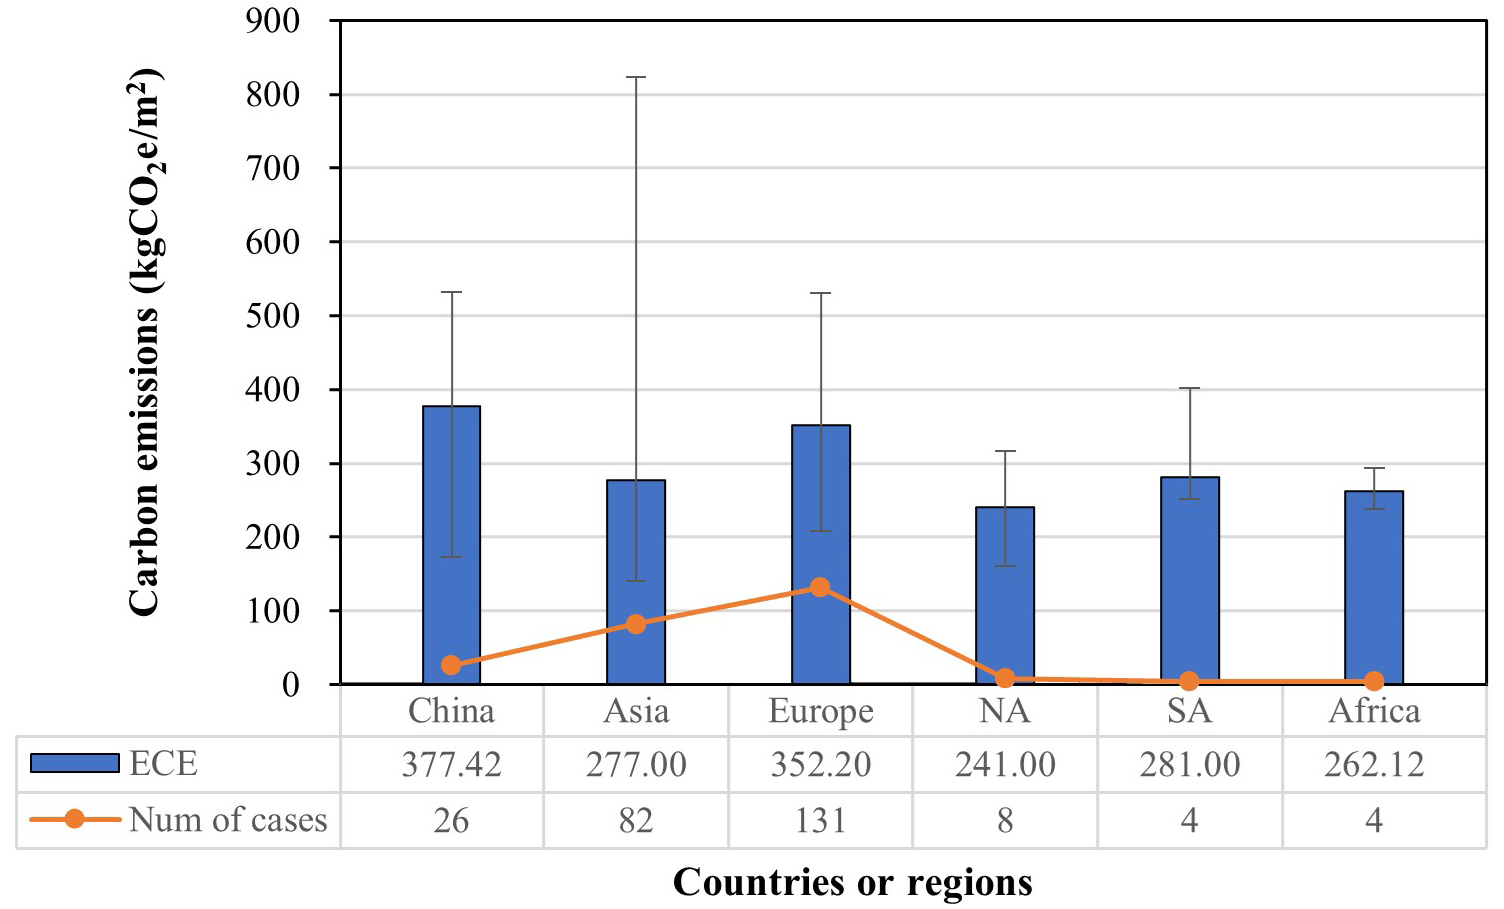
Figure 5. ECE calculation results by countries/regions. Data are presented as median (interquartile range, IQR). The top and bottom of the error bars represent the 75th (Q3) and 25th (Q1) percentiles, respectively. The sample sizes for China, Asia, Europe, NA, SA, and Africa were 26, 82, 131, 8, 4, and 4, respectively.
Building material production stage (A1-A3)
The CEs emitted in stages A1-A3 (CEA1-A3) were obtained from raw material extraction (A1), transportation (A2), and the manufacturing of building materials or components (A3). Among 90 studies, 88 calculated CEA1-A3, and most of which regarded A1-A3 as one. Only 10 (11.4%) of the 88 studies distinguished the three modules, while the rest calculated CEA1-A3 as a whole by multiplying the initial consumption of building materials or components with the corresponding CEFs.
The reviewed studies provided 120 sets of CE data from stages A1-A3, with a median value of
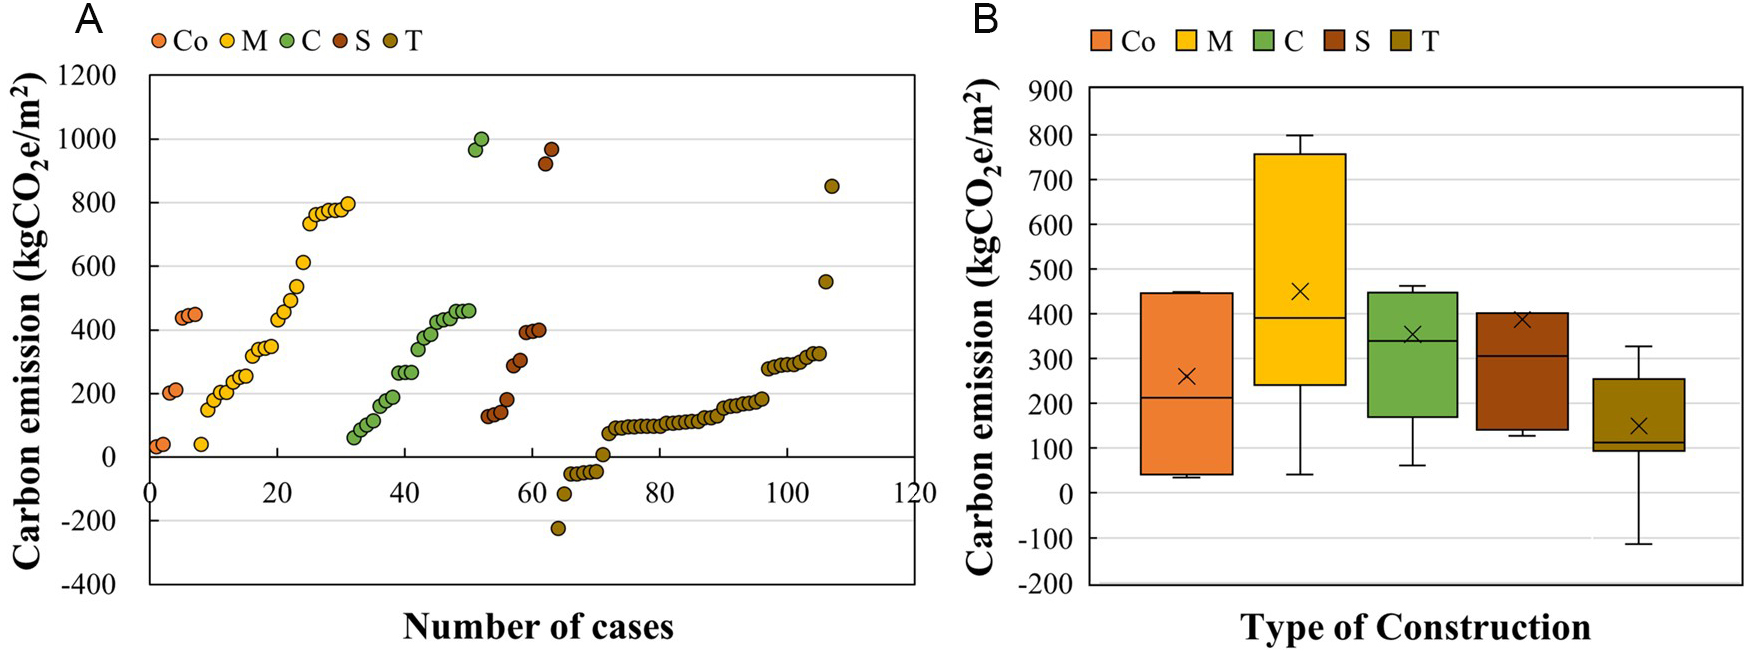
Figure 6. CEs calculation results of stages A1-A3 in the case studies. (A) Distribution of all results; (B) Quartile plot. The box range represents the interquartile range(Q1-Q3), the horizontal line inside the box indicates the median, and the cross symbol (×) denotes the mean value. 13 cases did not provide structural information. The sample sizes for Co, M, C, S, and T were 7, 24, 21, 11, and 44, respectively.
It is generally believed that the calculation of CEA1-A3 should include the main building materials and equipment. However, only 37 (12.0%) of the 309 cases considered both items, 252 (81.6%) considered only the consumption of the main building materials, and the remaining 20 cases did not specify the scope of calculation. Overlooking the CEs from equipment may lead to an underestimation of the CEA1-A3.
Construction stage (A4-A5)
The CEs emitted in stages A4-A5 (CEA4-A5) mainly include energy and material consumption during on-site construction activities and the transportation of building materials. Transport CEs (CEA4) are conventionally determined through the multiplication of three key factors: the weight of construction materials, the transport distance, and the CEF specific to the transportation mode employed. Transport distance is the decisive factor for CEA4. When the actual transport distance is unavailable, a hypothetical distance—such as 50 or 300 km[27]—is typically assumed. On-site construction CE (CEA5) is highly complex and includes direct and indirect CEs from fuel combustion for mechanical power, electricity consumption, assembly and miscellaneous work, transportation of construction equipment, and personnel activities associated with construction. Since the CE sources of CEA5 are complex and the calculation process is relatively difficult, some studies refer to data from other studies for the calculation[47].
The reviewed case studies provided 96 sets of CE data from stages A4-A5 [Figure 7], with a median value of 32.3 kgCO2e/m2, accounting for 3.1% of the LCCE. The median CEA4-A5 values for masonry, concrete, steel, timber, and composite structures are 45.0, 44.4, 13.2, 12.9, and 7.8 kgCO2e/m2, respectively. Among these, composite structures have the lowest CEA4-A5. With only four data points on composite buildings, the statistics might be somewhat limited (The stages B1-B5 and C1-C4 also exhibit similar issues).
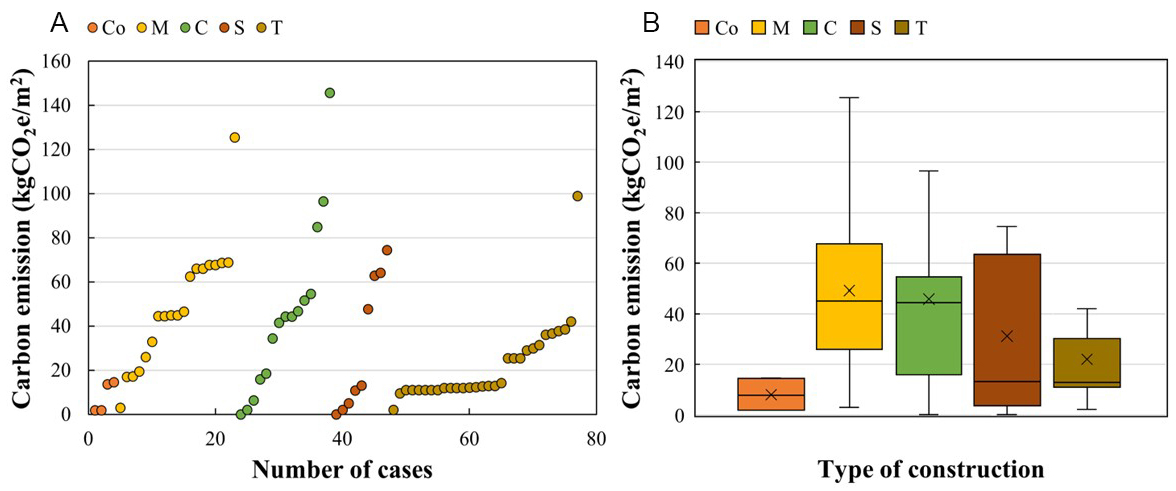
Figure 7. CEs calculation results of stage A4-A5 in the case studies. (A) Distribution of all results; (B) Quartile plot. The box range represents the interquartile range(Q1-Q3), the horizontal line inside the box indicates the median, and the cross symbol (×) denotes the mean value. 19 cases did not provide structural information. The sample sizes for Co, M, C, S, and T were 4, 19, 15, 9, and 30, respectively.
Use stage (B1-B5)
CEs emitted in stages B1-B5 (CEB1-B5) include those from use, maintenance, repair, refurbishment, and replacement (B1-B5, respectively), and the production, transport, and disposal of the involved building materials. This part of CEs was known as the “recurring ECEs”. In contrast, the CEs from the raw material extraction to the end of construction (A1-A5) were referred to as “initial ECEs”. The main method of calculating CEB1-B5 determines the number of material replacements over the calculation period based on the expected service life of each building material[58,83], then calculates the corresponding recurring ECE.
The reviewed case studies provided 79 sets of CE data from stages B1-B5 [Figure 8], with a median value of 41.9 kgCO2e/m2, accounting for 8.0% of the LCCE. The median CEB1-B5 values for masonry, concrete, steel, timber, and composite structures are 35.7, 20.5, 69.4, 51.2, and 31.6 kgCO2e/m2, respectively. Among these, concrete structures have the lowest CEB1-B5.
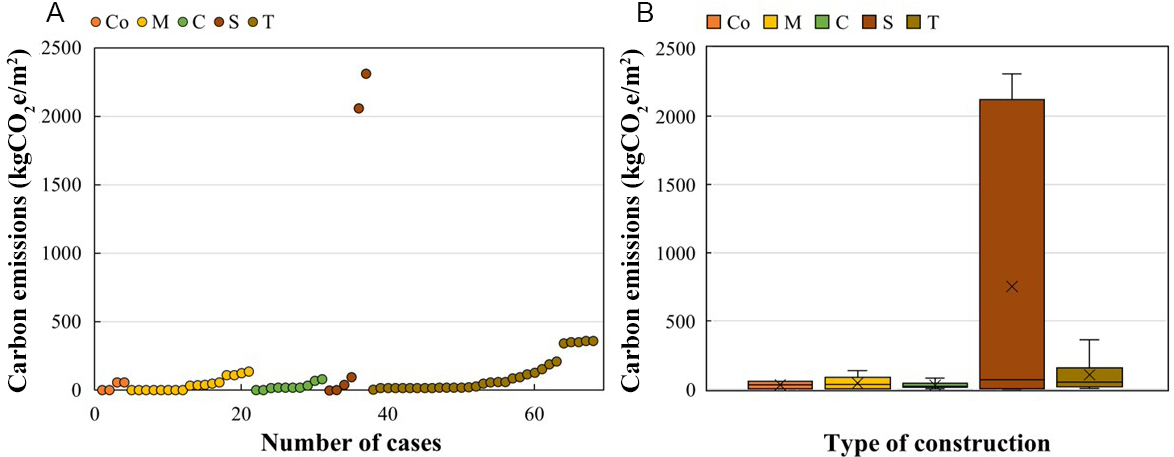
Figure 8. CEs calculation results of stage B1-B5 in the case studies. (A) Distribution of all results; (B) Quartile plot. The box range represents the interquartile range(Q1-Q3), the horizontal line inside the box indicates the median, and the cross symbol (×) denotes the mean value. 11 cases did not provide structural information. The sample sizes for Co, M, C, S, and T were 4, 17, 10, 6, and 31, respectively.
Due to differences in calculation methods, the scope of considered CE sources, and building service life, significant order-of-magnitude variations exist in CEB1-B5 values across studies. Huang et al.[26]’s calculations showed CEB1-B5 at 36.8 kgCO2e/m2. Parece et al.[59] report 71.43 kgCO2e/m2 for a two-story residential building. However, Davis et al.[65] obtained two significantly higher estimates, 2,059.75 and 2,311.71 kgCO2e/m2, for a single-story dwelling using two different calculation approaches, approximately double the CEs of the stages A1-A5. These notably higher results primarily stem from their comprehensive inclusion of all building components (rather than just non-structural elements like exterior finishes).
End-of-life stage (C1-C4)
CEs emitted in stages C1-C4 (CEC1-C4) were calculated for building demolition (C1), waste transportation (C2), processing (C3), and disposal (C4). The calculations for C1 and C2 were similar to those for A5 and A4. The calculations for C3 and C4 were determined using waste treatment methods, which may greatly vary in different scenarios. In fact, this section is based on certain assumptions owing to the lack of corresponding calculation methods and basic parameters.
The reviewed case studies provided 79 sets of CE data from stages C1-C4 [Figure 9], with a median value of 18.8 kgCO2e/m2, accounting for 2.9% of the LCCE. The median CEC1-C4 values for masonry, concrete, steel, timber, and composite structures are 40.9, 35.6, 2.6, 24.0, and 12.8 kgCO2e/m2, respectively. Among these, steel structures have the lowest CEC1-C4.
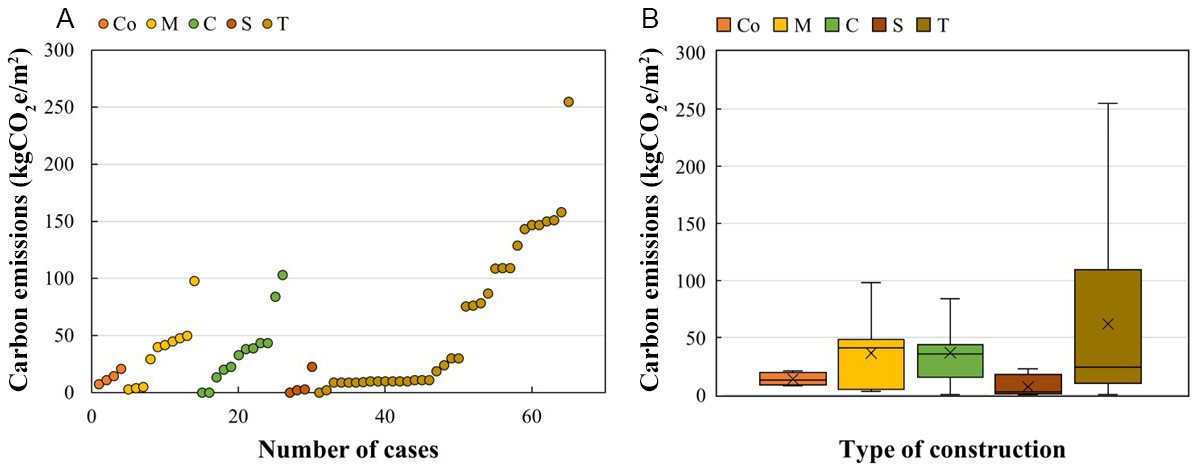
Figure 9. CEs calculation results of stage C1-C4 in the case studies. (A) Distribution of all results; (B) Quartile plot. The box range represents the interquartile range(Q1-Q3), the horizontal line inside the box indicates the median, and the cross symbol (×) denotes the mean value. 14 cases did not provide structural information. The sample sizes for Co, M, C, S, and T were 4, 10, 12, 4, and 35, respectively.
Significant differences exist in the calculated CEC1-C4 across various studies. Ajay et al.[42] investigated four vernacular buildings in Nepal, finding that CEC1-C4 ranged between 3.0-4.0 kgCO2e/m², accounting for only 0.6%-0.9% of the LCCE. Norouzi et al.[77] calculated the ECE of a two-story residential building in the UK, reporting a CEC1-C4 value of 31.32 kgCO2e/m2. Song et al.[27] assessed the LCCE of a traditional single-story courtyard house in Beijing, where CEC1-C4 was 97.99 kgCO2e/m2, representing 2.4% of the LCCE.
Calculation of OCE
Building OCE includes operational energy and water consumption. However, most studies only considered energy consumption, and only Huang et al.[26], Davis et al.[65], Cai et al.[22], Passer et al.[44], Petrovic et al.[67], Norouzi et al.[77], Cuéllar-Franca et al.[82], and Quintana-Gallardo et al.[93] explicitly calculated water consumption. The CEs from stage B7 account for a relatively small proportion. For example: Petrovic et al.[67] indicated that Stage B7 accounts for 6% of the OCE over a 100-year building life cycle. Meanwhile, calculations by Cai et al.[22] showed that stage B7 CEs constitute only 0.3% of the building's total LCCE. As shown in Supplementary Table 1, the methods and scopes used for calculating energy consumption in stages B6-B7 varied across different studies.
The reviewed case studies provided 178 sets of CE data from stages B6-B7 [Figure 10], with a median value of 14.8 kgCO2e/m2/yr, accounting for 66.1% of the LCCE. The median OCE values for masonry, concrete, steel, timber, and composite structures are 20.6, 19.2, 24.6, 4.4, and 10.7 kgCO2e/m2/yr, respectively. Among these, timber structures have the lowest CEB6-B7. OCE is closely related to the climate zone in which the building is located[105]. According to the Köppen climate classification method, the world’s climates can be divided into five major zones: A, B, C, D, and E. A total of 140 sets of data were collected, including 9 from the B climate zone, 96 from the C climate zone, and 37 from the D climate zone (data for the A and E climate zones are lacking). Statistically, the median OCE value for the B climate zone is 1,208.5 kgCO2e/m2, for the C climate zone it is 902.6 kgCO2e/m2, and for the D climate zone is the lowest, at only 254.5 kgCO2e/m2. Additionally, there are certain differences in OCE among different countries or regions. A comparison was performed of the OCE in China, Asia (excluding China), and Europe. The median OCE value in the China group was the highest, at 910.0 kgCO2e/m2, followed by the Asia group with a median of 881.3 kgCO2e/m2, while the Europe group had the lowest median, at 792 kgCO2e/m2.
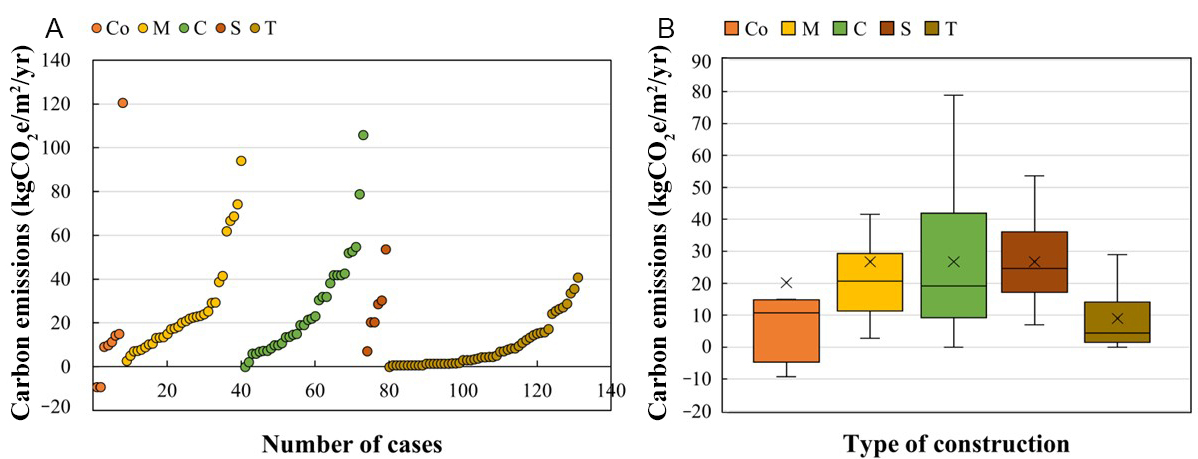
Figure 10. CEs calculation results of stage B6-B7 in the case studies. (A) Distribution of all results; (B) Quartile plot. The box range represents the interquartile range(Q1-Q3), the horizontal line inside the box indicates the median, and the cross symbol (×) denotes the mean value. 42 cases did not provide structural information. The sample sizes for Co, M, C, S, and T were 8, 32, 33, 6, and 52, respectively.
Electricity is the main component of the energy consumed during building operations. The electricity CEF changes over time, unlike primary energies. However, most studies tend to overlook the trend of the electricity CEF. The electricity CEF continues to annually reduce in many countries; therefore, the calculation method of annual power consumption × calculation period (such as 50 years) could overestimate the CE due to electricity consumption. Another problem arising from this oversight was that the CE offset was overestimated by the use of renewable energy (such as photovoltaics) in some cases. Replacing grid power with renewable energy decreased the CE offset, as the grid power CEF decreased.
Calculation of supplementary effects (Module D)
The carbon benefit of module D is generated from the recycling and reuse of building materials, components, and energy. Among the 90 studies reviewed, a total of 19 (21.1%) considered this module, of which 16 studies conducted calculations, while the remaining 3 studies used empirical data. Due to the lack of measured data, the recycling or reusing rates of materials or components are usually assumed. For example, Moghayedi et al.[95] assumed that 20% of bricks are recycled after the building’s service life ends. In another study[96], researchers assumed a recycling rate of 30% for wood and tiles, and 50% for steel reinforcement in conventional buildings; whereas for prefabricated buildings, the recycling rate of floor slabs was assumed to be 80%.
The 90 reviewed studies collectively provided 25 data sets for module D [Figure 11]. Overall, the median carbon benefit of module D was -118.0 kgCO2e/m2, accounting for -31.5% of the total ECE and -8.7% of the LCCE. The median CED values for masonry, concrete, steel, and timber structures are -109.3, -73.3, -175.3, and -148.1 kgCO2e/m2, respectively. Among these, steel structures have the lowest CED. However, it should be noted that, due to the limited amount of available data, the statistical results regarding the carbon benefits of module D for buildings with different structures may have certain limitations.
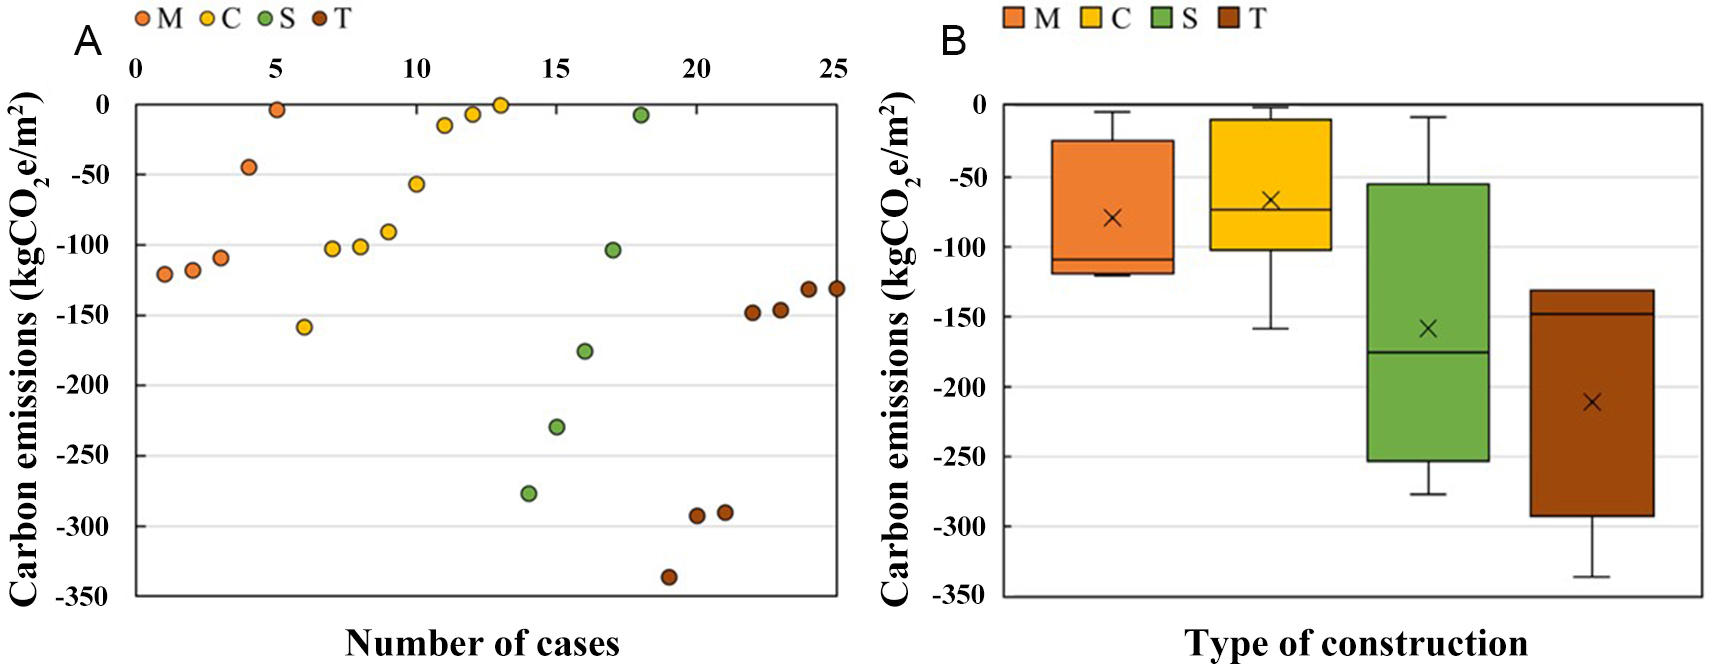
Figure 11. CEs calculation results of module D in the case studies. (A) Distribution of all results; (B) Quartile plot. The box range represents the interquartile range(Q1-Q3), the horizontal line inside the box indicates the median, and the cross symbol (×) denotes the mean value. The sample sizes for M, C, S, and T were 5, 8, 5, and 7, respectively.
Discussion on the LCCE calculation
Most of the pre-use stages were calculated through the design and construction plan in these case studies, or data recorded in the actual construction process, which tended to be in line with the actual conditions. However, many previous cases cited data or empirical formulas in the calculation of the in-use and post-use stages owing to the lack of independent research. Therefore, the calculation processes were full of assumptions and lacked credibility. Blengini et al.[54,55] believed that CEs depend on a complex combination of local building technology, site-specific climatic conditions, local regulations, energy mix, and human behavior patterns in different cases; a single improvement based on oversimplification, generalization, and reliance on friendly tools might be ineffective or even deviate from expectations from a lifecycle perspective. A LCA of rural dwellings in Portugal showed that the use of different assessment tools produces inconsistent comparative results on the same issue, ultimately influencing decision-making[60]. The resulting CEs for building maintenance varied in the range of 2%-6% of the LCCE in a case study in Spain when different parameters (provided by GaBi and Ecoinvent) were used for calculation[101].
Inconsistent method for assigning values
Gustavsson et al.[68] calculated CEs from on-site construction based on a review of previous studies, assuming that the energy consumption during the construction stage was 80 kWh/m2 and the energy demand for building demolition was 10 kWh/m2. Meanwhile, Asdrubali et al.[53]’s calculation assumed that the on-site construction CE was equal to 2% of the energy embodied in the building material, and the transport distance was assumed to be 50 km. Cuéllar-Franca et al.[82] converted construction energy consumption through the weight of building materials and mechanical parameters provided by previous studies. Proietti et al.[57] calculated the amount of building material replacement according to the replacement factors quoted from previous studies. Cuéllar-Franca et al.[82] determined the material replacement in the use stage according to the service life of the building and the material; for example, the service life of windows, doors, and laminate flooring was 25, 20, and 20 years, respectively; therefore, they were considered to be replaced 1, 2, and 2 times over 50 years, respectively. The mechanical energy consumption of demolition activities was determined as the average value based on existing studies in the demolition stage. Asdrubali et al.[53] assumed that glass, aluminum, steel, and copper were 100% recycled, and steel and limestone powder were recycled from the reinforced concrete (RC) at the end-of-life treatment. Cuéllar-Franca et al.[82] considered that the construction waste, concrete, binders, aggregates, and gypsum were 100% recycled, timber was 2% reused (including 79% recycled and 19% landfilled), while brick was 51% reused (including 36% recycled, and 13% landfilled).
Similar problems were reported in other studies, resulting in very different calculation results. For example, the CEF of straw was given a negative value of -1.2 kgCO2e/kg owing to the carbon storage of the plant[46]. In contrast, wood-framed houses were considered that the carbon stored by wood is eventually released; therefore, the impact of carbon storage on CEF was not considered[18]. The carbon sink in the upstream forest system, separation of wood materials from demolition waste for landfills, and use of wood fuel as a substitute for coal and natural gas in electricity production were all considered in two timber-framed houses in Canada[97]. Another study on timber houses considered the biomass energy utilization of wood residues to substitute fossil fuels; this resulted in negative CEs of building material production[69,70].
Uncertain CEF
The following analysis presents the CEFs of the steel, cement, and concrete used in the case studies to demonstrate the uncertainty in these basic parameters. This demonstrates the infeasibility of quoting data from other databases and the need to develop basic parameters for local building materials.
• Steel. The reviewed case studies provided 32 sets of steel CEF parameters, including 12, 9, and 11 sets for China, Asia excluding China (excl.CN), and Europe, respectively. They were between
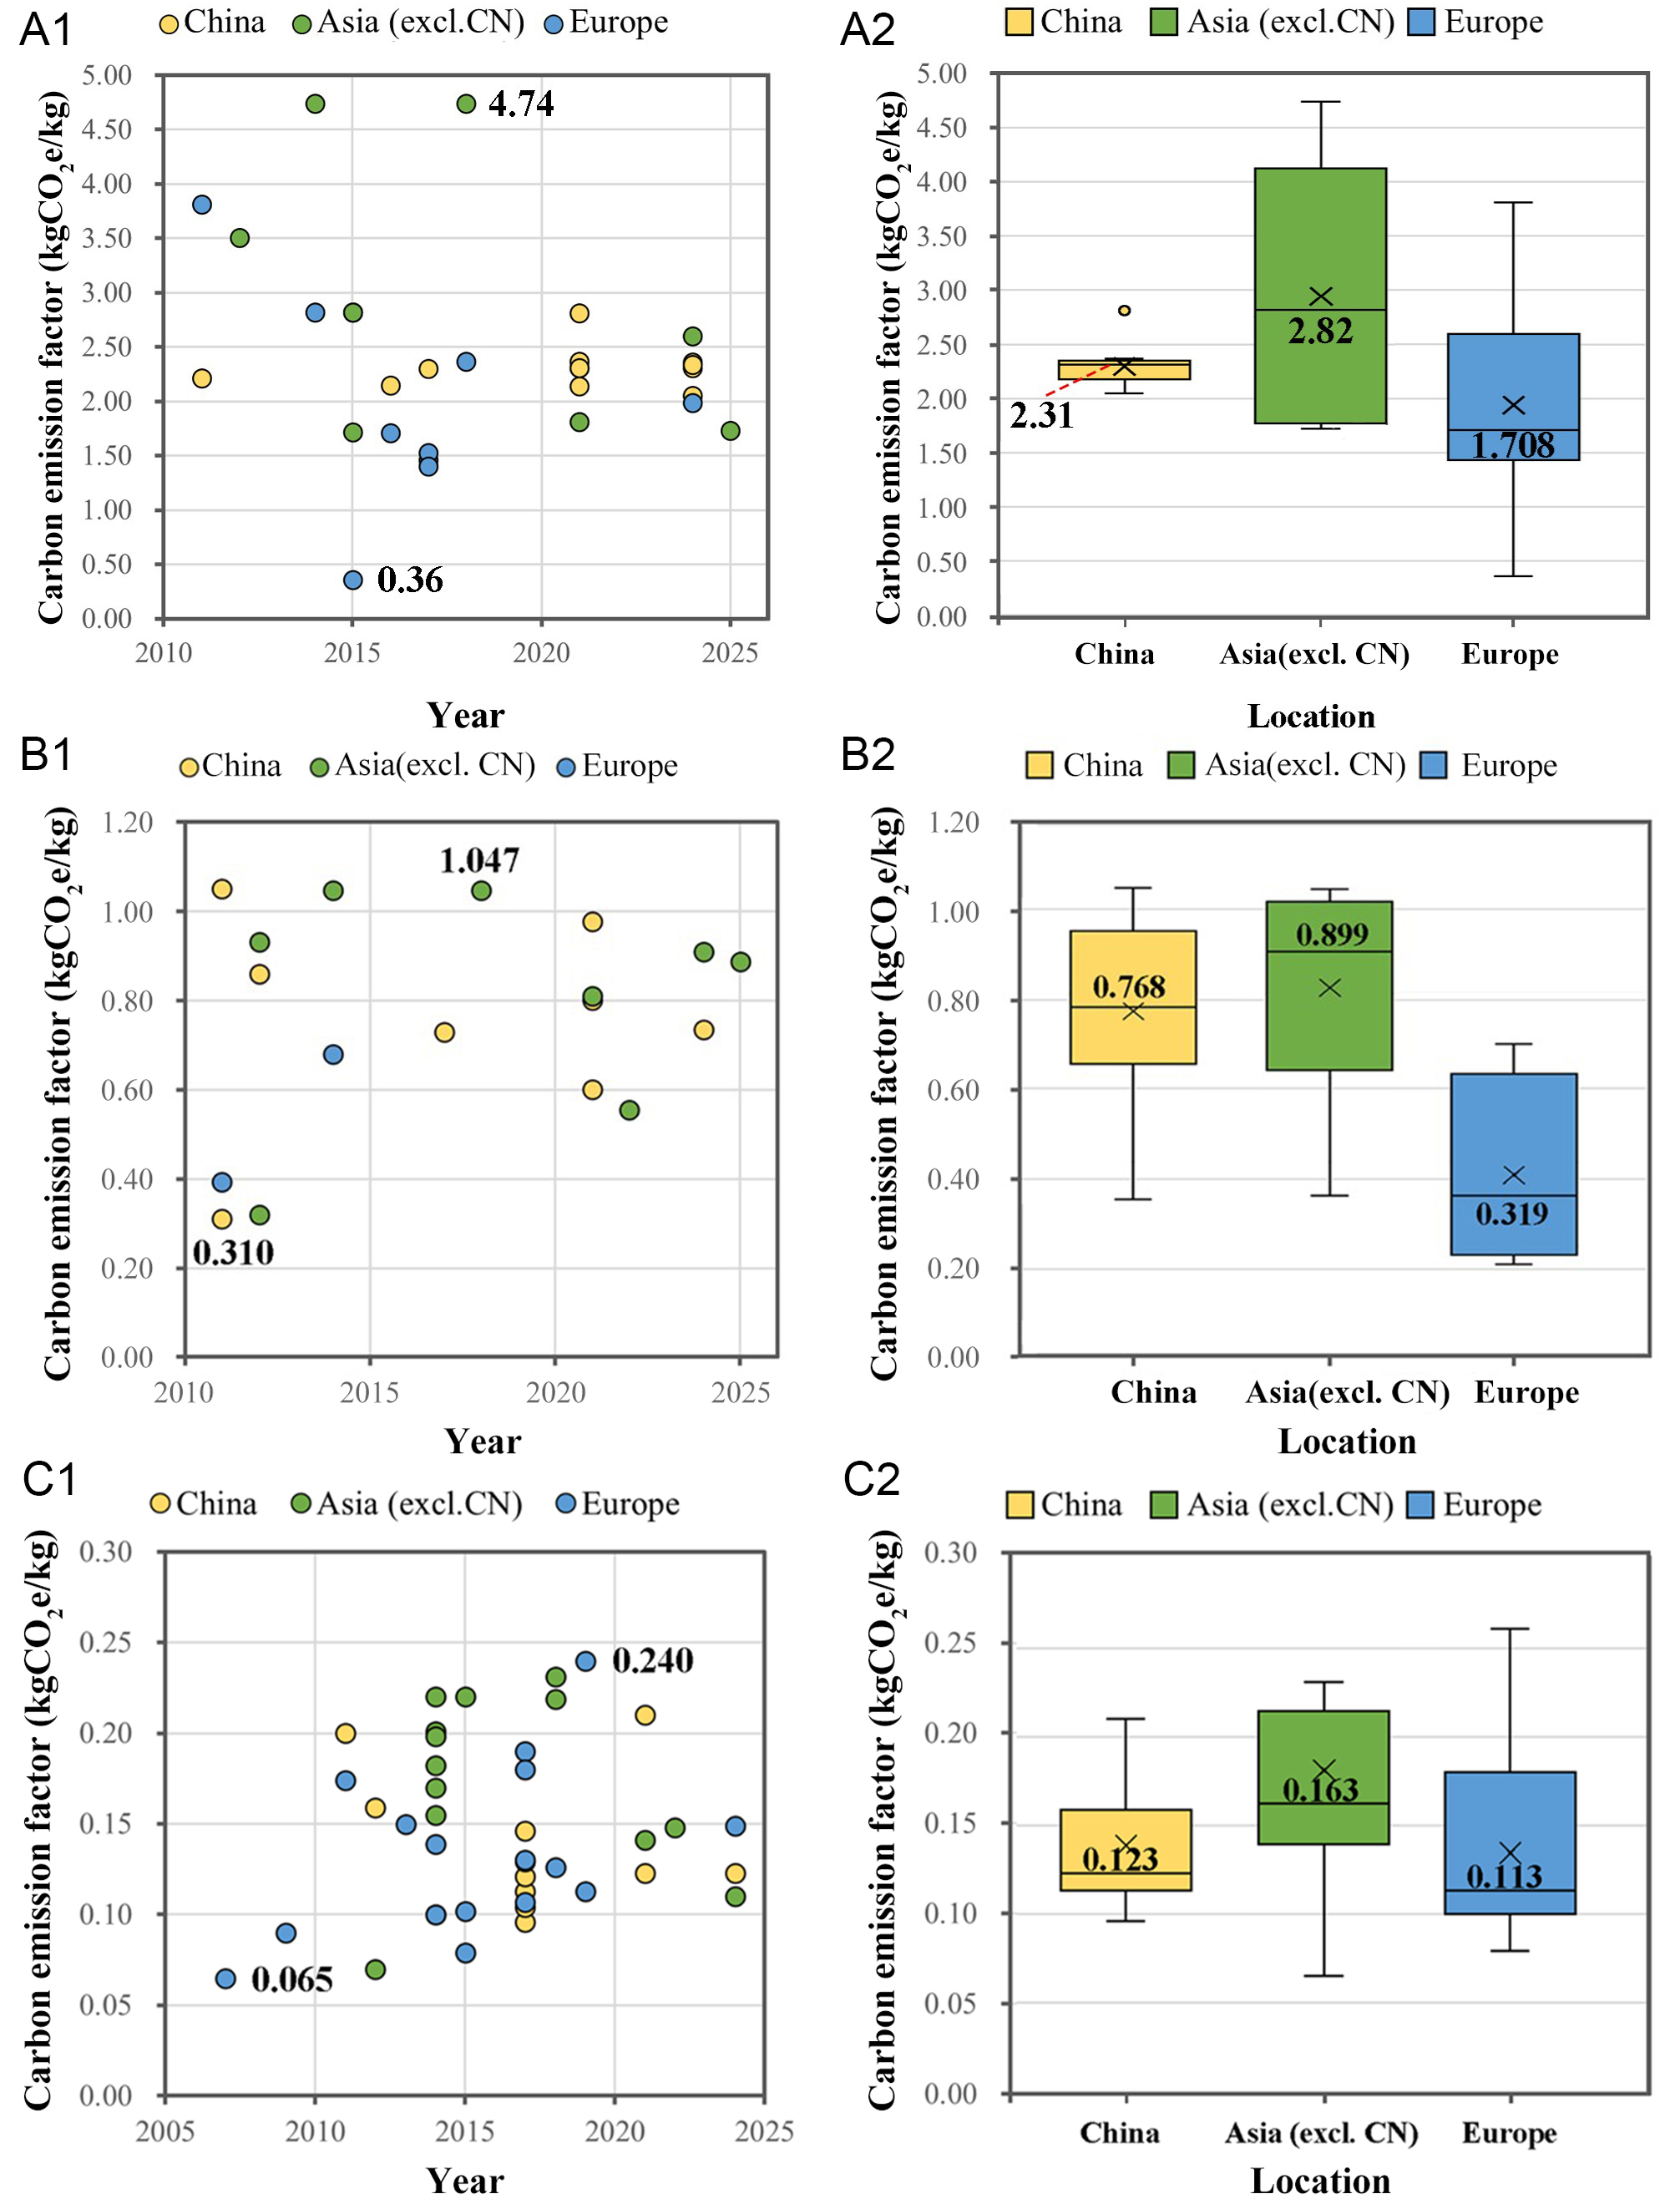
Figure 12. CEF of steel, cement, and concrete used in the reviewed case studies. The box range represents the interquartile range(Q1-Q3), the horizontal line inside the box indicates the median, and the cross symbol (×) denotes the mean value. The sample sizes for (A), (B), and (C) were 32, 18, and 42, respectively. (A1) Distribution of all results, (A2) Quartile plot; (B1) Distribution of all results, (B2) Quartile plot; (C1) Distribution of all results, (C2) Quartile plot.
• Cement. Eighteen sets of cement CEF parameters were provided in the reviewed case studies, including seven, nine, and two sets in China, Asia (excl.CN), and Europe, respectively. The values ranged between 0.310[38]-1.047[20] kgCO2e/kg, and the lowest and highest values were from Asia and China, respectively, with a difference of 3.3 times [Figure 12B1 and B2].
• Concrete. Forty-two sets of concrete CEF parameters were provided in the reviewed case studies, including 11, 14, and 17 groups from China, Asia (excl.CN), and Europe, respectively. The values were between 0.070[31]-0.240[73] kgCO2e/kg (convert the units using a density of 2,400 kg/m3), and the lowest and highest values were from Asia (excl.CN) and Europe, respectively, with a difference of 3.4 times. The CE in the concrete life cycle is approximately linearly proportional to its compressive strength, and the CE at 35 MPa is 48% higher than that at 21 MPa[108]. However, almost no concrete compressive strength was clearly stated in the reviewed literature [Figure 12C1 and C2].
This significant variability in material (steel, cement and concrete) CEFs introduces considerable uncertainty into LCA results. It suggests that differences in ECE between case studies may reflect the regional industrial background (e.g., reliance on scrap or coal) rather than the actual environmental performance of the building design.
Forty-one sets of electricity CEF parameters were provided in the reviewed case studies. The values were between 0.031[92] and 1.111[20] kgCO2e/kWh. The lowest and highest values were from Europe and China, respectively, with an extreme difference of 36.4 times. Electricity CEF dynamically changes and is related to the energy structure used in power generation, which is affected by time and region. Only two sets were from Asia (excl.CN). Here, only China, Asia, and Europe were compared. The median values of the 11 sets of CEF parameters in China and the 24 sets in Europe were 0.859 and 0.337 kgCO2e/kWh, respectively. The use of different CEFs can lead to significantly different calculation results and decision-making in different countries and regions [Figure 13].
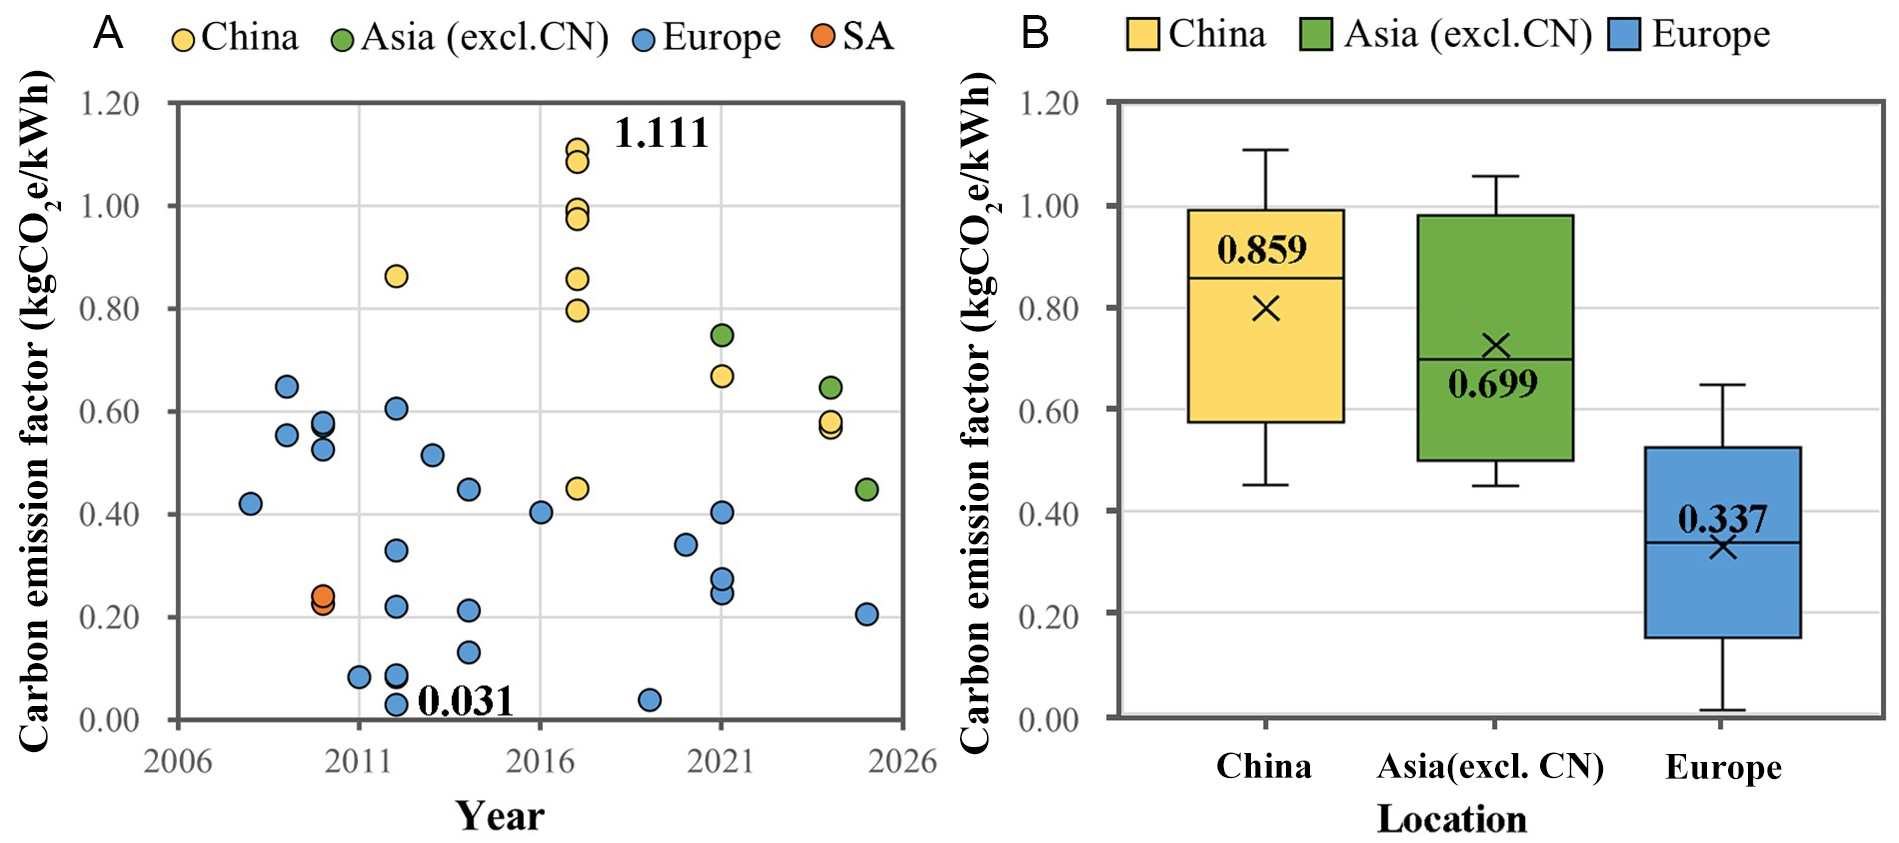
Figure 13. Carbon emission factors of electricity used in the reviewed case studies. (A) Distribution of all results; (B) Quartile plot. The box range represents the interquartile range(Q1-Q3), the horizontal line inside the box indicates the median, and the cross symbol (×) denotes the mean value. The sample size was 41.
According to the calculation methodology, CE results (CE = CEF × Material/Energy Consumption) are highly dependent on the CEF as a key parameter. When different studies adopt vastly different CEF for the same building material (e.g., some use regional averages while others rely on global default values; or differences arise from production processes, such as steel produced via the Blast Oxygen Furnace versus the Electric Arc Furnace), such bias at the input stage inevitably leads to in-comparability in the output results.
Therefore, comparability is predicated on a common frame of reference. Different studies often operate within distinct 'evaluation dimensions' due to variations in database sources, geographical boundaries, or technological conditions. This heterogeneity in data sources results in the absence of a unified baseline, thereby severely undermining the reliability of cross-study comparisons of absolute values.
Calculation of CE offset from material reuse/recycling and energy recovery (D module)
The CE offset calculation from material reusing/recycling and energy recovery (hereafter referred to as 3R materials and energy) in module D showed the following problems among the reviewed studies:
• Overlooked the D stage. As mentioned in Section "Calculation of supplementary effects (Module D)", only 21.1% of the reviewed studies calculated module D. The statistical results in Section "Calculation of supplementary effects (Module D)" showed that the 3R materials and energy from the D module had a significant impact, especially for materials where the CEFs were significantly affected by the recycling rate of raw materials (such as steel).
• Repeated carbon offset calculation. Some studies adopted small CEFs to calculate CEA1-A3 on the grounds that recycled raw materials were used to produce the building materials. In contrast, the CE offset by material recycling in the post-use stage was counted in the D module. Consequently, the CE offset was counted twice in the building system, and the building ECE was underestimated.
• Lack of basic parameters. Owing to the lack of research on the post-use stage, even in the case of calculating the D module, settings, such as the types of materials for recycling or reuse, material recycling or reuse rate, and recycling or reuse methods, were all based on assumptions. Consequently, the calculation results were extremely uncertain, rendering the calculation of this module unreliable, and a referenceable benchmark value could not be achieved.
• No consideration for the time factor. The CE offset by the D module depends on the difference in CE between the 3R materials and energy and the non-3R materials and energy. Unlike ordinary commodities, buildings have a much longer lifespan; therefore, the effect of the time factor must be considered. The CEs of 3R materials and energy and non-3R materials and energy might vary to a large degree after the expected service life of the building (~50 years); However, none of the reviewed studies responded to this question.
The carbon offset benefits associated with Module D essentially occur during the transitional phase between the end-of-life of a preceding building and the beginning of a subsequent building's life cycle. Regarding the allocation of these carbon offsets at the end-of-life stage, there are currently three prevailing allocation paradigms: the World Resources Institute (WRI) 100-0 method (allocating all carbon offsets to the preceding life cycle), and the WRI 0-100 method (allocating all carbon offsets to the subsequent life cycle)[109].
To avoid the risk of double counting and to account for the uncertainties surrounding building material emission factors over long-term horizons, this study recommends adopting the WRI 0-100 allocation approach. Specifically, this entails attributing the full carbon offset benefit to the subsequent building's life cycle. In practical accounting terms, this means that when calculating the LCCE of a new building, it is necessary to identify and quantify the amount of recycled materials used, and subsequently calculate the resulting carbon reduction.
CARBON REDUCTION STRATEGIES
Based on the study by Huang et al.[105]. The LCCE can be expressed as:
where, ADm, activity data of building materials; ADe, activity data of operational energy; CEFm, carbon emission factors of building materials; CEFe, carbon emission factors of energy; CED, supplementary benefits from 3R materials and energy; CEe is carbon reduction by other technologies.
The technical strategies and carbon reduction benefits mentioned in the case studies reviewed from different regions of low-rise dwellings are shown in Figure 14. These were grouped into the following three categories: decreasing ADm or CEFm, reducing ADe or CEFe, and enhancing carbon offset from module D through 3R of building materials and energy.
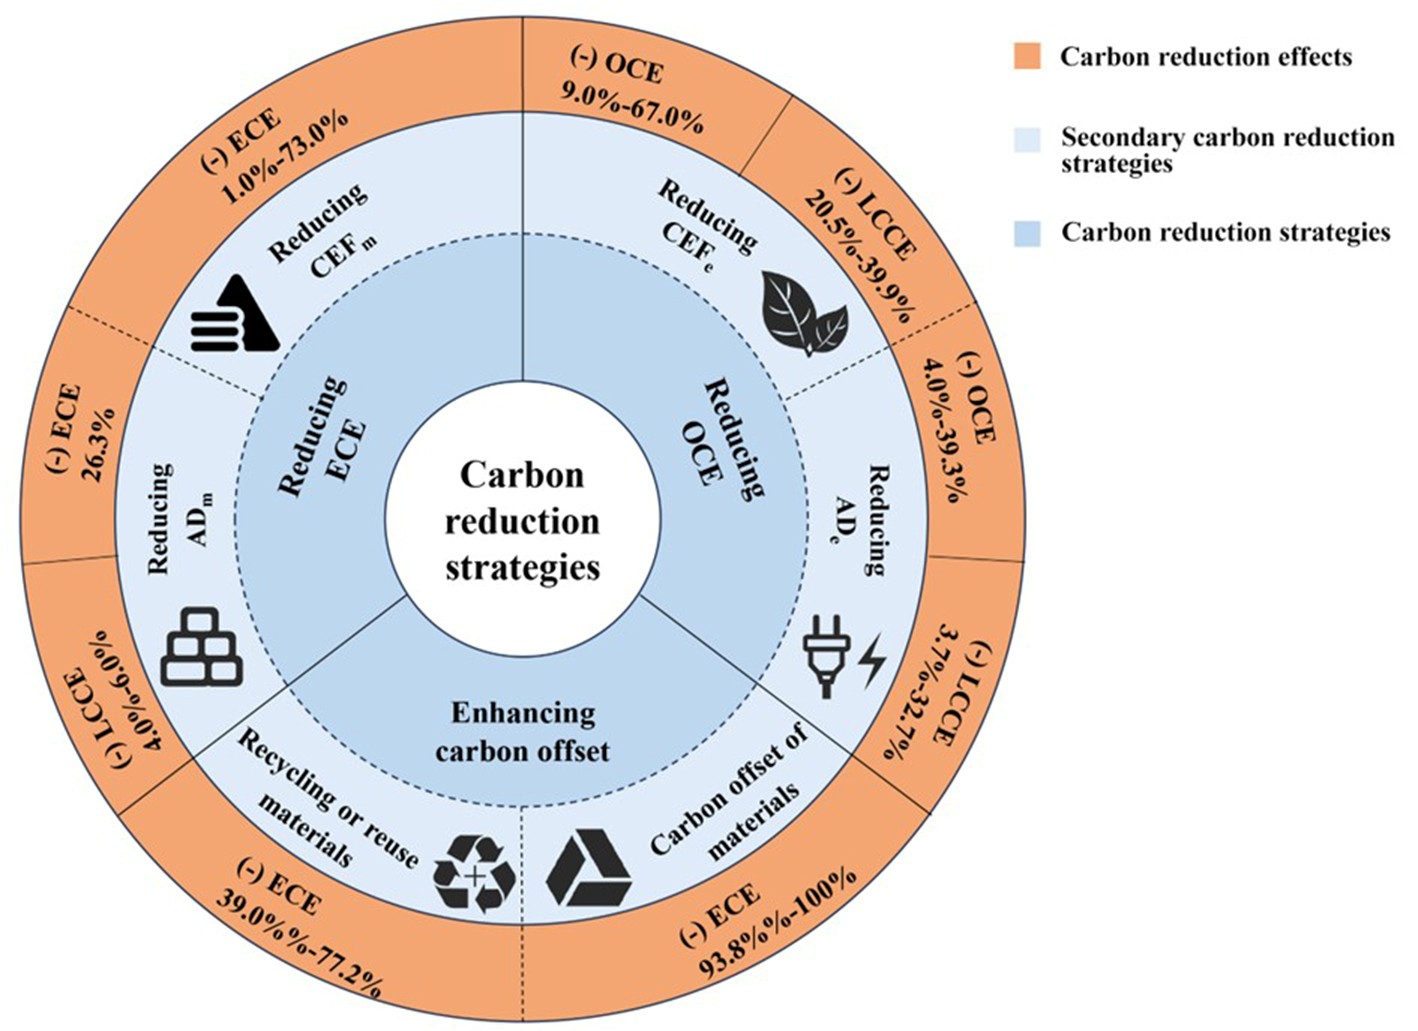
Figure 14. Carbon reduction strategies and effects.
Reduction of building ECE by reducing ADm and CEFm
Regulations for load-bearing structure design are well established for small-scale, low-rise buildings, such as the dwellings discussed in this study. The potential for reducing the amount of building materials is limited by their structural safety. In contrast, the substitution of structural systems with low-carbon building materials has a high potential for CE reduction[110]. The ECE reduction of the optimization schemes was 11.5%-96.5% among the reviewed case studies [Table 3], compared to the corresponding baseline scheme. The ECE reduction was influenced by the difference in CEF and the amount of substitution of building materials between the optimized and baseline structure schemes.
CE reduction technical strategies and benefits by reducing ADm and CEFm
| Literature | Location | Climate | Structure | Technical measures | Technical group | CE reduction effects | ||||
| Optimized scheme | Baseline scheme | ADm | CEFm | ECE | OCE | LCCE | ||||
| Li et al., 2021[15] | China | NS | T, S, M | Wood frame straw bale rural house | Ordinary rural house | ● | ● | (-) 96.5% | ||
| lightweight steel straw bale rural house | Ordinary rural house | ● | ● | (-) 75.5% | ||||||
| Steel frame straw bale rural house | Ordinary rural house | ● | ● | (-) 45% | ||||||
| Zhang et al., 2021[16] | China | Cfa | C, Co | Steel-bamboo composite frame structure | Concrete frame structure | ● | ● | (-) 17.6% | ||
| Gong et al., 2012[17] | China | Dwa | T, S, C | Light-gauge steel framework construction | Concrete framework construction | ● | ● | (-) 31% | ||
| Wood framework construction | Concrete framework construction | ● | ● | (-) 33% | ||||||
| Yang et al., 2021[18] | China | Cfa, Cwb, Cwa, Dwa | T, C | Timber demonstration building | Ordinary RC building | ● | ● | (-) 64.5% | (-) 11.0% | |
| Yu et al., 2011[19] | China | Cfa | T | Using recycled-content materials | Using virgin materials | ● | (-) 18.5% | |||
| Mehravar et al., 2022[31] | Iran | BSk, Cfa, BWk, Csa | T, C, Bio | Straw bale building with wooden structure | Conventional building | ● | ● | (-) 76% | ||
| Straw bale building with concrete structure | Conventional building | ● | ● | (-) 16.9% | ||||||
| Straw bale building with concrete structure and interior brick walls | Conventional building | ● | ● | (-) 13.8% | ||||||
| Hosseinian et al., 2021[32] | Iran | Dsa | C, S | Concrete structures | Steel structures | ● | ● | (-) 24.5% | ||
| Balasbaneh et al., 2020[34] | Malaysia | Af | PC, S | Concrete PPVC structure | Steel PPVC structure | ● | ● | (-) 54% | ||
| Wan Omar et al., 2018[35] | Malaysia | Af | RC, Co | Using low embodied carbon intensity materials | Using ordinary materials | ● | (-) 16.3-41.1% | |||
| Omar et al., 2014[37] | Malaysia | Af | PC, RC | Precast concrete wall panels | Conventional system | ● | (-) 26.3% | |||
| Ajay et al., 2024[42] | Nepal | ET | M | Using sun-dried bricks | Using fired brick | ● | (-) 6%-34% | |||
| Life span 100 years | Life span 50 years | ● | (-) 4%-6% | |||||||
| Souaid et al., 2024[58] | Holland | Cfb | T | Downscale construction and adopt wooden modular units | concrete modular units | ● | ● | (-) 42%-53% | ||
| C | Slate roof covering + Hardwood floor + Glass wool thermal insulation + Timber-based insulating materials | Galvanized steel sheet + Laminate flooring + Cellulose insulation + EPS | ● | (-) 29% | ||||||
| Keyhani et al., 2024[78] | UK | / | NS | Using 50% GGBS | Ordinary Portland cement | ● | (-) 73% | |||
| Using 40% fly ash | Ordinary Portland cement | ● | (-) 65.38% | |||||||
| Using EPS made of recycled materials | Virgin EPS | ● | (-) 0.85% | |||||||
| Using recycled bricks | Virgin bricks | ● | (-) 7.37% | |||||||
| Monahan et al., 2011[84] | UK | Cfb | T, M | Panelized timber frame MMC | Conventional masonry construction | ● | ● | (-) 34% | ||
| Iddon et al., 2013[86] | UK | Cfb | M, T | Using concrete with a 30% PFA mix, timber-framed windows, and a brick slip rainscreen cladding system | Using ordinary concrete, PVC-framed windows, and a brick outer skin | ● | (-) 24% | (-) 5% | ||
| Rossi et al., 2012[91] | Belgium | Cfb | S, M | Steel frame house | Masonry house | ● | ● | (-) 12% | ||
| Moghayedi et al., 2025[94] | Africa | Utilizing 3D printing technology | Utilizing cast-in-place method | ● | (-) 48% | |||||
| Salazar et al., 2009[96] | Canada | Dfb | T, M | Wood-intensive house (system with landfill) | Traditional masonry | ● | (-) 72% | |||
| Zhang et al., 2014[97] | Canada | Csb | T | PVC window frame with low-E tin glazing | Aluminum window frame with standard glass | ● | (-) 15.3% | |||
| PVC membrane (PVC-cellulose) roof | 4-ply build-up asphalt roof | ● | (-) 11.5% | |||||||
| Izaola et al., 2023[66] | Spain | NS | NS | Wooden window frame | Using aluminum window frames | ● | (-) 9.2% | |||
| Wooden flooring | Using ceramic tiles | ● | (-) 2.7% | |||||||
| Recycled cork insulated walls | Brick wall | ● | (-) 1.0% | |||||||
• Almost all studies involving timber (T) structures have low carbon advantages. The CE from the production stage of wood-frame houses was reduced by 64.5% compared to a RC scheme[18]. The ECE of wood-frame rural dwellings was 37.5% lower than that of light-steel-frame houses[28]. A study of a wooden house in Sweden showed a lower ECE for a wood structure than that for a concrete structure[69]. The use of a novel off-site panelized modular timber frame system resulted in a 34% reduction in the ECE compared with conventional construction methods[84]. Hafner et al.[92] demonstrated that the use of wood instead of mineral materials for construction can reduce the ECE.
• Divergent findings were observed in the comparative analysis of concrete and steel structures. Analysis of three structural types for a three-storey residence revealed that concrete frameworks generated 44% and 49% higher CEs during the production phase compared to steel and timber alternatives[17]. When applied to a rural residence in southern Italy, the CEs associated with the cold-formed steel frame and insulated panel wall system were found to be inferior to those of the traditional RC frame with brick walls throughout the pre-use, operational, and end-of-life stages[56]. According to a statistical assessment of 45 residential units in Iran, concrete structures demonstrated an average ECE reduction of 24.46% compared to their steel counterparts[32]. This disparity is even more pronounced in prefabricated prefinished volumetric construction, where concrete designs resulted in 54% fewer emissions than steel designs[34].
• It is also crucial to investigate the capabilities of alternative low-carbon construction techniques. Research indicates that substituting conventional rural housing with straw-bale variations can drastically lower ECE; specifically, reductions of 96.5%, 75.5%, and 45% were observed for wood-frame, lightweight steel, and steel-frame straw-bale systems, respectively[15]. In the context of Iran, a study covering four climatic regions demonstrated that straw-bale dwellings utilizing wooden structures outperformed those with concrete or interior brick walls, achieving ECE decreases of 76.00%, 16.89%, and 13.67% relative to traditional housing[31]. Furthermore, composite materials show promise; for instance, steel-bamboo frames in East China yielded a 17.6% ECE advantage over concrete frames[16]. Similarly, switching from an RC framework to a prefabricated concrete panel wall system in a Malaysian two-story residence resulted in a 26.27% reduction in emissions[37].
• ECE reduction can be achieved by replacing some of the materials with high CEF used in the buildings. Research conducted on ten residential units in Malaysia indicates that the adoption of low-carbon components and materials can lower ECE by a range of 16.28% to 41.10%[35]. Similarly, data from Sweden suggests an inverse relationship between the volume of bio-based materials used and the resulting ECE[67]. In terms of specific material substitutions, one study on a new residence demonstrated a 24% decrease in ECE by utilizing concrete blended with 30% pulverized fly ash and swapping polyvinyl chloride (PVC) window frames for timber ones[86]. Furthermore, optimizing wooden rural dwellings—specifically by substituting ordinary glass with tin-plated glass and aluminum frames with PVC—yielded a 15.25% reduction. This figure could be further improved by an additional 11.48% through the replacement of 4-ply asphalt roofing with PVC-cellulose alternatives[97]. Izaola et al.[111] found that using a wooden window frame to replace an aluminum window frame resulted in a 9.2% reduction in the ECE.
Reduction of building OCE by reducing ADe and CEFe
The implementation of building energy efficiency measures and the optimization of the energy structure to reduce the CEF of the energy supply have great potential. The OCE reduction benefits ranged from
CE reduction technical strategies and benefits by reducing ADe and CEFe
| Literature | Location | Climate | Structure | Technical measures | Technical group | CE reduction effects | ||||
| Optimized scheme | Baseline scheme | AD e | CEF e | ECE | OCE | LCCE | ||||
| Yang et al., 2021[18] | China | Cfa, Cwb, Cwa, Dwa | T | Upgrading energy efficiency to an ultra-low energy building | Ordinary building design | ● | (+) 28.5% | (-) 39.3% | (-) 32.7% | |
| Song et al., 2024[27] | China | Dwa | M | Adding sunrooms | Open-air courtyard | ● | (-) 10.3% | |||
| Adding a layer of thermal insulation on the rooftop | Typical roof tiles | ● | (-) 3.68% | |||||||
| Adding a layer of thermal insulation on the outside of the wall | Typical brick walls | ● | (-) 19.37% | |||||||
| Adding a layer of thermal insulation on the inner side | Wooden doors and windows | ● | (-) 6.74% | |||||||
| Ajay et al., 2024[42] | Nepal | ET | M | 100% hydroelectric | 82.51% hydroelectric | ● | (-) 20.5%- 28.2% | |||
| Cooking with hydroelectricity | Cooking with liquefied petroleum gas | ● | (-) 7.1%-39.9% | |||||||
| Thiers et al., 2008[47] | France | Cfb | T | Passive house design | Ordinary house design | ● | ● | (-) 70.6% | ||
| Blengini et al., 2010[54] | Italy | Cfb | RC | Low-energy house design | Ordinary house design | ● | ● | (-) 55% | ||
| Blengini et al., 2010[55] | Italy | Csa | RC | Passive house design | Ordinary house design | ● | ● | (+) 12.5% | (-) 71.7% | (-) 53.9% |
| Citherlet et al., 2007[75] | Switzerland | Cfb | NS | Using Swiss electricity mix | Using UCTE electricity mix | ● | (-) 67% | |||
| Norouzi et al., 2025[77] | UK | Implementing a 4kWp grid-connected PV system | Implementing a 2kWp grid-connected PV system | ● | (-) 65% | |||||
| Iddon et al., 2013[86] | UK | Cfb | M, T | Improving the thermal envelope | Ordinary building envelope design | ● | (+) 1%-13% | (-) 4%-5% | ||
| Keoleian et al., 2001[98] | USA | Dfb | T | Energy-efficient building design | Ordinary building design | ● | ● | (-) 63% | ||
| Ortiz et al., 2010[100] | Spain | Csa | NS | Optimal mixing of natural gas plus electricity | Pure electricity | ● | (-) 25% | |||
| Colombian | Aw | Co | Optimal mixing of natural gas plus electricity | Pure electricity | ● | (-) 9% | ||||
| Ortiz-Rodríguez et al., 2010[101] | Spain | Csa | NS | Wind power market penetration reaches 15% | Current electricity mix | ● | (-) 10% | |||
| Colombian | Aw | Co | Using hydroelectric plants | Current electricity mix | ● | (-) 11% | ||||
| Peng et al., 2024[112] | China | Cwa | M | Natural ventilation utilizing a solar chimney | Natural ventilation utilizing windows | ● | (-) 16.5 kgCO2/m2 | |||
| Houlihan Wiberg et al., 2023[49] | America | NS | NS | Using a double-glazed window, 102mm brick-fired clay, 19.8mm plywood with CDX sheathing and 90mm fiberglass. Setting the window-to-wall ratio to 0.85 | Using a single-glazed window, 25 mm stucco, 16mm gypsum board, exterior wall insulation | ● | (-) 35.67% | (-) 17.43% | ||
• Existing comprehensive technologies related to building energy conservation reduce OCE. A study of the heating scheme in a PH in northwestern France (including the electric heat pump, wood pellet condensing boiler, wood pellet micro-cogeneration unit, and district heating) showed that the PH showed clear advantages over the reference house during the operating stage, regardless of the heating system. The LCCE of the PH was 70.6% lower than that of the reference house following a comparison using the LCA tool, EQUER[47,49]. A comparison of the OCE using four nZEB schemes and four PH schemes for a two-storey house in Ireland over a 60-year calculation period showed that buildings with high thermal and airtightness and heating systems with low CE (such as biomass boilers or heat pumps) should be prioritized[52]. A functionally equivalent energy-efficient house reduces the LCCE by 63% compared to a standard home in Michigan[98]. The study of a wooden house showed that the building ECE increased by 28.5% by improving the building envelope; however, the OCE decreased by 39.3%, which ultimately reduced the LCCE by 32.7%[18]. A case study of dynamic thermal simulations showed that heavyweight constructions reduce the OCE by 7% compared with lightweight constructions[87].
• Decarbonization of the power grid had a significant impact on the reduction of OCE. The OCE of operating a rural dwelling was reduced by 67% when using the Swiss mix compared to the Union for the Coordination of Transmission of Electricity (UCTE)[98]. The lower CEF of Colombia’s grid resulted in a greatly lower building OCE in Colombia compared with that in Spain; an appropriate energy mix of electricity and natural gas reduces OCE by 25% and 9%, respectively, compared with pure electricity in the Mediterranean and Colombia[112,113]. The OCE of a rural dwelling in Switzerland was only 13% that of the United States because the Swiss energy source mainly originated from hydropower and nuclear energy[114]. A case study in Nepal showed that improving the proportion of hydroelectricity from 82.51% to 100% could reduce the LCCE by 20.5%-28.2%[42].
• The low-carbon transformation of building heating systems was prominent in Europe. Comparison of different building envelopes, heating, and PV systems for a concrete-walled house in Finland showed that the heating system had the greatest impact on the LCCE, and the ground source heat pump was the optimal solution[18]. A study of a rural dwelling in a cold Norwegian climate showed that an all-electric system, heat pump, high-efficiency insulation system, and PV panels achieve zero OCE; however, it was difficult to achieve net zero CEs (ZEB-OM) involving both OCE and ECE[87]. Research focusing on timber-framed rural housing in Sweden indicates that OCE is significantly influenced by the specific energy supply infrastructure utilized; the OCE of DH + BIG/CC (district heat + biomass-based integrated gasification combined cycle) was approximately 90% lower than that of the RH + CST (electric resistance heating + coal-based steam turbine); the OCE of HP + NGCC (heat pump + natural gas-based combined cycle) was 50% lower than that of the RH + CST. The substitution of fossil fuels with biomass by-product from the wood production chain in a wooden house in Växjö showed that the total CEs during the building material production and building operation were negative when DH + BIG/CC or HP + BIG/CC were used[70].
• Strategies showing regional differences. For example, different local power grids have different CEFs, and the benefits generated by saving the same amount of electricity are different. For example, the CEF of electricity production by PVs showed that the CEFs were 72.4 and 54.6 gCO2e/kW, respectively, when the US fuel mix and European UCPTE fuel mix were used[29]. A comparison of wood rural dwellings in five different locations in Europe showed that the OCE still accounted for 65%-76% of the total LCCE, even though the building envelope was well insulated. A cooler climate led to higher OCE owing to greater heating demand; however, differences in electricity and energy could sometimes mask the differences caused by climate. For example, the CEFs of electricity in Germany, Slovenia, and Spain were 0.406, 0.248, and 0.276 kgCO2e/kWh, respectively, making the OCE in Munich (Germany) much higher than that in Ljubljana (Slovenia), although the energy consumption of the two cases was similar[95].
Enhancement of carbon offset from module D through 3R of building materials and energy
The CE reduction benefits of module D among the reviewed cases ranged in 39.0%-100% (ECE) or 2%-3% (LCCE) together with other technology strategies [Table 5]. This requires technological support, such as waste recycling and scrapping. The study of a house with a bamboo structure showed that using building materials with renewable content reduces ECE by 18.5%, and the recycling of construction and demolition waste reduces ECE by 69.2%[29]. A study of Palestinian houses showed that the ECE of traditional houses built with limestone and lime mortar was only 20.3% that of modern houses built with RC and concrete blocks[43]. A study of three typical types of dwellings showed that recycling building materials at the end of their life reduces the LCCE by 3% for detached and semi-rural dwellings and by 2% for terraced houses[92]. A case study in Belgium showed that the ECE of steel-frame houses was similar to that of masonry houses; however, when the recycling potential of steel is taken into account, the ECE associated with steel frameworks drops to 12% below that of masonry construction[100,101].
CE benefits by enhancing carbon offset from module D
| Literature | Location | Climate | Structure | Technical measures | Technical group | CE reduction effects | |||
| Optimized scheme | Baseline scheme | CE D | ECE | OCE | LCCE | ||||
| Li et al., 2021[15] | China | NS | T | CE offset of building materials and construction by carbon sink of wood | Ordinary conditions without carbon sink | ● | (-) 93.8% | ||
| Yu et al., 2011[19] | China | Cfa | T | Recycling of construction and demolition waste | Ordinary conditions without recycling | ● | (-) 69.2% | ||
| Cuéllar-Franca et al., 2012[82] | UK | Cfb | M | Recycling of building materials | Ordinary conditions without recycling | ● | (-) 2%-3% | ||
| Salazar et al., 2009[96] | Canada | Dfb | T, M | Wood-intensive house (system with biomass recovery) | Traditional masonry house | ● | (-) 100% | ||
| Lei et al., 2023[115] | China | Dfa | S | Recycle, reuse and remanufacture | Demolition, transportation and landfill | ● | (-) 73.75%-77.24% | ||
| China | Dfa, Cfa | RC | Recycle, reuse and remanufacture | Demolition, transportation and landfill | ● | (-) 39%-46.93% | |||
STATUS, GAPS, AND RECOMMENDATIONS
Status and gaps
Calculation of LCCE
• Calculation method. Current evaluations of CE in rural housing predominantly rely on macro-level statistics. Consequently, the use of input-output (IO) analysis yields only average emission figures, failing to capture the specific variations between individual structures. This calculation model collects data from different sources (for example, different sectors) for integration, which might cause errors in the calculation owing to the inconsistent statistical methods of the source data. Few case studies are based on actual recorded data, and most were obtained based on calculations and simulations without verification.
The “bottom-up” process analysis (PA) presents the composition of building LCCE, which helps capture CE reduction hotspots. The IO approach cannot provide detailed information regarding the obtained results for methodological reasons. Recent research on Chinese educational facilities indicates that while the IO method is effective for broad estimations, the PA approach provides a more granular depiction of specific characteristics[16]. Furthermore, an investigation into residential structures demonstrated that integrating PA with a hybrid framework successfully identifies 64% of carbon mitigation potential—a figure the IO method failed to capture. Consequently, the IO approach is generally deemed inadequate for conducting detailed assessments of individual buildings[117].
• Basic parameters. The CEF database is based on the industrial sector rather than the construction sector, and the data are relatively coarse. A reliable database of CEFs for building materials has not been formed. Therefore, it was necessary to refer to CEFs from other databases, but as shown in Section "Uncertain CEF", CEF data from different sources significantly varied, which caused significant uncertainty in the calculation. Calculations based on such unreliable CEF data might result in incorrect conclusions. CEFs depend on a complex combination of local production technology, site-specific resource conditions, energy mix, and opaque databases, which might pose real threats to truly low-carbon development.
Reduction of LCCE
• The singularity of the carbon reduction priorities in rural dwellings. Current research primarily focuses on energy-saving technologies for the operational stage of buildings rather than those aimed at reducing ECE. Compared with other review studies, the statistical results of this study showed that the proportion of OCE in the LCCE of low-rise rural dwellings (66.1%) is significantly smaller than that reported by Huang et al.[105] for 826 global building cases (75.2%). The study by Huang et al.[26] showed that the OCE of a rural dwelling in southern China accounts for only 43.2% of the LCCE. The discrepancy may arise from the lower per-unit floor area energy demand with limited potential for further reduction. Consequently, there is restricted scope for optimizing the building envelope to achieve OCE reductions. Furthermore, the grid’s carbon intensity is declining steadily due to the rapid expansion of renewable energy. It is anticipated that the impact of operational energy savings on mitigating building OCE will progressively diminish. Conversely, addressing ECE necessitates a heightened emphasis on curtailing material consumption and promoting the adoption of low-carbon alternatives.
• Insufficient regulatory incentives aimed at promoting low-carbon construction structures. According to the statistics in this study, the ECE of timber and bio-based structural buildings is significantly lower than that of concrete and masonry structures [Figure 3]. However, these two types of structural buildings account for only 27.8% of all cases, with a concentrated distribution in Europe (69.8% of timber and bio-based structural building cases are in Europe). The lack of such buildings in other regions can be attributed to both climatic factors and, in some areas, the absence of supportive policies for the development of timber structures.
Research recommendations
Technical recommendations
(1) Establishment of a localized database for building material CEF: Priority support should be given to cataloging typical rural building materials and establishing a reliable CEF database that accurately reflects the current state of local production technologies.
(2) Conducting fundamental research on material durability: Acquiring data on the durability and expected service life of various building materials under diverse rural operating conditions is critical for the accurate calculation of initial and recurring ECE.
(3) Accumulation of engineering case study data: Efforts should be made to investigate the demolition, waste disposal, and "3R" (Reduce, Reuse, Recycle) processes of typical rural residential structures. This will facilitate the accumulation of data for Modules C and D, providing a basis for scenario assumptions in future policy-making.
Policy recommendations
(1) Research and promotion of low-carbon structural systems: Policy frameworks should prioritize the research and development of structural systems based on locally sourced plant-based materials, such as fast-growing bamboo and cultivated fir. Key efforts must focus on improving their mechanical properties, physical characteristics, and fire resistance to accelerate the transition of these materials from theoretical research to practical engineering applications.
(2) Removal of policy barriers: To promote the adoption of low-carbon structural systems, it is essential to eliminate existing institutional barriers at the policy level. Simultaneously, upgrading related building material manufacturing technologies is required to stimulate green innovation vitality within the industry.
(3) Incentivizing the recycling of idle housing resources: Addressing the phenomenon of “constructing new houses without demolishing old ones”, policies should be introduced to encourage the recycling and reuse of existing idle houses and waste building materials. By reducing the production and consumption of new materials through circular utilization, the ECE of rural dwellings can be effectively lowered.
(4) Aligning with clean energy trends: Policymakers should fully leverage the advantages of rural areas—specifically their low building density and high potential for renewable energy utilization (such as solar and wind power). Aligning with the trend of rapidly decreasing electricity CEFs, policies should vigorously promote the widespread adoption of clean energy in rural regions.
Standardization recommendations
(1) Formulation of specialized calculation and reporting standards: It is recommended that the competent authorities promulgate CE calculation standards specifically tailored for rural residential buildings. These standards should explicitly stipulate the system boundaries and the division of life cycle stages for the accounting process. In particular, the sources of basic parameters (such as CEFs for building materials) must be regulated to enhance the transparency and traceability of the data.
(2) Implementation of a “WRI 0-100” accounting mechanism: Given the current lack of conditions for precisely calculating carbon benefits in modules C and D, it is suggested that the “WRI 0-100” allocation method be introduced at the policy level[109]. This approach allocates the accounting of recycling benefits (Module D) from the post-demolition stage to the pre-use stage of the next building life cycle. The carbon reduction effect is calculated by evaluating the quantity of building materials manufactured from recycled content used in the construction. This value serves as the carbon credit for Module D. This method avoids calculation deviations caused by uncertainties in future demolition scenarios. For Module C, Stage C1 involves natural collapse and generates no CEs. The CEs from construction waste transportation in Stage C2 can be calculated using Equation CEC2 = ADwei × CEFtran. Currently, there is a lack of data regarding the treatment and degradation processes of construction waste in Stages C3 and C4. Since most existing studies omit calculations for these stages, there is a lack of reliable data support.
Heterogeneous differences
The cases included in this review exhibit significant heterogeneity across multiple dimensions, which to some extent limits the direct comparability of results across studies. Specifically, this heterogeneity is primarily reflected in the following aspects.
In terms of contextual and technical parameters: The reviewed cases are located in different countries and climate zones. This variation directly affects building operational energy consumption and the CEF of electricity, thereby significantly impacting the comparability of OCE calculation results. For instance: for residential buildings with the same three-story masonry structure, the case investigated by Norouzi et al.[77] is located in the UK (with an electricity CEF of 0.207 kgCO2e/kWh), while the case studied by
In terms of methodology: First, the definition of system boundaries (e.g., whether Module D is included) directly determines the accumulation scope of CEs. Second, the lack of uniform functional units renders the horizontal comparison of absolute values meaningless; thus, units must be standardized before any comparison can be made. Finally, the selection of CEF databases (as previously discussed regarding regional differences and database sources) introduces systematic biases into the foundational data.
CONCLUSION
To characterize CEs in rural dwellings and develop effective mitigation strategies for low-carbon development. This study reviewed 90 studies with 309 cases of low-rise rural dwellings in Asia, Europe, North America, South America and Africa, with reference to the ISO 21930 standard. This study reviewed and analyzed the calculation methods and results of CEs across each life cycle stage of buildings, and summarized CE reduction strategies. On this basis, corresponding recommendations for the accurate calculation of LCCE and the advancement of CE reduction strategies were proposed.
Based on the reviewed dataset, the analysis suggested that the operation stage (B6) predominantly contributes to LCCE, with a median value of 792.0 kgCO2e/m2, which is approximately four times higher than that of the building material production stage (200.0 kgCO2e/m2). The production stage (A1-A3) is the most frequently assessed stage (97.8% of cases), however, significant data gaps remain in the construction (A4-A5), maintenance (B1-B5), and end-of-life (C1-C4) stages, which were considered in fewer than 70% of the studies. It should be noted that the geographical distribution of the reviewed cases is heavily concentrated in Asia and Europe. Therefore, the observed dominance of OCE is primarily representative of the contexts covered in this review and may not be universally generalizable to all rural dwellings worldwide.
Our analysis revealed that structural typology and regional context are critical determinants of ECE. Masonry and concrete structures exhibit significantly higher ECE (359.92-362.50 kgCO2e/m2) compared to wood structures (172.21 kgCO2e/m2). The substantial variation in reported CEFs for materials like steel and cement across different studies highlights the urgent need for localized, reliable databases. Furthermore, the inconsistency in system boundaries and calculation methods—particularly regarding the exclusion of building equipment and water consumption in many studies—hinders accurate cross-regional comparisons.
In terms of decarbonization measures, suggestions were put forward for advancing standard low-carbon technologies. These encompass low-carbon structural frameworks, the reclamation and repurposing of materials from aging rural residences, high-efficiency electrical and lighting fixtures, as well as sustainable disposal techniques for derelict rural housing.
Despite these insights, this study has certain limitations. First, the regional coverage is insufficient. Building cases are predominantly concentrated in Asia and Europe, accounting for 93.8% of all cases, while there are relatively few cases from the Americas, Oceania, and Africa. Consequently, it is inadequate to generalize the CE characteristics of low-rise buildings in these regions. Second, data for certain structural types (composite structures, steel, and bio-based) are limited, which may lead to statistical limitations. Third, given that a significant proportion of rural buildings are existing rather than newly built, their carbon reduction strategies should differ from those for new constructions. However, the findings of this study are primarily applicable to new building scenarios; carbon reduction strategies specifically for existing buildings warrant further research. Finally, a limitation of this study lies in the disparity of sample sizes among structural types. The statistical findings for bio-based structures are based on a very limited sample (n = 3), and thus, these results should be considered preliminary. Similarly, steel and composite categories have smaller sample sizes compared to masonry and timber, which implies a wider confidence interval and lower statistical power for these specific groups. Future research will further strengthen the study of CEs in rural dwellings and promote their low-carbon and sustainable development.
DECLARATIONS
Authors’ contribution
Writing - review & editing, validation, supervision, methodology, formal analysis, data curation, conceptualization: Huang, Z.
Methodology, investigation, formal analysis, data curation, conceptualization: Cheng, M.
Formal analysis, data curation: Zheng, Y.
Availability of data and materials
Not applicable.
AI and AI-assisted tools statement
Not applicable.
Financial support and sponsorship
The research has been supported by the National Natural Science Foundation of China (52278020), the State Key Laboratory of Subtropical Building and Urban Science (2023ZB07), and the Fundamental Research Funds for the Central Universities (2024ZYGXZR081).
Conflicts of interest
All authors declared that there are no conflicts of interest.
Ethical approval and consent participate
Not applicable.
Consent for publication
Not applicable.
Copyright
© The Author(s) 2026.
Supplementary Materials
REFERENCES
1. Xian, Y.; Wang, H.; Zhang, Z.; Yang, Y.; Zhong, Y. Driving factors and reduction paths dynamic simulation optimization of carbon dioxide emissions in China's construction industry under the perspective of dual carbon targets. Environ. Impact. Assess. Rev. 2025, 112, 107789.
2. Zheng, Z.; Shuang, Q. Dynamic scenario analysis and prediction of embodied carbon emissions in China's building sector: a hybrid interpretable machine learning model. Environ. Impact. Assess. Rev. 2026, 116, 108119.
3. World Bank. Total carbon dioxide (CO2) emissions excluding land use, land-use change and forestry (LULUCF) (million tonnes of CO2 equivalent) - world. 2025. Available from: https://data.worldbank.org.cn/indicator/EN.GHG.CO2.MT.CE.AR5 [Last accessed on 8 Jul 2026].
4. Cheng, B.; Lu, K.; Li, J.; Chen, H.; Luo, X.; Shafique, M. Comprehensive assessment of embodied environmental impacts of buildings using normalized environmental impact factors. J. Clean. Prod. 2022, 334, 130083.
5. Gao, H.; Sun, M.; Zuo, L.; Liang, Y. An LCA-BIM-GIS integrated model for net carbon emission quantification of buildings. J. Build. Eng. 2026, 120, 115392.
6. United Nations Environment Programme. Global status report for buildings and construction 2024/2025. 2025. Available from: https://www.unep.org/resources/report/global-status-report-buildings-and-construction-20242025 [Last accessed on 8 Jul 2026].
7. World Bank. Urban population. 2025. Available from: https://data.worldbank.org/indicator/SP.URB.TOTL [Last accessed on 8 Jul 2026].
8. National Bureau of Statistics. National data. 2025. Available from: https://www.stats.gov.cn/sj/ndsj/2025/indexch.htm [Last accessed on 8 Jul 2026].
9. National Bureau of Statistics. China population census yearbook 2020 (Chinese). 2025. Available from: https://www.stats.gov.cn/sj/pcsj/rkpc/7rp/zk/indexch.htm [Last accessed on 8 Jul 2026].
10. World Bank. Rural population (% of total population) - India. 2025. Available from: https://data.worldbank.org.cn/indicator/SP.RUR.TOTL.ZS?locations=IN [Last accessed on 8 Jul 2026].
11. Li, Y.; Xu, W.; Chen, H.; Jiang, J.; Li, X. A novel framework based on mask R-CNN and histogram thresholding for scalable segmentation of new and old rural buildings. Remote. Sens. 2021, 13, 1070.
12. Jiang, Y.; Hu, S.; Liu, X.; Zhang, T.; Wei, Q. China’s building energy use and GHG emissions. In: Decarbonize public and commercial buildings. Singapore: Springer; 2022, pp. 3-43.
13. Ottelin, J.; Heinonen, J.; Nässén, J.; Junnila, S. Household carbon footprint patterns by the degree of urbanisation in Europe. Environ. Res. Lett. 2019, 14, 114016.
14. Pang, M.; Meirelles, J.; Moreau, V.; Binder, C. Urban carbon footprints: a consumption-based approach for Swiss households. Environ. Res. Commun. 2019, 2, 011003.
15. Li, H.; Luo, Z.; Xu, X.; Cang, Y.; Yang, L. Assessing the embodied carbon reduction potential of straw bale rural houses by hybrid life cycle assessment: a four-case study. J. Clean. Prod. 2021, 303, 127002.
16. Zhang, X.; Xu, J.; Zhang, X.; Li, Y. Life cycle carbon emission reduction potential of a new steel-bamboo composite frame structure for residential houses. J. Build. Eng. 2021, 39, 102295.
17. Gong, X.; Nie, Z.; Wang, Z.; Cui, S.; Gao, F.; Zuo, T. Life cycle energy consumption and carbon dioxide emission of residential building designs in Beijing: a comparative study. J. Ind. Ecol. 2012, 16, 576-87.
18. Yang, X.; Zhang, S.; Wang, K. Quantitative study of life cycle carbon emissions from 7 timber buildings in China. Int. J. Life. Cycle. Assess. 2021, 26, 1721-34.
19. Yu, D.; Tan, H.; Ruan, Y. A future bamboo-structure residential building prototype in China: life cycle assessment of energy use and carbon emission. Energy. Build. 2011, 43, 2638-46.
20. Li, L.; Chen, K. Quantitative assessment of carbon dioxide emissions in construction projects: a case study in Shenzhen. J. Clean. Prod. 2017, 141, 394-408.
21. Zhang, X.; Du, J.; Sharples, S. A parametric analysis of future climate change effects on the energy performance and carbon emissions of a Chinese prefabricated timber house. Build. Serv. Eng. Res. Technol. 2022, 44, 167-85.
22. Cai, K.; Wang, H.; Wang, J.; et al. Mitigating lifecycle GHG emissions of building sector through prefabricated light-steel buildings in comparison with traditional cast-in-place buildings. Resour. Conserv. Recycl. 2023, 194, 107007.
23. Liu, Y.; Zhang, J.; Xu, J.; Wang, Y.; Li, B.; Zhang, S. Carbon emission-based life cycle assessment of rural residential buildings constructed with engineering bamboo: a case study in China. J. Build. Eng. 2023, 76, 107182.
24. Yan, S.; Shi, F.; Zheng, C.; Ma, Y.; Huang, J. Whole biomass material envelope system for nearly-zero energy houses: carbon footprint and construction cost assessment. J. Build. Eng. 2024, 86, 108757.
25. Zhao, Z.; Chen, H.; Liu, H.; Zhu, Z.; Zhao, T.; Zhou, T. Embodied carbon emission reduction potential of new steel-timber composite frame structure for rural houses. Structures 2024, 61, 106121.
26. Huang, Z.; Tang, H.; Wen, Y.; Sun, W.; Zhou, H.; Lin, B. Life-cycle carbon emission calculation and reduction for rural dwellings of “hollow village”: a case study in South China. Environ. Impact. Assess. Rev. 2024, 106, 107514.
27. Song, X.; Xu, W.; Miao, J.; Zheng, S.; Zhang, Y.; Yang, X. Low-carbon renewal strategies of bungalow courtyards in Beijing. Energy. Build. 2025, 332, 115374.
28. Suzuki, M.; Oka, T.; Okada, K. The estimation of energy consumption and CO2 emission due to housing construction in Japan. Energy. Build. 1995, 22, 165-9.
29. Gerilla, G.; Teknomo, K.; Hokao, K. An environmental assessment of wood and steel reinforced concrete housing construction. Build. Environ. 2007, 42, 2778-84.
30. Jeong, Y.; Lee, S.; Huh, J. Estimation of CO2 emission of apartment buildings due to major construction materials in the Republic of Korea. Energy. Build. 2012, 49, 437-42.
31. Mehravar, M.; Veshkini, A.; Veiseh, S.; Fayaz, R. Physical properties of straw bale and its effect on building energy conservation and carbon emissions in different climatic regions of Iran. Energy. Build. 2022, 254, 111559.
32. Hosseinian, S. M.; Faghani, M. Assessing the effect of structural parameters and building site in achieving low carbon building materialization using a life-cycle assessment approach. J. Build. Eng. 2021, 44, 103318.
33. Piroozfar, P.; Pomponi, F.; El-Alem, F. Life cycle environmental impact assessment of contemporary and traditional housing in Palestine. Energy. Build. 2019, 202, 109333.
34. Balasbaneh, A. T.; Bin Marsono, A. K. Strategies for reducing greenhouse gas emissions from residential sector by proposing new building structures in hot and humid climatic conditions. Build. Environ. 2017, 124, 357-68.
35. Wan Omar, W. M. S. A hybrid life cycle assessment of embodied energy and carbon emissions from conventional and industrialised building systems in Malaysia. Energy. Build. 2018, 167, 253-68.
36. Balasbaneh, A. T.; Ramli, M. Z. A comparative life cycle assessment (LCA) of concrete and steel-prefabricated prefinished volumetric construction structures in Malaysia. Environ. Sci. Pollut. Res. 2020, 27, 43186-201.
37. Omar, W. M. S. W.; Doh, J.; Panuwatwanich, K.; Miller, D. Assessment of the embodied carbon in precast concrete wall panels using a hybrid life cycle assessment approach in Malaysia. Sustain. Cities. Soc. 2014, 10, 101-11.
38. Bin Marsono, A. K.; Balasbaneh, A. T. Combinations of building construction material for residential building for the global warming mitigation for Malaysia. Constr. Build. Mater. 2015, 85, 100-8.
39. Atmaca, A.; Atmaca, N. Life cycle energy (LCEA) and carbon dioxide emissions (LCCO2A) assessment of two residential buildings in Gaziantep, Turkey. Energy. Build. 2015, 102, 417-31.
40. Kayaçetin, N. C.; Hozatlı, B. Whole life carbon assessment of representative building typologies for nearly zero energy building definitions. J. Build. Eng. 2024, 95, 110214.
41. Myint, N. N.; Shafique, M. Embodied carbon emissions of buildings: taking a step towards net zero buildings. Case. Stud. Constr. Mater. 2024, 20, e03024.
42. Ajay, K.; Mainali, B.; Ghimire, A.; Adhikari, B.; Lohani, S. P.; Baral, B. Role of vernacular architecture in enhancing the environmental sustainability of the building sector. Energy. Sustain. Dev. 2025, 86, 101695.
43. Francis, A.; Padmanabhan, V.; Thomas, A. A life cycle assessment - based case study analysis of the sustainability of “vernacular” versus contemporary construction techniques. Eng. Constr. Archit. Manag. 2024, 32, 6187-212.
44. Passer, A.; Kreiner, H.; Maydl, P. Assessment of the environmental performance of buildings: A critical evaluation of the influence of technical building equipment on residential buildings. Int. J. Life. Cycle. Assess. 2012, 17, 1116-30.
45. Krasny, E.; Klarić, S.; Korjenić, A. Analysis and comparison of environmental impacts and cost of bio-based house versus concrete house. J. Clean. Prod. 2017, 161, 968-76.
46. Pal, S. K.; Takano, A.; Alanne, K.; Siren, K. A life cycle approach to optimizing carbon footprint and costs of a residential building. Build. Environ. 2017, 123, 146-62.
47. Thiers, S.; Peuportier, B. Energy and environmental assessment of two high energy performance residential buildings. Build. Environ. 2012, 51, 276-84.
48. Thiers, S.; Peuportier, B. Thermal and environmental assessment of a passive building equipped with an earth-to-air heat exchanger in France. Solar. Energy. 2008, 82, 820-31.
49. Houlihan Wiberg, A.; Georges, L.; Dokka, T. H.; et al. A net zero emission concept analysis of a single-family house. Energy. Build. 2014, 74, 101-10.
50. Kristjansdottir, T. F.; Heeren, N.; Andresen, I.; Brattebø, H. Comparative emission analysis of low-energy and zero-emission buildings. Build. Res. Inf. 2017, 46, 367-82.
51. Famuyibo, A.; Duffy, A.; Strachan, P. Achieving a holistic view of the life cycle performance of existing dwellings. Build. Environ. 2013, 70, 90-101.
52. Moran, P.; Goggins, J.; Hajdukiewicz, M. Super-insulate or use renewable technology? Life cycle cost, energy and global warming potential analysis of nearly zero energy buildings (NZEB) in a temperate oceanic climate. Energy. Build. 2017, 139, 590-607.
53. Asdrubali, F.; Baldassarri, C.; Fthenakis, V. Life cycle analysis in the construction sector: Guiding the optimization of conventional Italian buildings. Energy. Build. 2013, 64, 73-89.
54. Blengini, G. A.; Di Carlo, T. The changing role of life cycle phases, subsystems and materials in the LCA of low energy buildings. Energy. Build. 2010, 42, 869-80.
55. Blengini, G. A.; Di Carlo, T. Energy-saving policies and low-energy residential buildings: an LCA case study to support decision makers in Piedmont (Italy). Int. J. Life. Cycle. Assess. 2010, 15, 652-65.
56. Vitale, P.; Spagnuolo, A.; Lubritto, C.; Arena, U. Environmental performances of residential buildings with a structure in cold formed steel or reinforced concrete. J. Clean. Prod. 2018, 189, 839-52.
57. Proietti, S.; Sdringola, P.; Desideri, U.; Zepparelli, F.; Masciarelli, F.; Castellani, F. Life cycle assessment of a passive house in a seismic temperate zone. Energy. Build. 2013, 64, 463-72.
58. Souaid, C.; Ten, Caat. P. N.; Meijer, A.; Visscher, H. Downsizing and the use of timber as embodied carbon reduction strategies for new-build housing: a partial life cycle assessment. Build. Environ. 2024, 253, 111285.
59. Parece, S.; Resende, R.; Rato, V. A BIM-based tool for embodied carbon assessment using a construction classification system. Dev. Built. Environ. 2024, 19, 100467.
60. Bastos, J.; Batterman, S. A.; Freire, F. Life-cycle energy and greenhouse gas analysis of three building types in a residential area in Lisbon. Energy. Build. 2014, 69, 344-53.
61. Monteiro, H.; Freire, F. Life-cycle assessment of a house with alternative exterior walls: comparison of three impact assessment methods. Energy. Build. 2012, 47, 572-83.
62. Zabalza Bribián, I.; Aranda Usón, A.; Scarpellini, S. Life cycle assessment in buildings: State-of-the-art and simplified LCA methodology as a complement for building certification. Build. Environ. 2009, 44, 2510-20.
63. Ortiz, O.; Bonnet, C.; Bruno, J. C.; Castells, F. Sustainability based on LCM of residential dwellings: a case study in Catalonia, Spain. Build. Environ. 2009, 44, 584-94.
64. Pacheco-Torres, R.; Jadraque, E.; Roldán-Fontana, J.; Ordóñez, J. Analysis of CO2 emissions in the construction phase of single-family detached houses. Sustain. Cities. Soc. 2014, 12, 63-8.
65. Davis, A.; Quintana-Gallardo, A.; Martí Audí, N.; Guillén Guillamón, I. The impact of lifespan assumptions in LCA: comparing the replacement of building parts versus building layers—A housing case study. Energy. Build. 2025, 326, 115050.
66. Izaola, B.; Akizu-Gardoki, O. Biodiversity burdens in Spanish conventional and low-impact single-family homes. Sci. Total. Environ. 2024, 909, 168371.
67. Petrović, B.; Eriksson, O.; Zhang, X. Carbon assessment of a wooden single-family building - A novel deep green design and elaborating on assessment parameters. Build. Environ. 2023, 233, 110093.
68. Gustavsson, L.; Joelsson, A.; Sathre, R. Life cycle primary energy use and carbon emission of an eight-storey wood-framed apartment building. Energy. Build. 2010, 42, 230-42.
69. Gustavsson, L.; Joelsson, A. Life cycle primary energy analysis of residential buildings. Energy. Build. 2010, 42, 210-20.
70. Nässén, J.; Holmberg, J.; Wadeskog, A.; Nyman, M. Direct and indirect energy use and carbon emissions in the production phase of buildings: an input-output analysis. Energy 2007, 32, 1593-602.
71. Karami, P.; Al-Ayish, N.; Gudmundsson, K. A comparative study of the environmental impact of Swedish residential buildings with vacuum insulation panels. Energy. Build. 2015, 109, 183-94.
72. Petrovic, B.; Myhren, J. A.; Zhang, X.; Wallhagen, M.; Eriksson, O. Life cycle assessment of a wooden single-family house in Sweden. Appl. Energy. 2019, 251, 113253.
73. Peñaloza, D.; Erlandsson, M.; Falk, A. Exploring the climate impact effects of increased use of bio-based materials in buildings. Constr. Build. Mater. 2016, 125, 219-26.
74. Jonsson, A.; Bjorklund, T.; Tillman, A. LCA of concrete and steel building frames. Int. J. LCA. 1998, 3, 216-24.
75. Citherlet, S.; Defaux, T. Energy and environmental comparison of three variants of a family house during its whole life span. Build. Environ. 2007, 42, 591-8.
76. Bertini, A.; Al-Obaidy, M.; Dasse, M.; Amaripadath, D.; Gobbo, E.; Attia, S. Parametrization of variables affecting the whole life carbon performance of nearly zero energy residential building renovation. Build. Environ. 2025, 278, 113013.
77. Norouzi, M.; Haddad, A. N.; Jiménez, L.; Mohajerani, M.; Boer, D. Long-term decarbonization prediction of buildings accounting for temporal variations in grid and material emission factors: a case study of timber-framed passive houses in the United Kingdom. Renew. Energy. 2025, 242, 122476.
78. Keyhani, M.; Bahadori‐Jahromi, A.; Fu, C.; Godfrey, P.; Zhang, H. Whole‐life embodied carbon reduction strategies in UK buildings: a comprehensive analysis. Energy. Sci. Eng. 2024, 12, 5370-84.
79. Mohammadpourkarbasi, H.; Riddle, B.; Liu, C.; Sharples, S. Life cycle carbon assessment of decarbonising UK’s hard-to-treat homes: a comparative study of conventional retrofit vs EnerPHit, heat pump first vs fabric first and ecological vs petrochemical retrofit approaches. Energy. Build. 2023, 296, 113353.
80. Norouzi, M.; Haddad, A. N.; Jiménez, L.; Hoseinzadeh, S.; Boer, D. Carbon footprint of low-energy buildings in the United Kingdom: effects of mitigating technological pathways and decarbonization strategies. Sci. Total. Environ. 2023, 882, 163490.
81. Newberry, P.; Harper, P.; Norman, J. Carbon assessment of building shell options for eco self-build community housing through the integration of building energy modelling and life cycle analysis tools. J. Build. Eng. 2023, 70, 106356.
82. Cuéllar-Franca, R. M.; Azapagic, A. Environmental impacts of the UK residential sector: Life cycle assessment of houses. Build. Environ. 2012, 54, 86-99.
83. Moncaster, A.; Symons, K. A method and tool for ‘cradle to grave’ embodied carbon and energy impacts of UK buildings in compliance with the new TC350 standards. Energy. Build. 2013, 66, 514-23.
84. Monahan, J.; Powell, J. An embodied carbon and energy analysis of modern methods of construction in housing: a case study using a lifecycle assessment framework. Energy. Build. 2011, 43, 179-88.
85. Asif, M.; Muneer, T.; Kelley, R. Life cycle assessment: a case study of a dwelling home in Scotland. Build. Environ. 2007, 42, 1391-4.
86. Iddon, C. R.; Firth, S. K. Embodied and operational energy for new-build housing: a case study of construction methods in the UK. Energy. Build. 2013, 67, 479-88.
87. Hacker, J. N.; De Saulles, T. P.; Minson, A. J.; Holmes, M. J. Embodied and operational carbon dioxide emissions from housing: a case study on the effects of thermal mass and climate change. Energy. Build. 2008, 40, 375-84.
88. Essaghouri, L.; Mao, R.; Li, X. Environmental benefits of using hempcrete walls in residential construction: an LCA-based comparative case study in Morocco. Environ. Impact. Assess. Rev. 2023, 100, 107085.
89. Hansen, R. N.; Eliassen, J. L.; Schmidt, J.; et al. Environmental consequences of shifting to timber construction: the case of Denmark. Sustain. Prod. Consum. 2024, 46, 54-67.
90. Rossi, B.; Marique, A.; Reiter, S. Life-cycle assessment of residential buildings in three different European locations, case study. Build. Environ. 2012, 51, 402-7.
91. Rossi, B.; Marique, A.; Glaumann, M.; Reiter, S. Life-cycle assessment of residential buildings in three different European locations, basic tool. Build. Environ. 2012, 51, 395-401.
92. Hafner, A.; Schäfer, S. Comparative LCA study of different timber and mineral buildings and calculation method for substitution factors on building level. J. Clean. Prod. 2017, 167, 630-42.
93. Quintana-Gallardo, A.; Schau, E. M.; Niemelä, E. P.; Burnard, M. D. Comparing the environmental impacts of wooden buildings in Spain, Slovenia, and Germany. J. Clean. Prod. 2021, 329, 129587.
94. Moghayedi, A.; Awuzie, B. O. A framework for facilitating low-income net-zero energy housing delivery in developing countries: insights from a practical case in South Africa. Build. Environ. 2025, 276, 112847.
95. Moghayedi, A.; Mahachi, J.; Lediga, R.; Mosiea, T.; Phalafala, E. Revolutionizing affordable housing in Africa: a comprehensive technical and sustainability study of 3D-printing technology. Sustain. Cities. Soc. 2024, 105, 105329.
96. Salazar, J.; Meil, J. Prospects for carbon-neutral housing: the influence of greater wood use on the carbon footprint of a single-family residence. J. Clean. Prod. 2009, 17, 1563-71.
97. Zhang, W.; Tan, S.; Lei, Y.; Wang, S. Life cycle assessment of a single-family residential building in Canada: a case study. Build. Simul. 2013, 7, 429-38.
98. Keoleian, G. A.; Blanchard, S.; Reppe, P. Life‐cycle energy, costs, and strategies for improving a single‐family house. J. Ind. Ecol. 2008, 4, 135-56.
99. Arvizu-Piña, V. A.; Armendáriz López, J. F.; García González, A. A.; Barrera Alarcón, I. G. An open access online tool for LCA in building’s early design stage in the Latin American context. A screening LCA case study for a bioclimatic building. Energy. Build. 2023, 295, 113269.
100. Ortiz, O.; Castells, F.; Sonnemann, G. Operational energy in the life cycle of residential dwellings: the experience of Spain and Colombia. Appl. Energy. 2010, 87, 673-80.
101. Ortiz-Rodríguez, O.; Castells, F.; Sonnemann, G. Life cycle assessment of two dwellings: one in Spain, a developed country, and one in Colombia, a country under development. Sci. Total. Environ. 2010, 408, 2435-43.
102. Sandanayake, M.; Zhang, G.; Setunge, S. Environmental emissions at foundation construction stage of buildings - Two case studies. Build. Environ. 2016, 95, 189-98.
103. Mosteiro-Romero, M.; Krogmann, U.; Wallbaum, H.; Ostermeyer, Y.; Senick, J. S.; Andrews, C. J. Relative importance of electricity sources and construction practices in residential buildings: a Swiss-US comparison of energy related life-cycle impacts. Energy. Build. 2014, 68, 620-31.
104. Shi, L.; Qi, X.; Yang, Z.; et al. Comparative study of greenhouse gas emission calculations and the environmental impact in the life cycle assessment of buildings in China, Finland, and the United States. J. Build. Eng. 2023, 70, 106396.
105. Huang, Z.; Zhou, H.; Miao, Z.; Tang, H.; Lin, B.; Zhuang, W. Life-cycle carbon emissions (LCCE) of buildings: implications, calculations, and reductions. Engineering 2024, 35, 115-39.
106. World Steel Association. Life cycle assessment methodology report. 2011. Available from: https://worldsteel.org/wp-content/uploads/Life-cycle-inventory-methodology-report.pdf [Last accessed on 8 Jul 2026].
107. Hasanbeigi, A.; Arens, M.; Cardenas, J. C. R.; Price, L.; Triolo, R. Comparison of carbon dioxide emissions intensity of steel production in China, Germany, Mexico, and the United States. Resour. Conserv. Recycl. 2016, 113, 127-39.
108. Park, J.; Tae, S.; Kim, T. Life cycle CO2 assessment of concrete by compressive strength on construction site in Korea. Renew. Sustain. Energy. Rev. 2012, 16, 2940-6.
109. World Resources Institute (WRI) and the World Business Council for Sustainable Development (WBCSD). Greenhouse gas protocol product life cycle accounting and reporting standard. 2011. Available from: https://www.wri.org/research/greenhouse-gas-protocol-product-life-cycle-accounting-and-reporting-standard [Last accessed on 8 Jul 2026].
110. Teng, Y.; Pan, W. Systematic embodied carbon assessment and reduction of prefabricated high-rise public residential buildings in Hong Kong. J. Clean. Prod. 2019, 238, 117791.
111. Izaola, B.; Akizu-gardoki, O.; Oregi, X. Setting baselines of the embodied, operational and whole life carbon emissions of the average Spanish residential building. Sustain. Prod. Consum. 2023, 40, 252-64.
112. Peng, P.; Wang, H. Solar chimney design in rural areas of Anhui, China: CFD simulation, energy and carbon footprint assessment. J. Build. Eng. 2024, 96, 110590.
113. Kamazani, M. A.; Dixit, M. K. Multi-objective optimization of embodied and operational energy and carbon emission of a building envelope. J. Clean. Prod. 2023, 428, 139510.
114. Pacca, S.; Sivaraman, D.; Keoleian, G. A. Parameters affecting the life cycle performance of PV technologies and systems. Energy. Policy. 2007, 35, 3316-26.
115. Lei, B.; Yang, W.; Yan, Y.; Zaland, S.; Tang, Z.; Dong, W. Carbon-saving benefits of various end-of-life strategies for different types of building structures. Dev. Built. Environ. 2023, 16, 100264.
116. Chang, Y.; Ries, R. J.; Lei, S. The embodied energy and emissions of a high-rise education building: A quantification using process-based hybrid life cycle inventory model. Energy. Build. 2012, 55, 790-8.
Cite This Article
 Open Access
How to Cite
Download Citation
Export Citation File:
Type of Import
Tips on Downloading Citation
Citation Manager File Format
Type of Import
Direct Import: When the Direct Import option is selected (the default state), a dialogue box will give you the option to Save or Open the downloaded citation data. Choosing Open will either launch your citation manager or give you a choice of applications with which to use the metadata. The Save option saves the file locally for later use.
Indirect Import: When the Indirect Import option is selected, the metadata is displayed and may be copied and pasted as needed.
About This Article
Special Topic
Copyright

Data & Comments
Data
0











Comments
Comments must be written in English. Spam, offensive content, impersonation, and private information will not be permitted. If any comment is reported and identified as inappropriate content by OAE staff, the comment will be removed without notice. If you have any queries or need any help, please contact us at [email protected].