

fig4
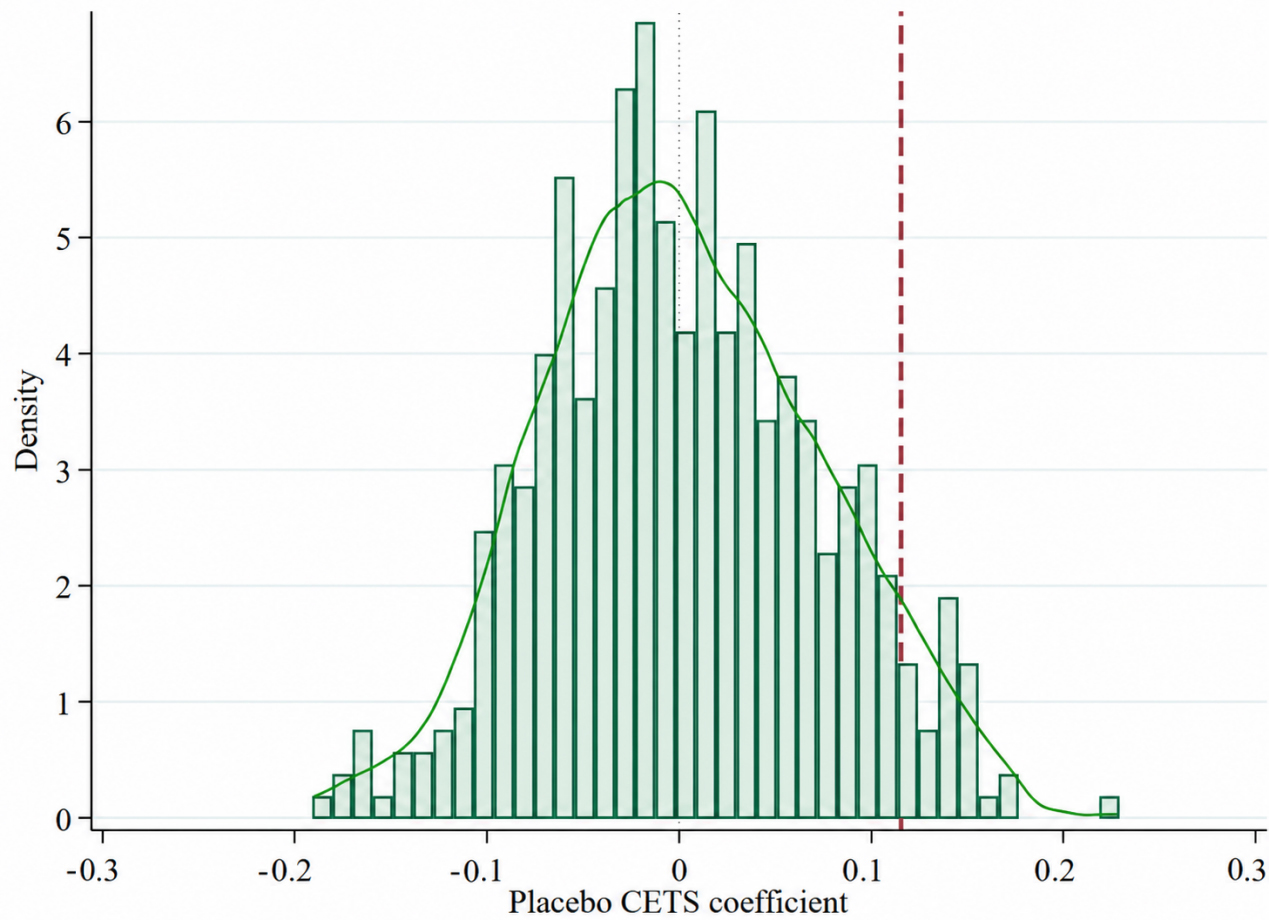
Figure 4. CETS placebo test. The red dashed line indicates the benchmark CETS coefficient, while the green solid curve represents the kernel density estimate of the placebo coefficients. CETS: Carbon emissions trading scheme.
Figure 4. CETS placebo test. The red dashed line indicates the benchmark CETS coefficient, while the green solid curve represents the kernel density estimate of the placebo coefficients. CETS: Carbon emissions trading scheme.


All published articles are preserved here permanently
https://www.portico.org/publishers/oae/ All published articles are preserved here permanently
https://www.portico.org/publishers/oae/