

fig3
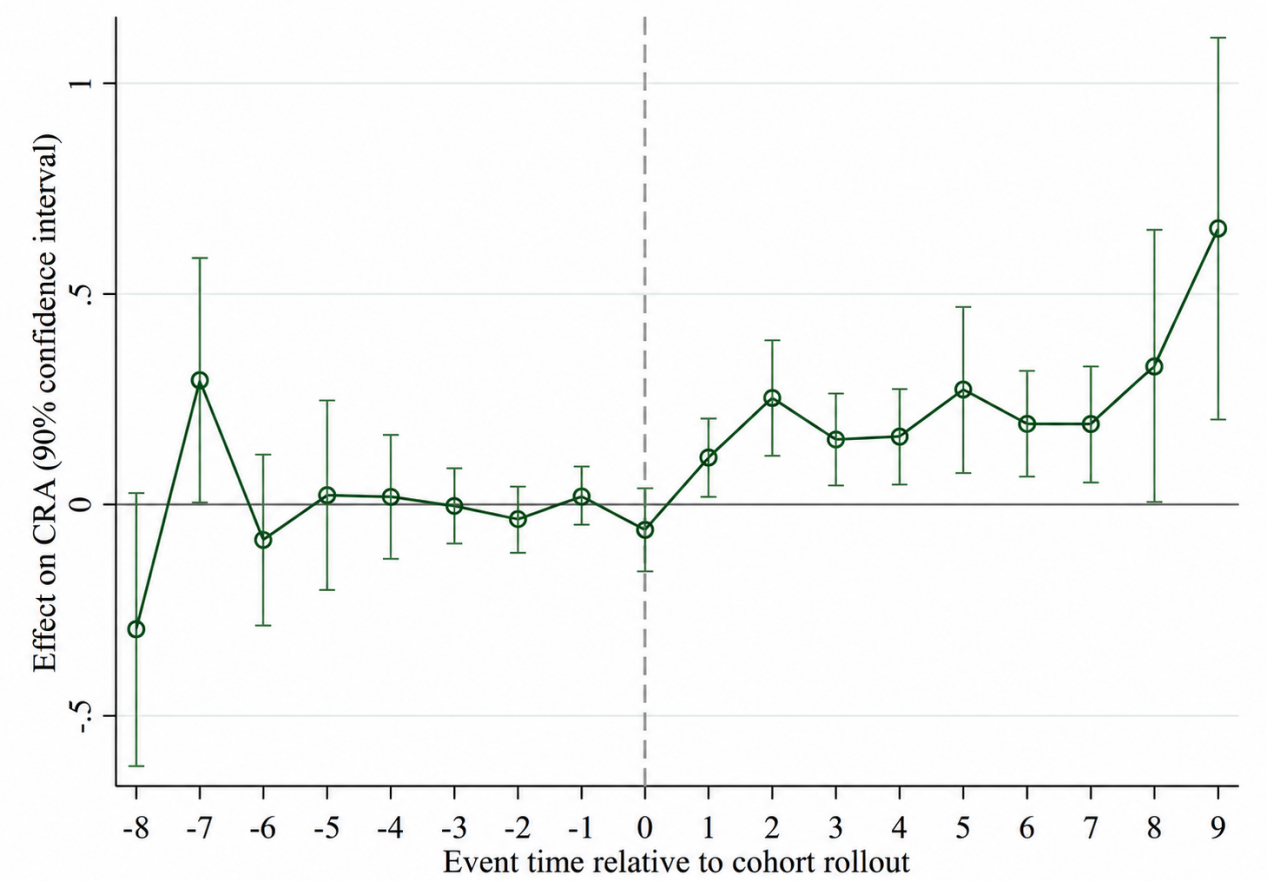
Figure 3. CSDID event-study results. Error bars represent pointwise 90% confidence intervals based on standard errors clustered at the provincial level. CSDID: Callaway and Sant’Anna difference-in-differences estimator, which accommodates staggered policy adoption; CRA: corporate climate-risk absorption capacity.