Figure1
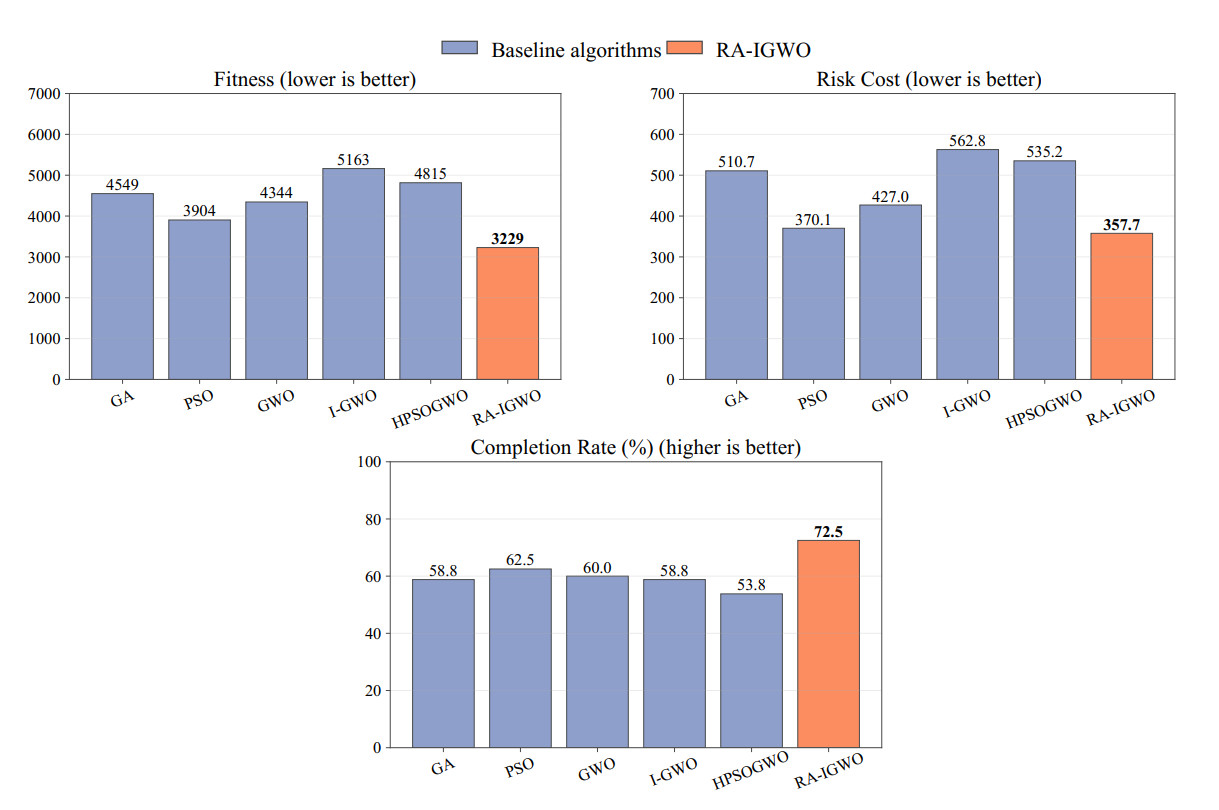
Figure 1. Large-scale representative metric comparison under the shared 4000-NFE budget. Blue bars denote baseline algorithms, and orange bars denote RA-IGWO. Bold value labels denote the best result in each panel, namely the lowest fitness and risk cost and the highest completion rate.