

Figure7
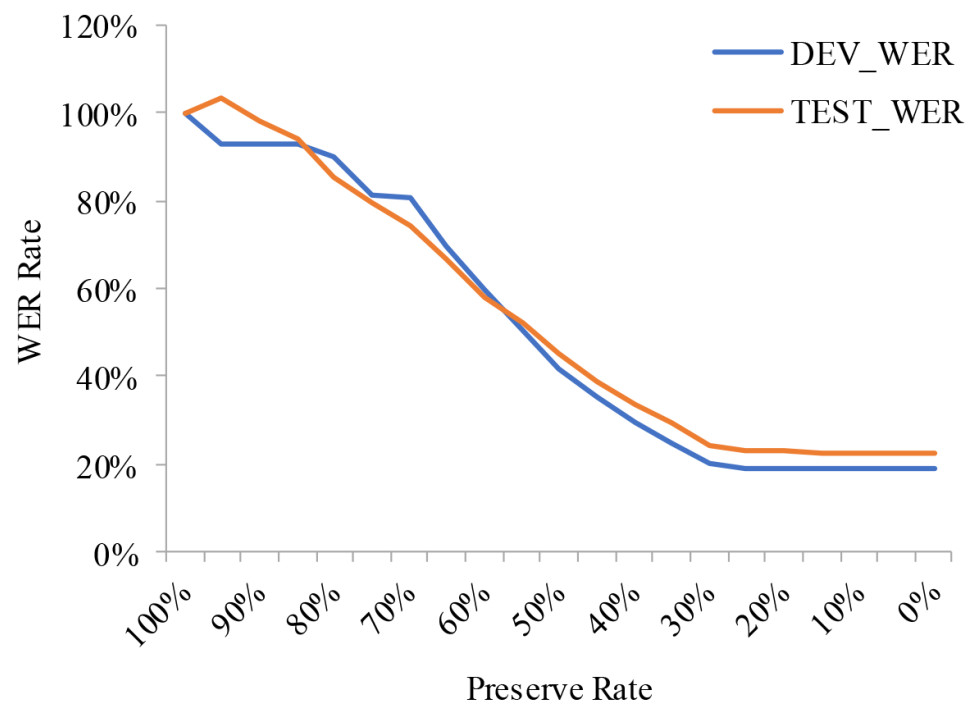
Figure 7. Analysis of Redundancy in Sign Language Videos. The x-axis denotes the proportion of randomly retained image frames from the input sequence, while the y-axis represents the ratio of the WER obtained using the reduced frame set to that obtained using all frames.


