
Figure6
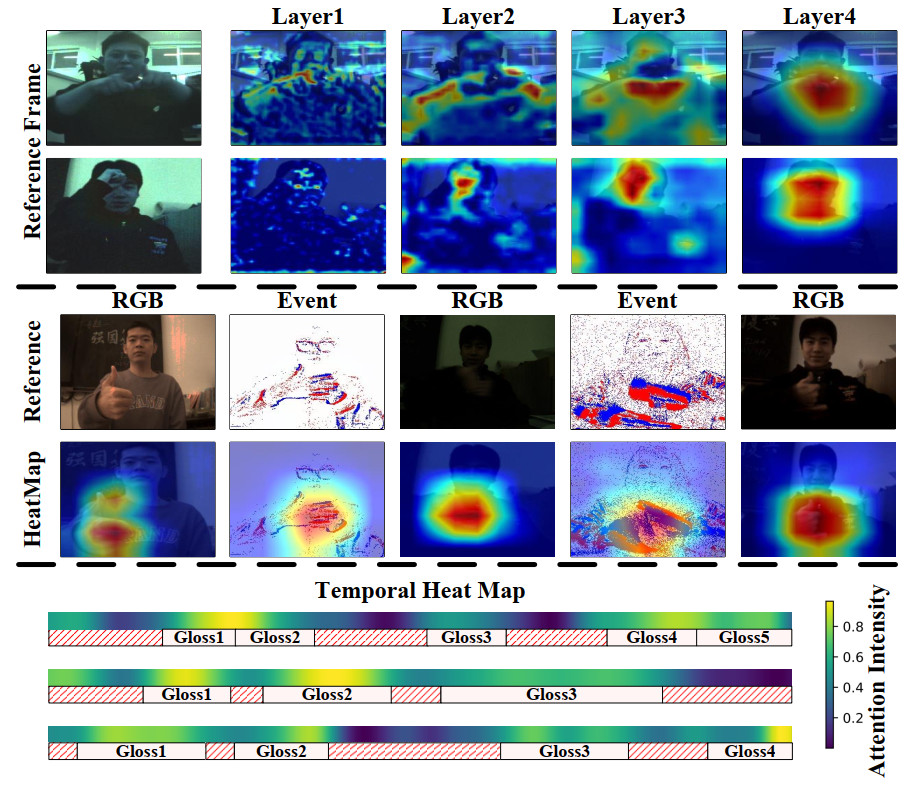
Figure 6. Visualization of feature heatmaps using Grad-CAM[62]. The top panel displays the attention distribution across different layers, the middle panel displays the attention distribution across different modalities, and the bottom panel displays the attention distribution over the temporal dimension. The data used in this figure is obtained from the EvCSLR open-source dataset, which is available at https://github.com/diamondxx/EvCSLR.


