
fig1
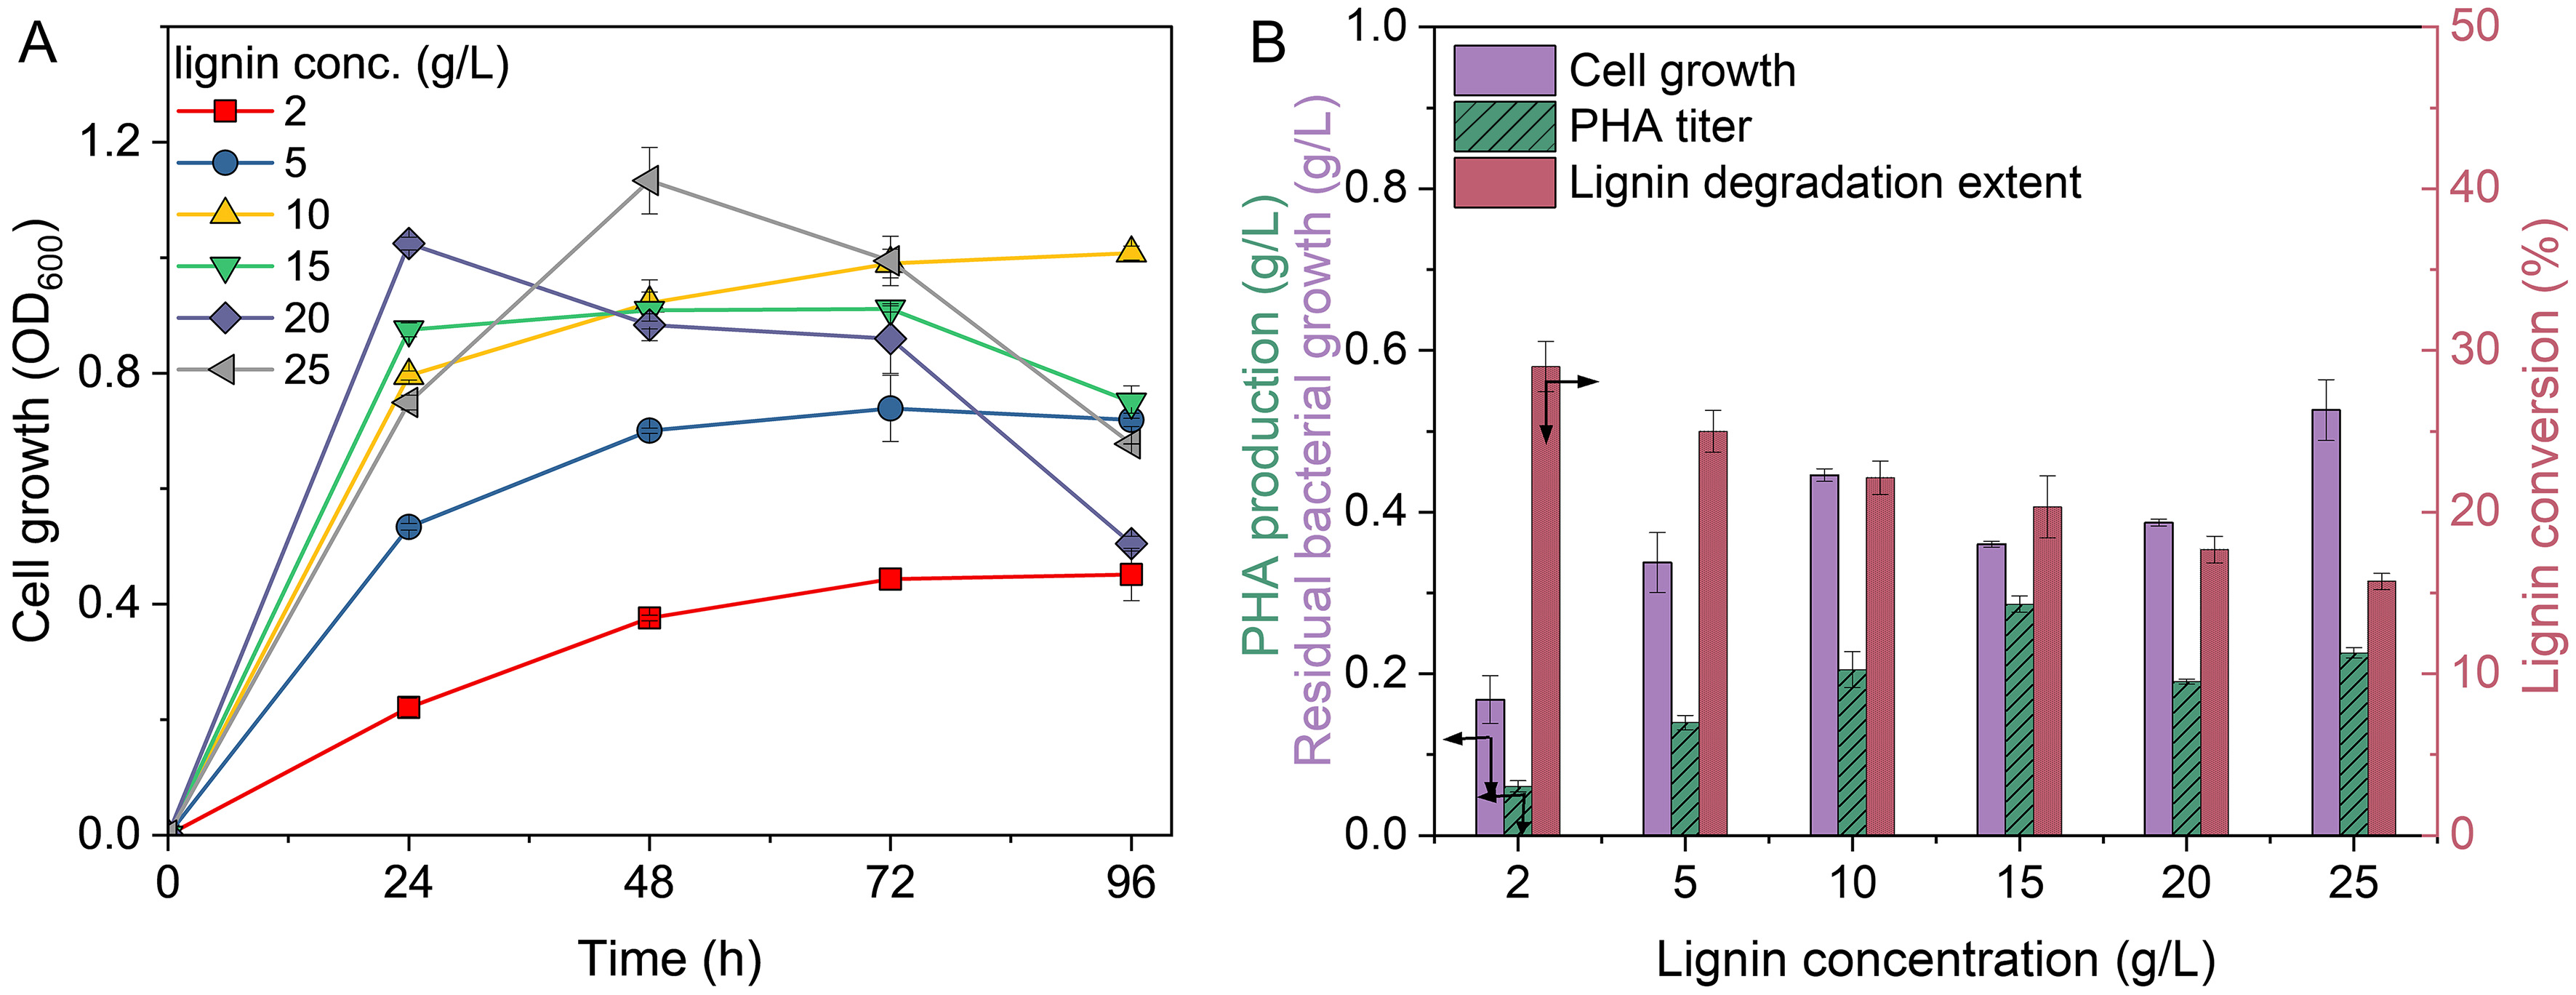
Figure 1. (A) Cell growth and (B) lignin bioconversion at different feeding concentrations (2-25 g/L) using nitrogen-limited strategy. Error bars represent the standard deviation of two replicates (n = 2). OD600: Optical density at 600 nm; lignin conc.: lignin concentration; PHA: polyhydroxyalkanoates.

