


fig6
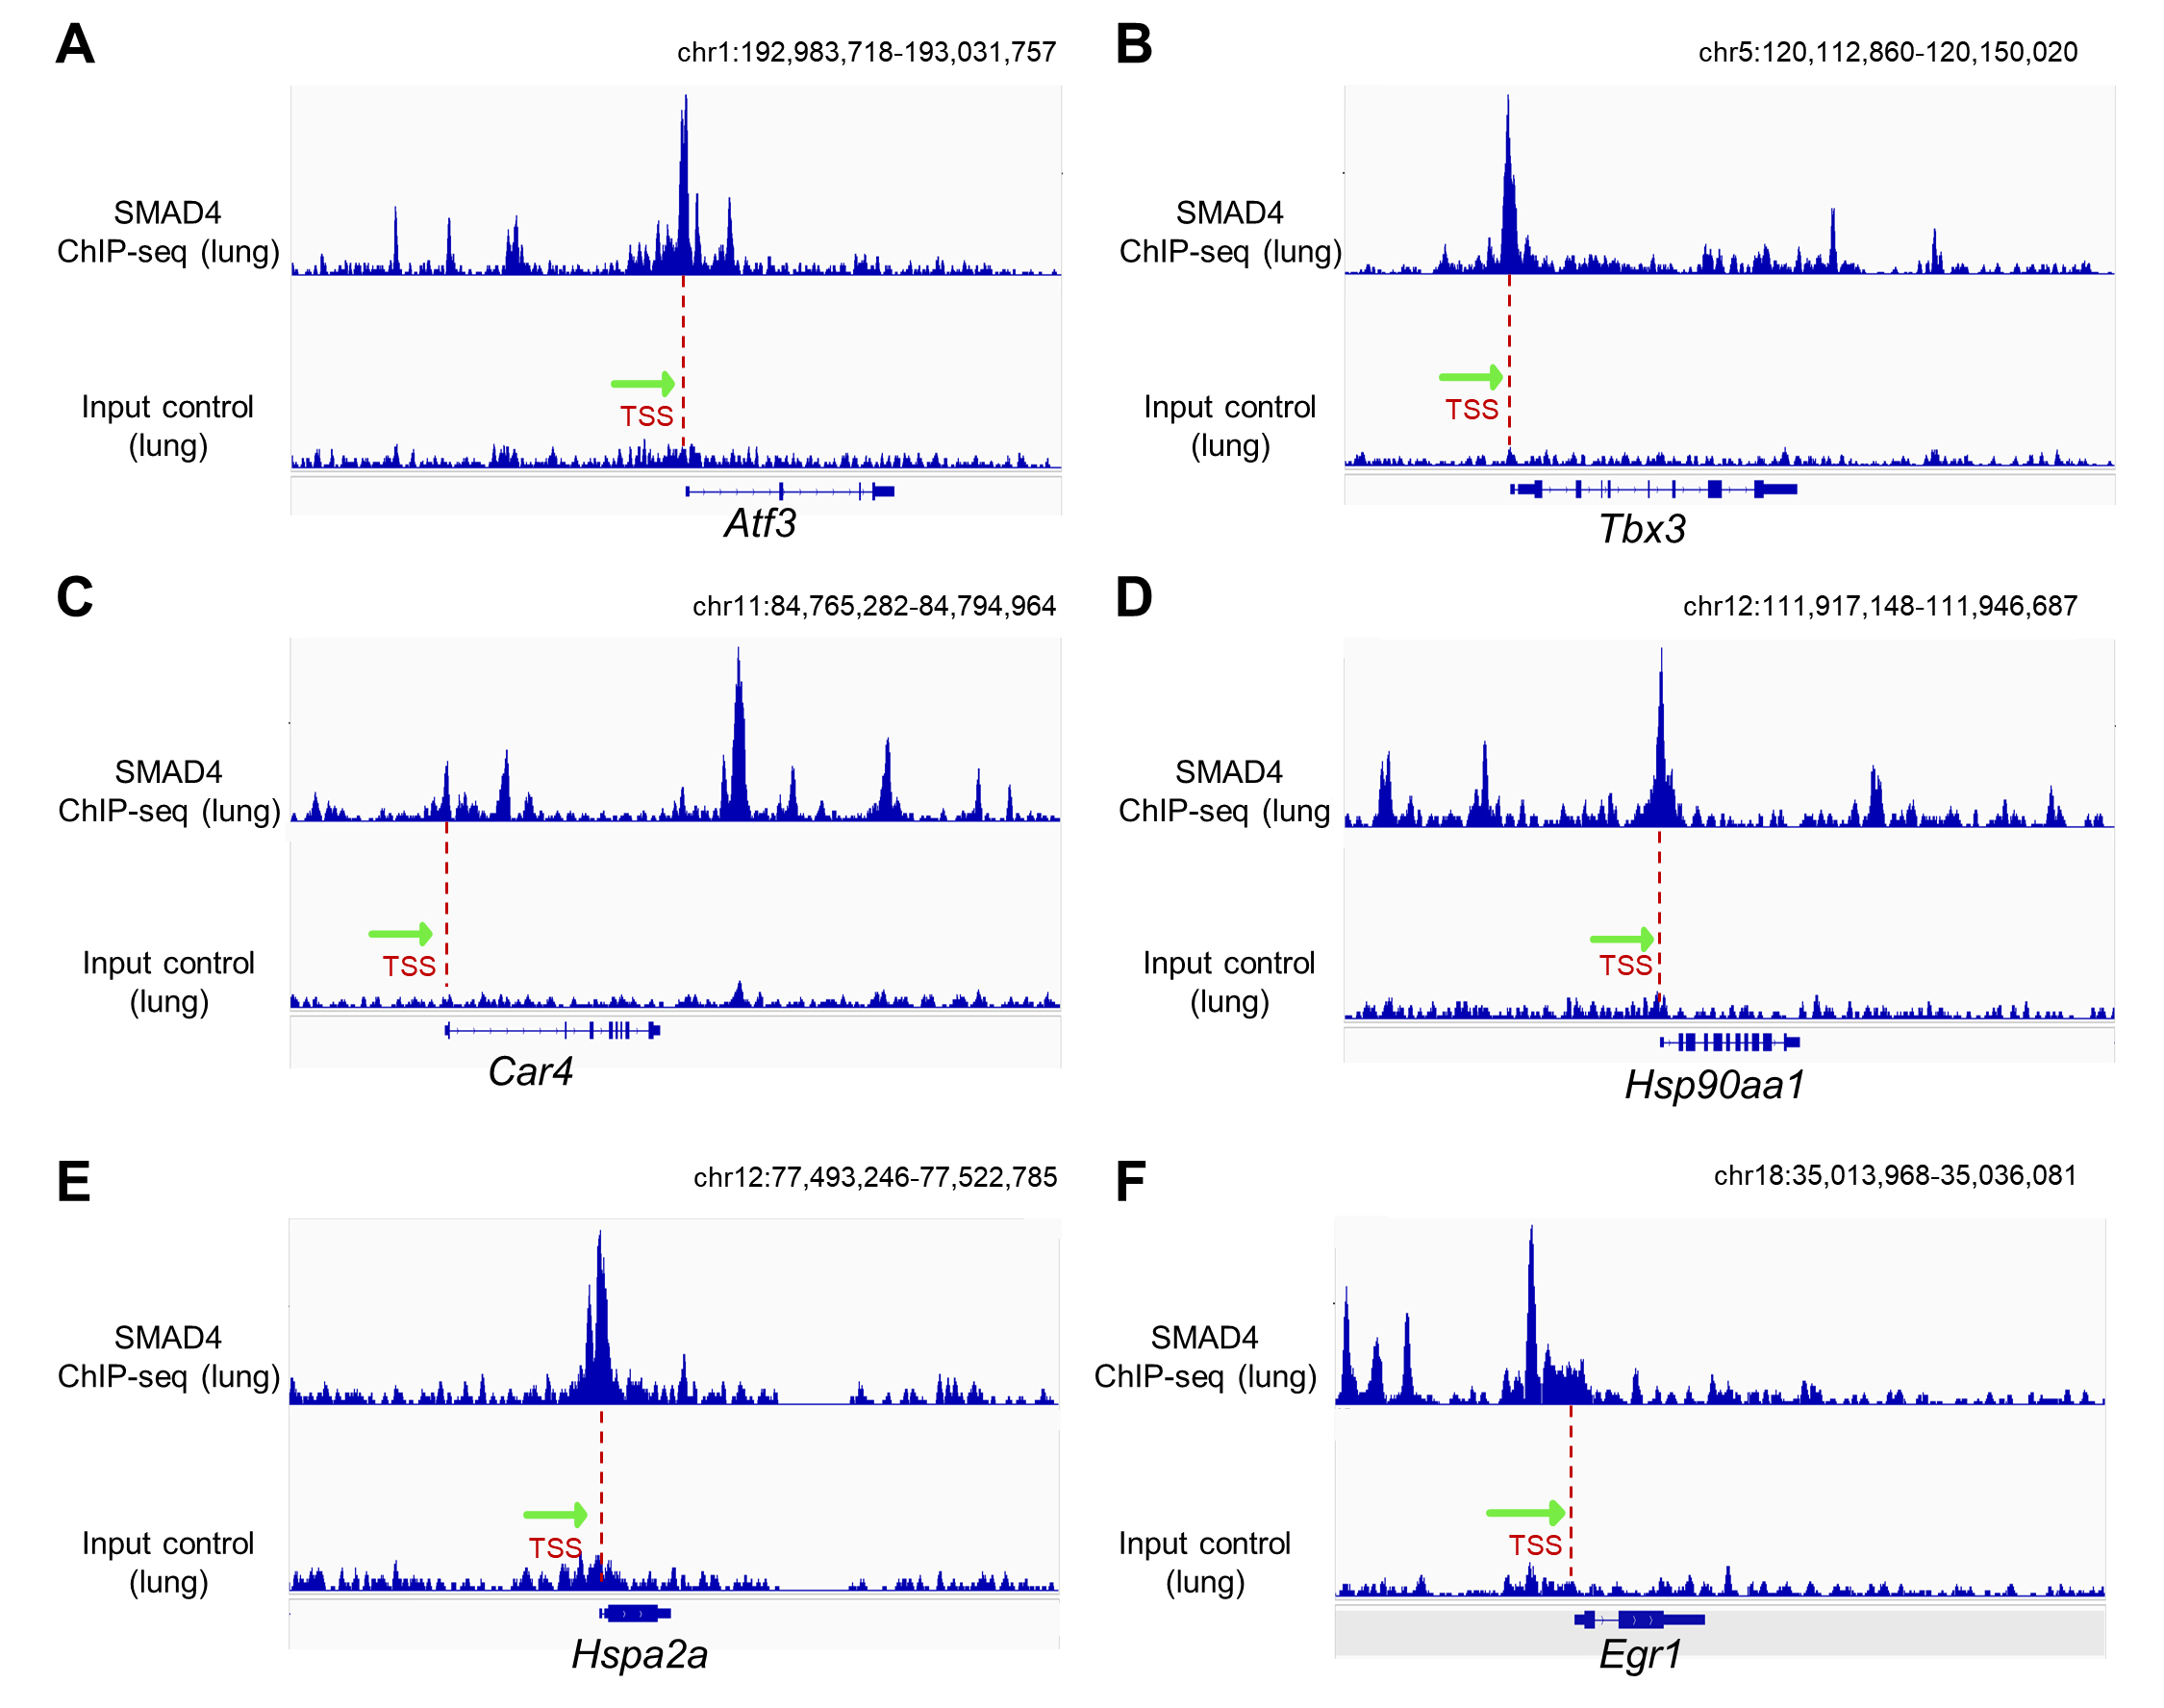
Figure 6. ChIP-seq analysis of potential SMAD4 target genes. (A-F) Bigwig locus tracks of SMAD4 ChIP (top panels) and corresponding input control signals (bottom panels) obtained from mouse lung tissue. SMAD4 binding peaks can be visualized around the transcription start site (TSS) of the Atf3 (A), Tbx3 (B), Car4 (C), Hsp90aa1 (D), Hspa2a (E) and Egr1 (F) locus. Red dashed lines indicate TSSs of the respective gene loci, and green arrows denote the direction of transcription.


