
fig2
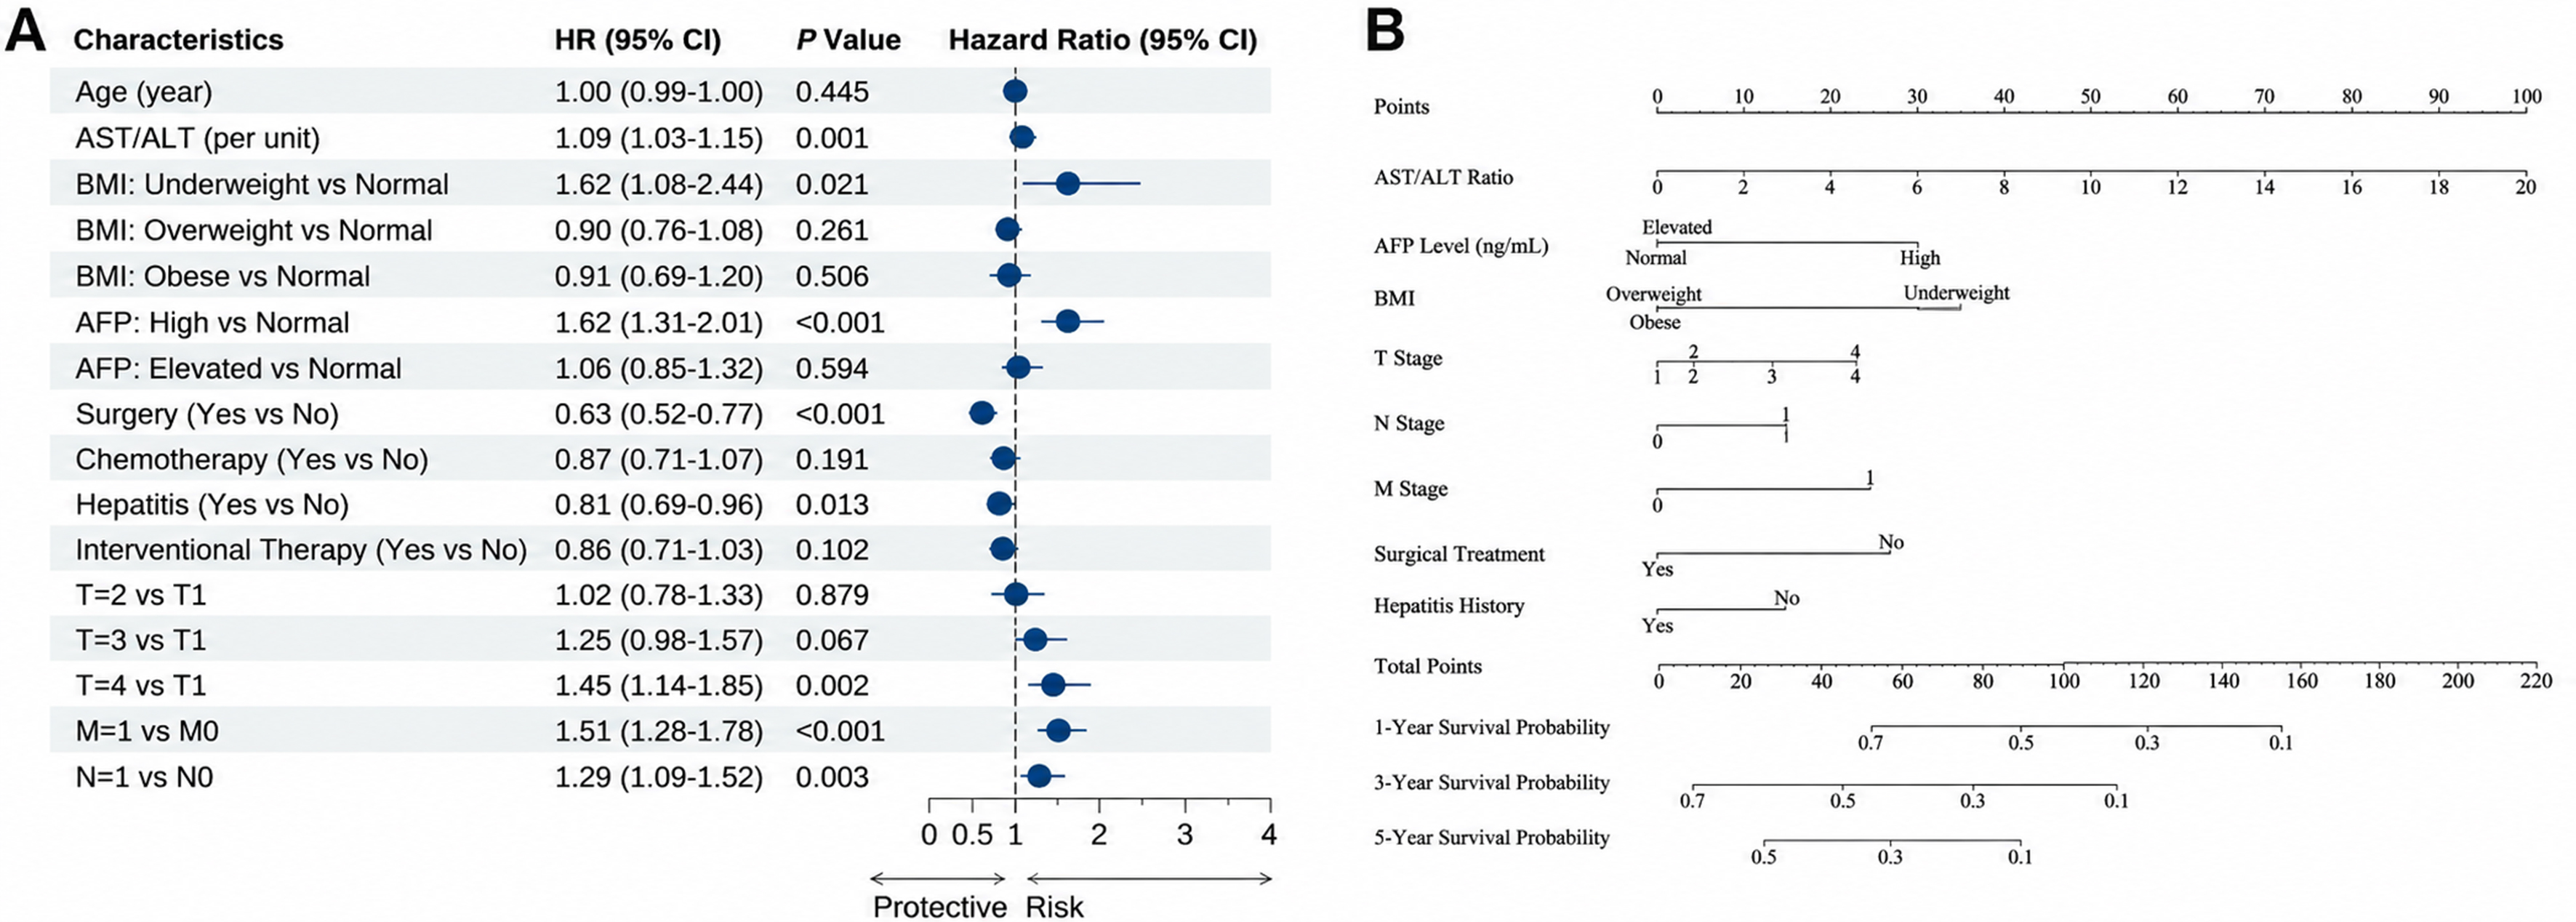
Figure 2. Multivariate Cox regression analysis and the established prognostic nomogram. The panels (A and B) show: (A) Forest plot showing the independent prognostic factors for OS; (B) A nomogram for predicting 1-, 3-, and 5-year OS probabilities, including AST/ALT ratio, AFP level, BMI, T stage, N stage, M stage, surgical treatment, and hepatitis history. The score for each variable is summed to obtain the total points, which correspond to the predicted survival probabilities at the bottom axes. AST/ALT ratio was analyzed as a continuous variable (per unit). BMI was analyzed as a categorical variable (Normal, Underweight, Overweight, Obese). Treatment-related variables were recorded as first-line treatments after diagnosis and included as time-fixed covariates in the post-treatment prognostic model; they should be interpreted as prognostic factors rather than causal factors. HR: Hazard ratio; CI: confidence interval; OS: overall survival; AST: aspartate aminotransferase; ALT: alanine aminotransferase; AFP: alpha-fetoprotein; BMI: body mass index; T stage: primary tumor; N stage: regional lymph node involvement; M stage: distant metastasis.