

Prognostic factors and a Cox proportional hazards model for survival in primary liver cancer
 0
Graphical Abstract
Abstract
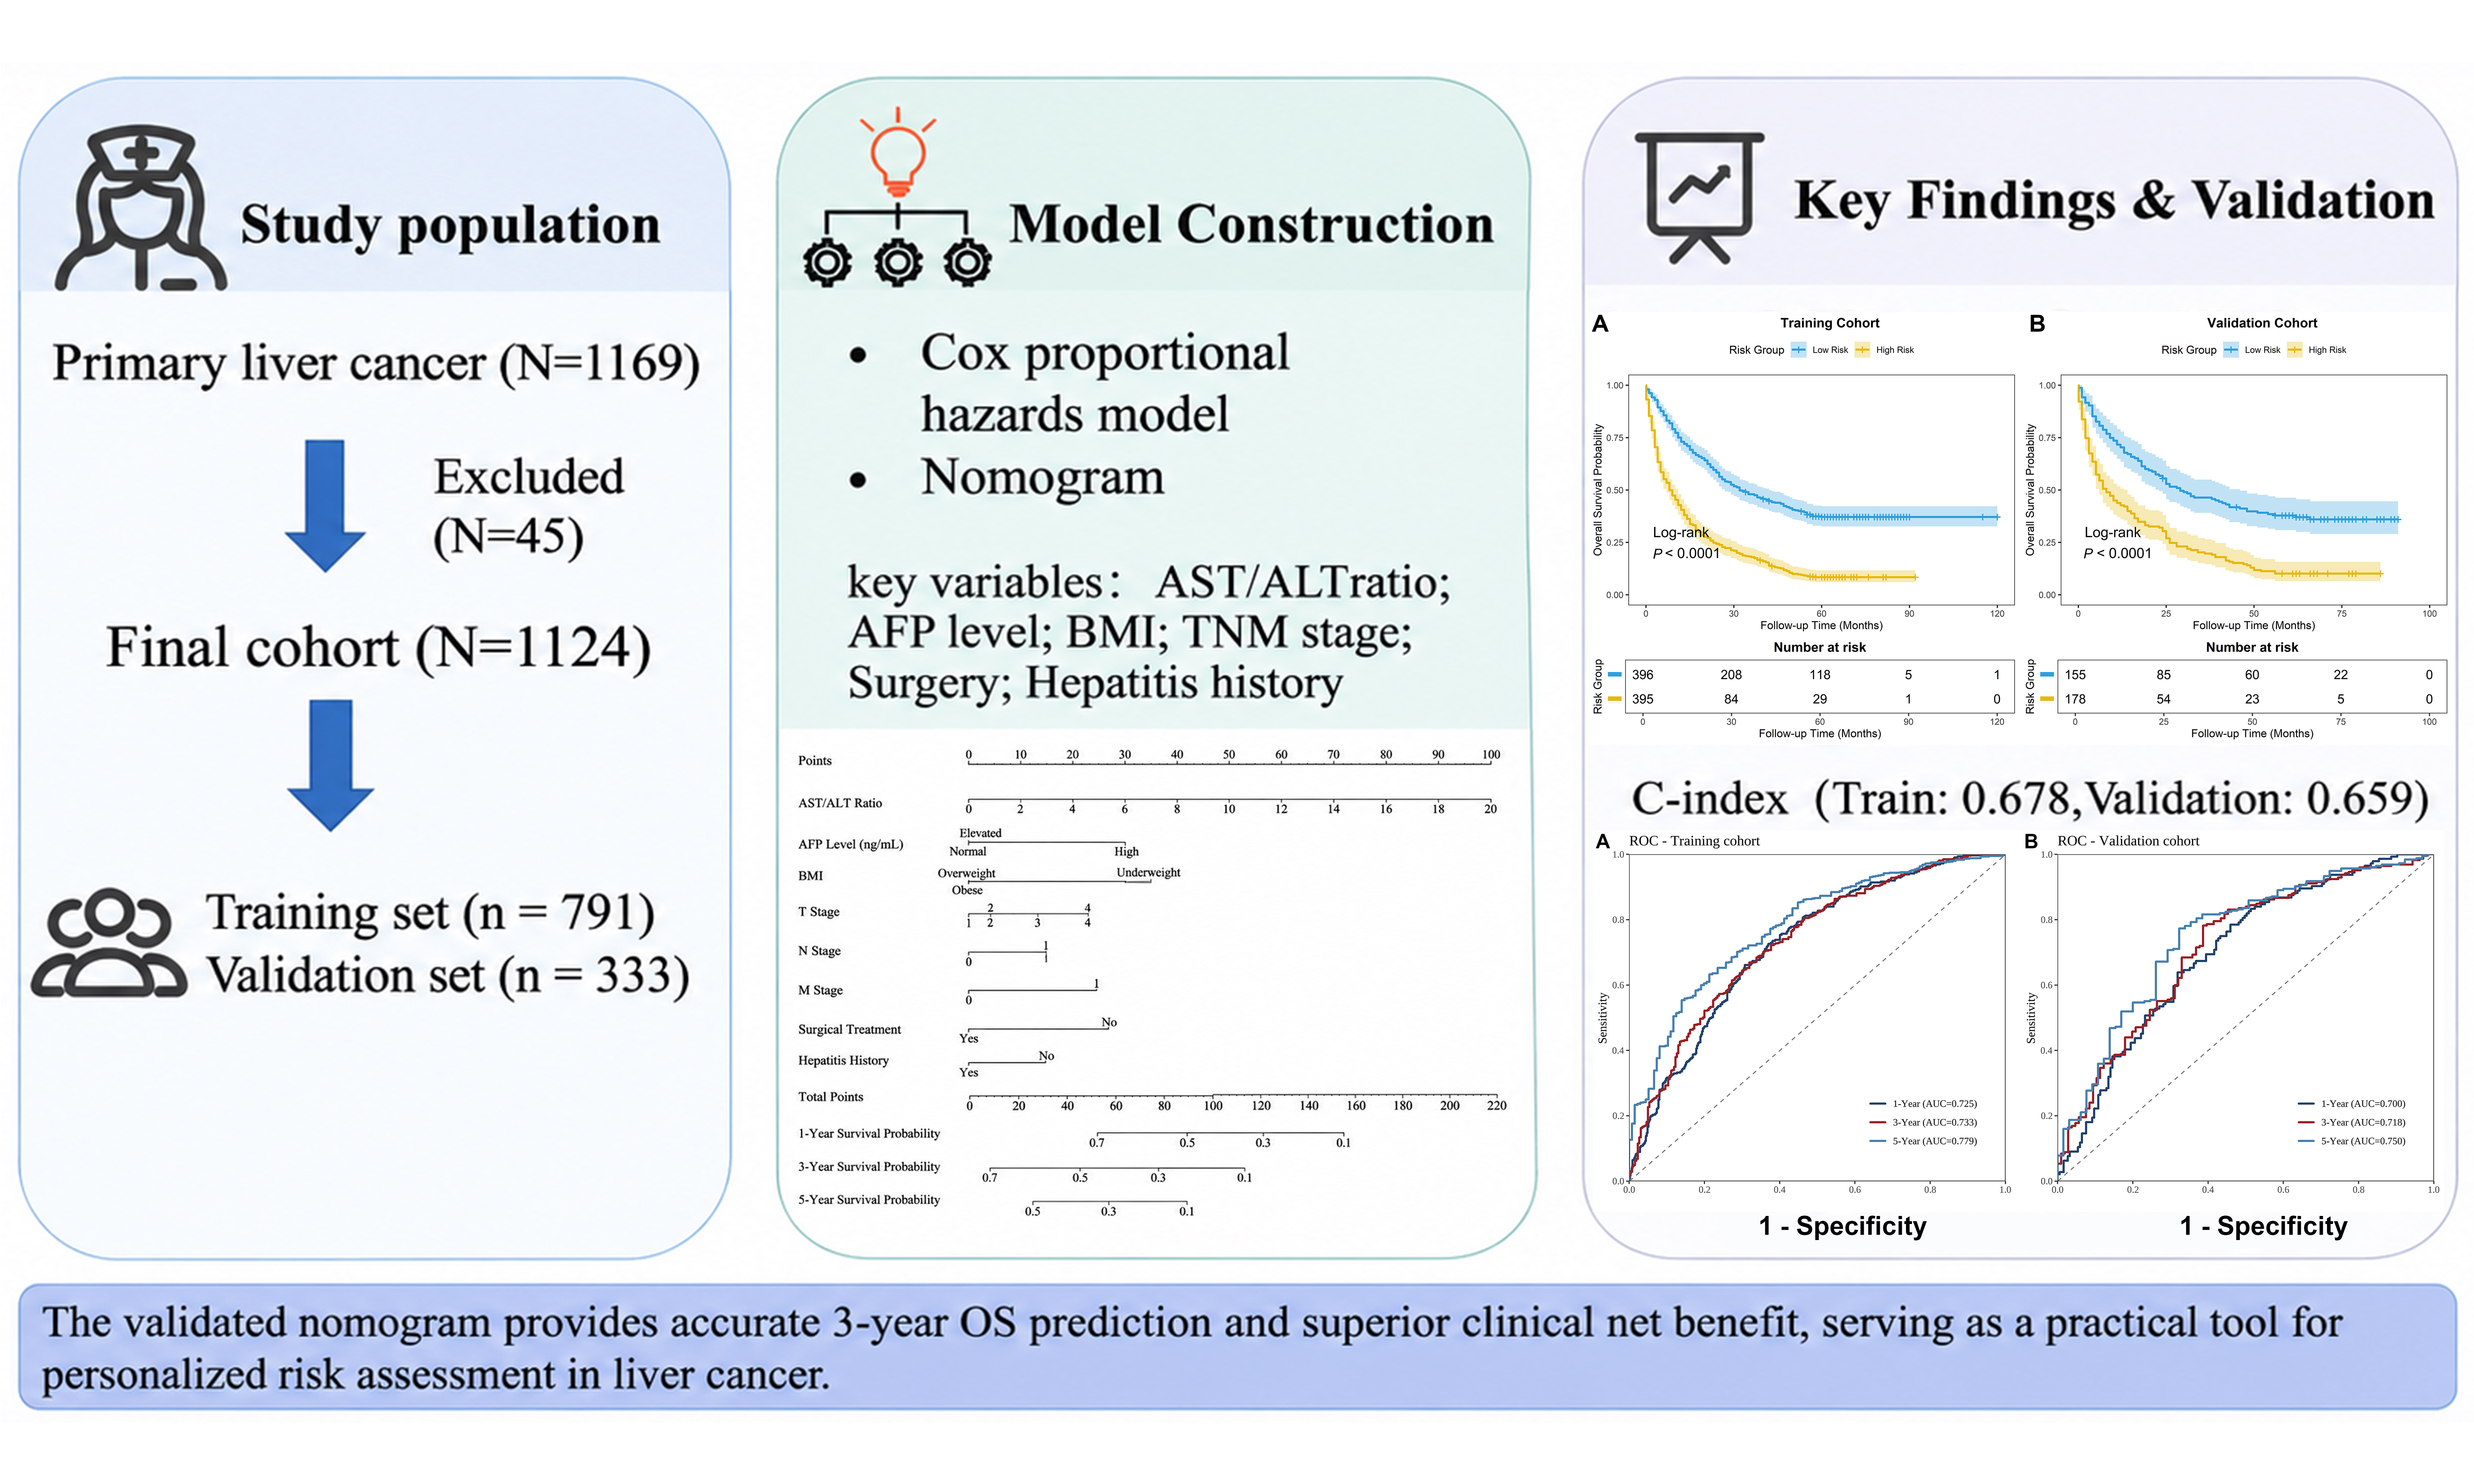
Aim: Accurate prognostic assessment using biochemical indices is essential for personalized management of primary liver cancer in community-level hospitals. This study aimed to construct and validate a Cox regression-based nomogram integrating these indices with clinicopathological data to predict overall survival (OS).
Methods: In this retrospective study, 1,124 patients with primary liver cancer were randomly allocated in a 7:3 proportion into training and validation cohorts. Univariable and multivariate Cox proportional hazards analyses were performed to identify independent prognostic factors and establish a nomogram for predicting OS at 1, 3, and 5 years. The model’s discrimination was assessed via the concordance index (C-index) and time-dependent receiver operating characteristic (ROC) curves. Furthermore, calibration curves and decision curve analysis (DCA) were utilized to evaluate predictive agreement and clinical utility.
Results: Multivariate analysis identified an elevated aspartate aminotransferase/alanine aminotransferase (AST/ALT) ratio, high alpha-fetoprotein (AFP ≥ 400 ng/mL), reduced body mass index (BMI < 18.5 kg/m2), and advanced tumor-node-metastasis (TNM) stage as independent adverse predictors for OS, while surgical resection and hepatitis history favored survival. The nomogram showed moderate discrimination, yielding C-indices of 0.678 (training cohort) and 0.659 (validation cohort), with corresponding areas under the curve (AUCs) for years 1, 3, and 5 of 0.725, 0.733, and 0.779 in the training cohort and 0.700, 0.718, and 0.750 in the validation cohort. Furthermore, the model effectively stratified patients into distinct prognostic risk groups (log-rank test P < 0.001).
Conclusion: This nomogram may assist clinicians in risk stratification and survival estimation for primary liver cancer patients in primary-level healthcare settings.
Keywords


 Download PDF
INTRODUCTION
Globally, liver cancer ranks as the sixth most diagnosed malignancy and represents the third leading contributor to oncological mortality, accounting for approximately 7.8% of total cancer-related fatalities[1]. While worldwide incidence rates have shown periodic fluctuations, the overall count of newly diagnosed patients exhibits a persistent upward trajectory[2]; projections suggest that annual new cases will approach 1.52 million by 2050, representing an approximate two-fold increase relative to figures documented in 2022[3]. In China, the cancer burden has grown, partly because of population growth and aging. In 2021, China’s age-standardized mortality rate (ASMR) reached 17.95 per 100,000 individuals, substantially exceeding the international benchmark of 8.7 per 100,000[4,5]. Furthermore, notable domestic regional variations exist, with rural populations experiencing higher morbidity and mortality compared to urban residents[6-8]. Higher hepatitis B virus (HBV) prevalence and environmental exposures in rural areas may contribute to this disparity, as may limited access to advanced diagnostic services[9]. These disparities underscore the need for prognostic tools based on readily available clinical and biochemical indicators that primary care providers can use at relatively low cost. Despite therapeutic and diagnostic innovations, long-term survival for individuals with primary liver cancer remains unsatisfactory[10]. This unfavorable prognosis stems largely from pronounced biological heterogeneity, infrequent detection at early stages, and high rates of post-surgical recurrence.
Currently, the Barcelona Clinic Liver Cancer (BCLC) system serves as the primary staging framework for managing hepatocellular carcinoma (HCC) - the predominant histological subtype of liver cancer[11]. However, the BCLC classification has limitations in clinical practice, particularly the high heterogeneity of patients within stages B and C. Patients within the same stage can differ markedly in tumor burden, liver function, and survival, limiting individualized prognostic assessment[12]. Additionally, although the tumor-node-metastasis (TNM) staging system effectively evaluates anatomical tumor burden, it does not fully capture factors relevant to treatment decisions or individual prognosis[13]. To address the limitations of conventional staging systems, models that integrate multiple clinical variables have been developed. Both tumor burden and host functional reserve influence prognosis in liver cancer. Survival analysis commonly uses Cox proportional hazards modeling to evaluate multiple patient variables simultaneously[14,15].
Using this framework, this study combined routinely measured clinicopathological parameters to build a survival model for primary liver cancer. The goal was to provide primary care clinicians with a practical tool to support risk stratification, especially in settings with limited access to specialized diagnostics.
METHODS
In this retrospective, population-based cohort design, patient records were derived from the Hebei Provincial Cancer Registry. The registry covers 11 prefecture-level cities and 2 provincially administered county-level cities in Hebei Province, and its cancer registries cover all counties and districts in the province. Patients diagnosed with primary liver cancer from January 2012 through December 2018 were included. Because specific histological variants - namely HCC, intrahepatic cholangiocarcinoma (ICC), and combined hepatocellular-cholangiocarcinoma (cHCC-CCA) - were not systematically documented in the registry, all eligible cases of primary liver cancer were evaluated as a combined cohort. The following conditions were required for enrollment: (1) a definitive diagnosis of primary liver cancer, confirmed pathologically or according to accepted clinical criteria; (2) age ≥ 18 years; (3) treatment-naive status, defined as no prior antineoplastic therapy for the current primary liver cancer; and (4) available survival data. The exclusion criteria comprised: (1) missing survival information or lacking vital follow-up records; and (2) concurrent active malignancy, or a history of another malignancy without documented clinical cure. Ethical approval for this study was granted by the Medical Ethics Committee of The Fourth Hospital of Hebei Medical University (approval No. 2026KS121). The requirement for informed consent was waived by the committee because of the retrospective nature of the study.
The primary outcome measure was overall survival (OS), calculated from the date of diagnosis until death from any cause; surviving individuals were censored at the final follow-up visit. Follow-up concluded in December 2023. Variables incorporated into the analysis encompassed demographic characteristics, laboratory parameters, tumor-related indicators, and therapeutic interventions. Cirrhosis, vascular invasion, tumor burden (size and count), Child-Pugh score, albumin-bilirubin (ALBI) grade, and Eastern Cooperative Oncology Group (ECOG) performance status were not routinely recorded and thus could not be included in the analysis. These factors are clinically important for prognosis in liver cancer, and their omission might restrict the model’s prognostic accuracy.
Demographic variables encompassed age, sex, body weight, height, smoking history, hepatitis history, alcohol consumption history, and family history of malignancy among first-degree relatives. Alcohol consumption history was categorized as never, former, or current drinking. Detailed information on drinking duration and average daily alcohol intake was not uniformly recorded. Hepatitis history was defined as a documented history of chronic HBV or hepatitis C virus (HCV) infection. Because detailed information on other underlying hepatic conditions [such as metabolic dysfunction-associated steatohepatitis (MASH)] was not uniformly recorded, these conditions were not included in the definition of hepatitis history. Family history was defined as any documented malignancy in first-degree relatives, including parents, siblings, and offspring. Body mass index (BMI) was computed by dividing weight in kilograms by the kg/m2. Based on previous literature[16], BMI was stratified into four tiers: < 18.5 kg/m2 (underweight), 18.5-23.9 kg/m2 (normal range), 24.0-27.9 kg/m2 (overweight), and
Missing data were minimal, with less than 5% missing values for all variables. Complete-case analysis was therefore used, and no imputation was performed. The distributions of continuous variables were assessed, and log transformation was applied where appropriate. Using a 7:3 allocation ratio, the complete dataset was randomly partitioned into training and validation cohorts. Derivation procedures - including variable selection and data preprocessing - were confined exclusively to the training cohort, with the finalized model subsequently assessed in the validation set. For bootstrap internal validation, the entire modeling procedure was repeated within each bootstrap sample.
All statistical computations were executed in R software (4.4.3). Survival distributions were generated via Kaplan-Meier analysis and compared through the log-rank test. Candidate predictors were initially screened using univariable Cox regression. Parameters exhibiting P < 0.1 were subsequently incorporated into multivariable Cox proportional hazards modeling; BMI was retained a priori owing to its recognized clinical importance in liver cancer. Effect estimates for multivariable model covariates were reported as hazard ratios (HRs) with corresponding 95% confidence intervals (CIs).
Forest plots summarized the multivariable results, and a prognostic nomogram was established to estimate
Verification of the proportional hazards (PH) assumption was performed via Schoenfeld residual analysis. A residual test P-value < 0.05 indicated violation of the PH assumption for the corresponding covariate. Absolute calibration was quantitatively evaluated at 1, 3, and 5 years using the mean absolute error (MAE) derived from the Integrated Calibration Index (ICI) across 500 bootstrap iterations. Model robustness was evaluated through five distinct sensitivity analyses: (1) a cluster-robust variance model; (2) a stratified Cox model with the three most severely violating variables (tumor location, interventional therapy, and surgery) as stratification factors; (3) a parametric Weibull Accelerated Failure Time (AFT) model, which relaxes the PH assumption, to assess the stability of individual survival predictions against the Cox model; (4) bootstrap internal validation with 500 resamples, reporting both the apparent and optimism-corrected C-indices (calculated by deducting the average bootstrap optimism from the apparent estimate); and (5) split-sample validation using the independent validation cohort. Statistical significance was defined as a two-tailed P-value < 0.05 across all analyses.
RESULTS
Prognostic factor analysis
Altogether 1,124 primary liver cancer patients fulfilling the eligibility criteria were assigned in a 7:3 proportion into a training cohort (n = 791) and a validation cohort (n = 333). Patients’ characteristics between the training and validation cohorts were comparable across baseline parameters [Table 1], including demographic, clinicopathological, and treatment-related variables, including age, BMI, sex, TNM stage, AFP levels, AST/ALT ratio, and therapeutic modalities. In this registry cohort, 5-year OS was 22.8% and 22.9% for the training and validation groups, respectively.
Baseline characteristics of patients
| Variables | Level | Training cohort (n = 791) | Validation cohort (n = 333) | P |
| Age (years), mean ± SD | 57.84 ± 10.26 | 58.31 ± 9.95 | 0.485 | |
| BMI, n (%) | Underweight | 31 (3.9) | 10 (3.0) | 0.250 |
| Normal | 379 (47.9) | 180 (54.1) | ||
| Overweight | 293 (37.0) | 106 (31.8) | ||
| Obese | 88 (11.1) | 37 (11.1) | ||
| Gender, n (%) | Male | 630 (79.6) | 274 (82.3) | 0.350 |
| Female | 161 (20.4) | 59 (17.7) | ||
| Smoking history, n (%) | Never | 371 (46.9) | 167 (50.2) | 0.551 |
| Current | 294 (37.2) | 113 (33.9) | ||
| Former | 126 (15.9) | 53 (15.9) | ||
| Alcohol consumption history, n (%) | Never | 417 (52.7) | 179 (53.8) | 0.707 |
| Current | 323 (40.8) | 129 (38.7) | ||
| Former | 51 (6.4) | 25 (7.5) | ||
| Hepatitis history, n (%) | No | 358 (45.3) | 150 (45.0) | 1.000 |
| Yes | 433 (54.7) | 183 (55.0) | ||
| Family history, n (%) | No | 703 (88.9) | 288 (86.5) | 0.303 |
| Yes | 88 (11.1) | 45 (13.5) | ||
| Tumor location, n (%) | Left lobe | 162 (20.5) | 79 (23.7) | 0.101 |
| Right lobe | 461 (58.3) | 171 (51.4) | ||
| Bilobar | 168 (21.2) | 83 (24.9) | ||
| T stage, n (%) | T1 | 191 (24.1) | 81 (24.3) | 1.000 |
| T2 | 155 (19.6) | 65 (19.5) | ||
| T3 | 248 (31.4) | 104 (31.2) | ||
| T4 | 197 (24.9) | 83 (24.9) | ||
| N stage, n (%) | N0 | 415 (52.5) | 156 (46.8) | 0.098 |
| N1 | 376 (47.5) | 177 (53.2) | ||
| M stage, n (%) | M0 | 426 (53.9) | 186 (55.9) | 0.583 |
| M1 | 365 (46.1) | 147 (44.1) | ||
| AFP, n (%) | Normal | 225 (28.4) | 85 (25.5) | 0.561 |
| Elevated | 264 (33.4) | 112 (33.6) | ||
| High | 302 (38.2) | 136 (40.8) | ||
| AST/ALT ratio, mean ± SD | 1.40 ± 1.24 | 1.41 ± 1.09 | 0.988 | |
| Surgery, n (%) | No | 534 (67.5) | 234 (70.3) | 0.402 |
| Yes | 257 (32.5) | 99 (29.7) | ||
| Chemotherapy, n (%) | No | 535 (67.6) | 212 (63.7) | 0.223 |
| Yes | 256 (32.4) | 121 (36.3) | ||
| Interventional therapy, n (%) | No | 341 (43.1) | 145 (43.5) | 0.946 |
| Yes | 450 (56.9) | 188 (56.5) | ||
| 1-year survival rate, % (95%CI) | 56.8 (53.4-60.3) | 55.6 (50.5-61.2) | ||
| 3-year survival rate, % (95%CI) | 33.0 (29.9-36.4) | 32.1 (27.4-37.5) | ||
| 5-year survival rate, % (95%CI) | 22.8 (20.0-25.9) | 22.9 (18.8-27.9) |
To examine the associations between clinicopathological features and OS, we performed Kaplan-Meier survival analysis [Figure 1] and univariable Cox regression. In univariable analysis, the AST/ALT ratio (per unit), T3 and T4 vs. T1, N1 vs. N0, M1 vs. M0, and high AFP levels (≥ 400 ng/mL) were each significantly associated with OS (all P < 0.001; Table 2), whereas T2 vs. T1 was not statistically significant (P = 0.088). Conversely, surgical resection, chemotherapy, interventional therapy, and hepatitis history correlated with improved OS (P < 0.05 for all). Age, sex, smoking and alcohol habits, and family history of malignancy showed no significant correlation with OS.
Figure 1. Kaplan-Meier survival curves for OS stratified by clinical characteristics. (A-D) OS curves stratified by clinical characteristics: (A) T stage (T1, T2, T3, T4); (B) N stage (N0 vs. N1); (C) M stage (M0 vs. M1); (D) AFP levels (Normal, Elevated, High). Log-rank tests were used to compare survival differences between groups. The “Number at risk” tables below each plot indicate the number of patients remaining at each time point. AFP: Alpha-fetoprotein; OS: overall survival; T stage: primary tumor; N stage: regional lymph node involvement; M stage: distant metastasis.
Multivariable Cox regression revealed several independent predictors of worse OS. These included the AST/ALT ratio (per unit: HR = 1.09, 95%CI: 1.03-1.15; P = 0.001), underweight status (vs. normal weight: HR = 1.62, 95%CI: 1.08-2.44; P = 0.021), high AFP level (≥ 400 ng/mL vs. normal: HR = 1.62, 95%CI: 1.31-2.01; P < 0.001), and advanced TNM stage (T4: HR = 1.45, 95%CI: 1.14-1.85; N1: HR = 1.29, 95%CI: 1.09-1.52; M1: HR = 1.51, 95%CI: 1.28-1.78; all P < 0.01). Conversely, independent protective factors against mortality included surgical resection (HR = 0.63, 95%CI: 0.52-0.77; P < 0.001) and hepatitis history (HR = 0.81, 95%CI: 0.69-0.96; P = 0.013) [Table 2].
Univariate and multivariate Cox regression analyses
| Variables | Univariate analysis | Multivariate analysis | ||
| HR (95%CI) | P-value | HR (95%CI) | P-value | |
| Age (years) | 0.99 (0.99-1.00) | 0.082 | 1.00 (0.99-1.00) | 0.445 |
| BMI (kg/m2) | ||||
| Normal (Ref.) | 1.00 | - | 1.00 | - |
| Underweight | 1.37 (0.92-2.05) | 0.122 | 1.62 (1.08-2.44) | 0.021 |
| Overweight | 0.91 (0.77-1.09) | 0.312 | 0.90 (0.76-1.08) | 0.261 |
| Obese | 0.88 (0.67-1.15) | 0.343 | 0.91 (0.69-1.20) | 0.506 |
| Hepatitis history | ||||
| No (Ref.) | 1.00 | - | 1.00 | - |
| Yes | 0.79 (0.67-0.92) | 0.003 | 0.81 (0.69-0.96) | 0.013 |
| AST/ALT ratio (per unit) | 1.18 (1.13-1.23) | < 0.001 | 1.09 (1.03-1.15) | 0.001 |
| AFP (ng/mL) | ||||
| Normal (Ref.) | 1.00 | - | 1.00 | - |
| Elevated | 1.07 (0.87-1.33) | 0.519 | 1.06 (0.85-1.32) | 0.594 |
| High | 1.93 (1.58-2.36) | < 0.001 | 1.62 (1.31-2.01) | < 0.001 |
| T stage | ||||
| T1 (Ref.) | 1.00 | - | 1.00 | - |
| T2 | 1.25 (0.97-1.61) | 0.088 | 1.02 (0.78-1.33) | 0.880 |
| T3 | 1.65 (1.32-2.07) | < 0.001 | 1.25 (0.98-1.57) | 0.067 |
| T4 | 1.89 (1.50-2.38) | < 0.001 | 1.45 (1.14-1.85) | 0.002 |
| N stage | ||||
| N0 (Ref.) | 1.00 | - | 1.00 | - |
| N1 | 1.48 (1.26-1.74) | < 0.001 | 1.29 (1.09-1.52) | 0.003 |
| M stage | ||||
| M0 (Ref.) | 1.00 | - | 1.00 | - |
| M1 | 1.75 (1.49-2.06) | < 0.001 | 1.51 (1.28-1.78) | < 0.001 |
| Location | ||||
| Left lobe (Ref.) | 1.00 | - | 1.00 | - |
| Right lobe | 0.83 (0.67-1.01) | 0.065 | 0.85 (0.69-1.05) | 0.129 |
| Bilobar | 1.23 (0.97-1.56) | 0.088 | 0.96 (0.75-1.23) | 0.729 |
| Surgery | ||||
| No (Ref.) | 1.00 | - | 1.00 | - |
| Yes | 0.49 (0.41-0.59) | < 0.001 | 0.63 (0.52-0.77) | < 0.001 |
| Chemotherapy | ||||
| No (Ref.) | 1.00 | - | 1.00 | - |
| Yes | 0.81 (0.69-0.97) | 0.019 | 0.87 (0.71-1.07) | 0.192 |
| Interventional. therapy | ||||
| No (Ref.) | 1.00 | - | 1.00 | - |
| Yes | 0.81 (0.69-0.96) | 0.012 | 0.86 (0.71-1.03) | 0.102 |
Nomogram development and model performance
Using the factors retained in the multivariable model, a prognostic nomogram was established to estimate 1-, 3-, and 5-year OS for primary liver cancer patients, along with the corresponding forest plot [Figure 2]. The model showed moderate discriminative capacity, yielding a C-index of 0.678 for the training cohort and 0.659 for the validation cohort. Time-dependent ROC analysis revealed 1-, 3-, and 5-year OS AUCs of 0.725, 0.733, and 0.779 in the training cohort, alongside 0.700, 0.718, and 0.750 within the validation cohort
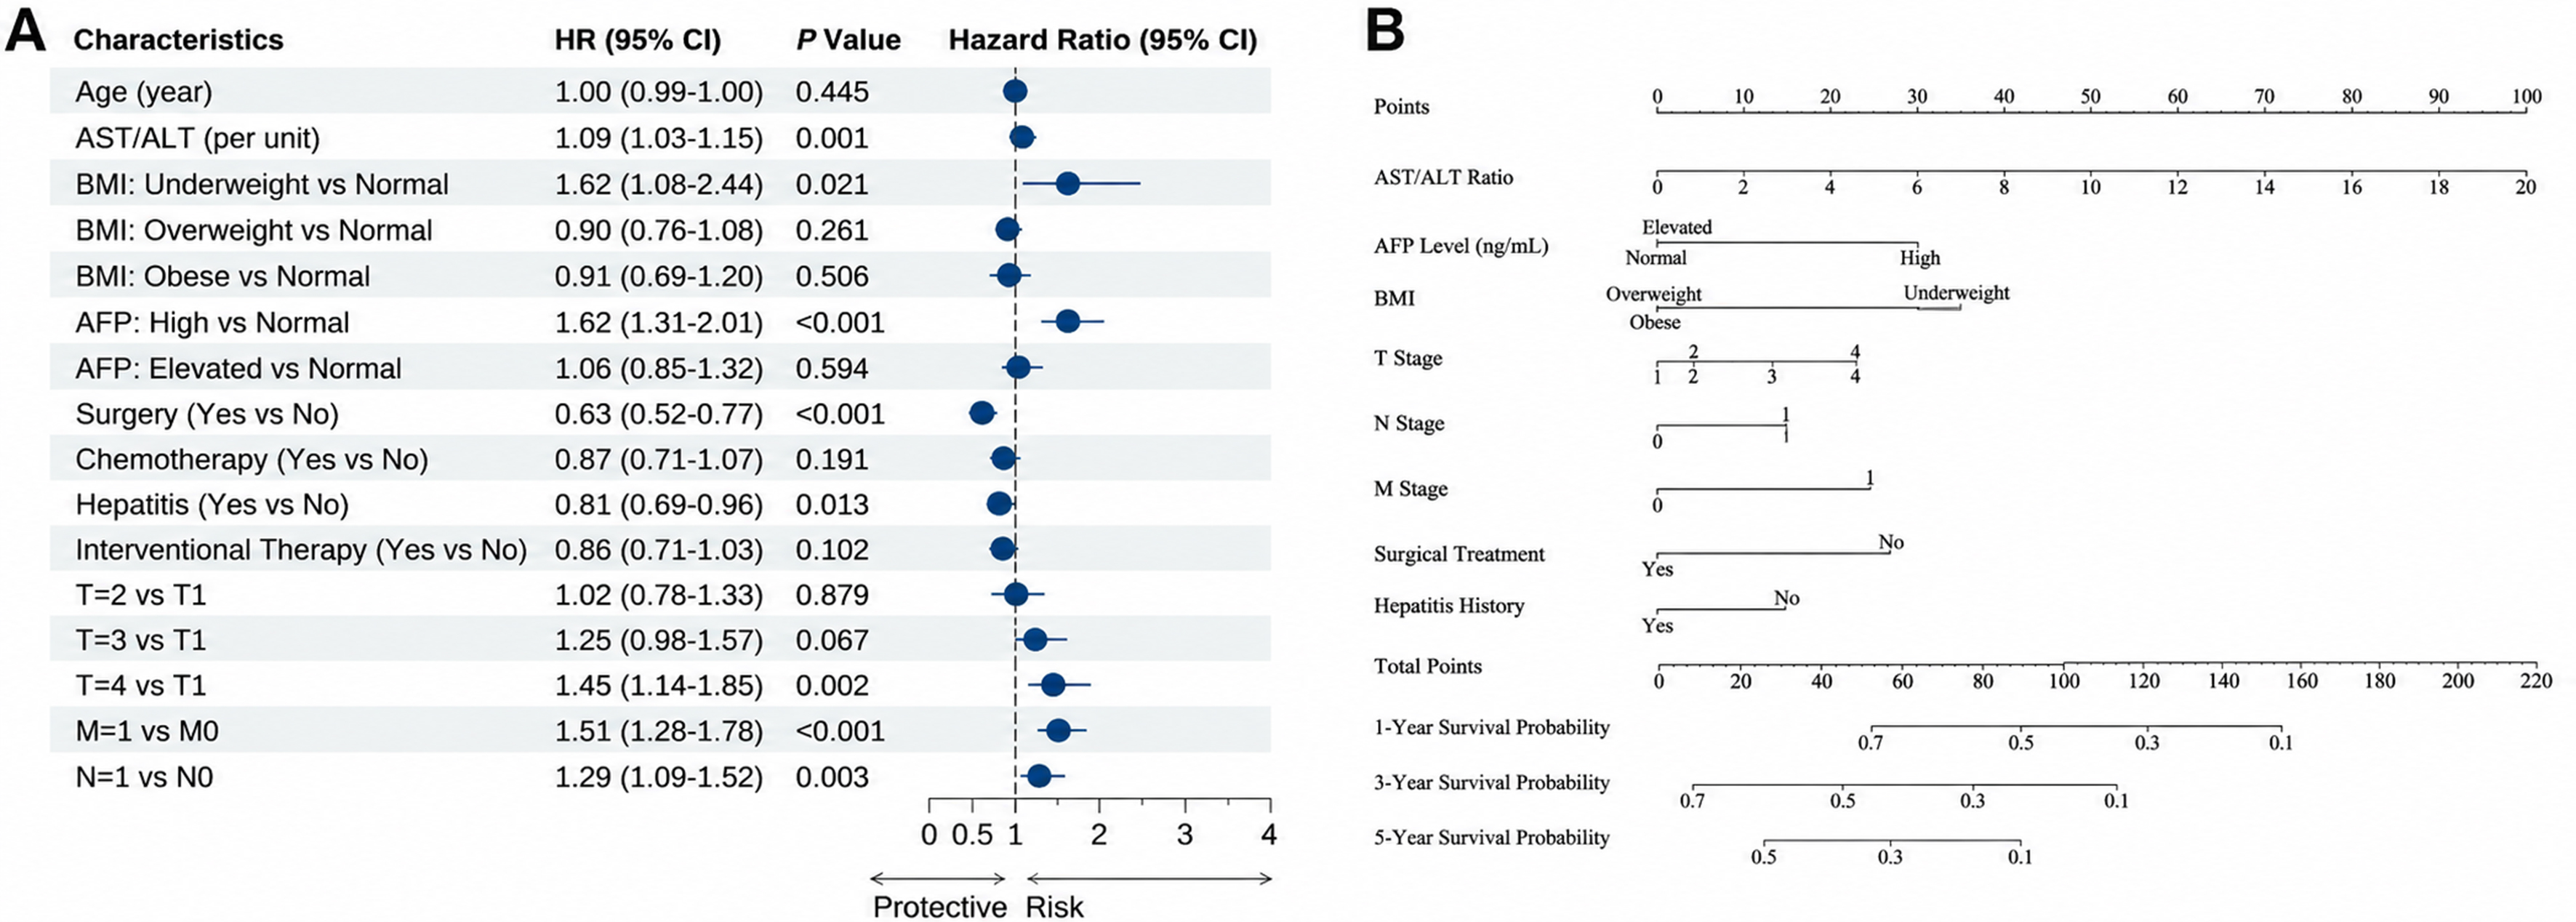
Figure 2. Multivariate Cox regression analysis and the established prognostic nomogram. The panels (A and B) show: (A) Forest plot showing the independent prognostic factors for OS; (B) A nomogram for predicting 1-, 3-, and 5-year OS probabilities, including AST/ALT ratio, AFP level, BMI, T stage, N stage, M stage, surgical treatment, and hepatitis history. The score for each variable is summed to obtain the total points, which correspond to the predicted survival probabilities at the bottom axes. AST/ALT ratio was analyzed as a continuous variable (per unit). BMI was analyzed as a categorical variable (Normal, Underweight, Overweight, Obese). Treatment-related variables were recorded as first-line treatments after diagnosis and included as time-fixed covariates in the post-treatment prognostic model; they should be interpreted as prognostic factors rather than causal factors. HR: Hazard ratio; CI: confidence interval; OS: overall survival; AST: aspartate aminotransferase; ALT: alanine aminotransferase; AFP: alpha-fetoprotein; BMI: body mass index; T stage: primary tumor; N stage: regional lymph node involvement; M stage: distant metastasis.
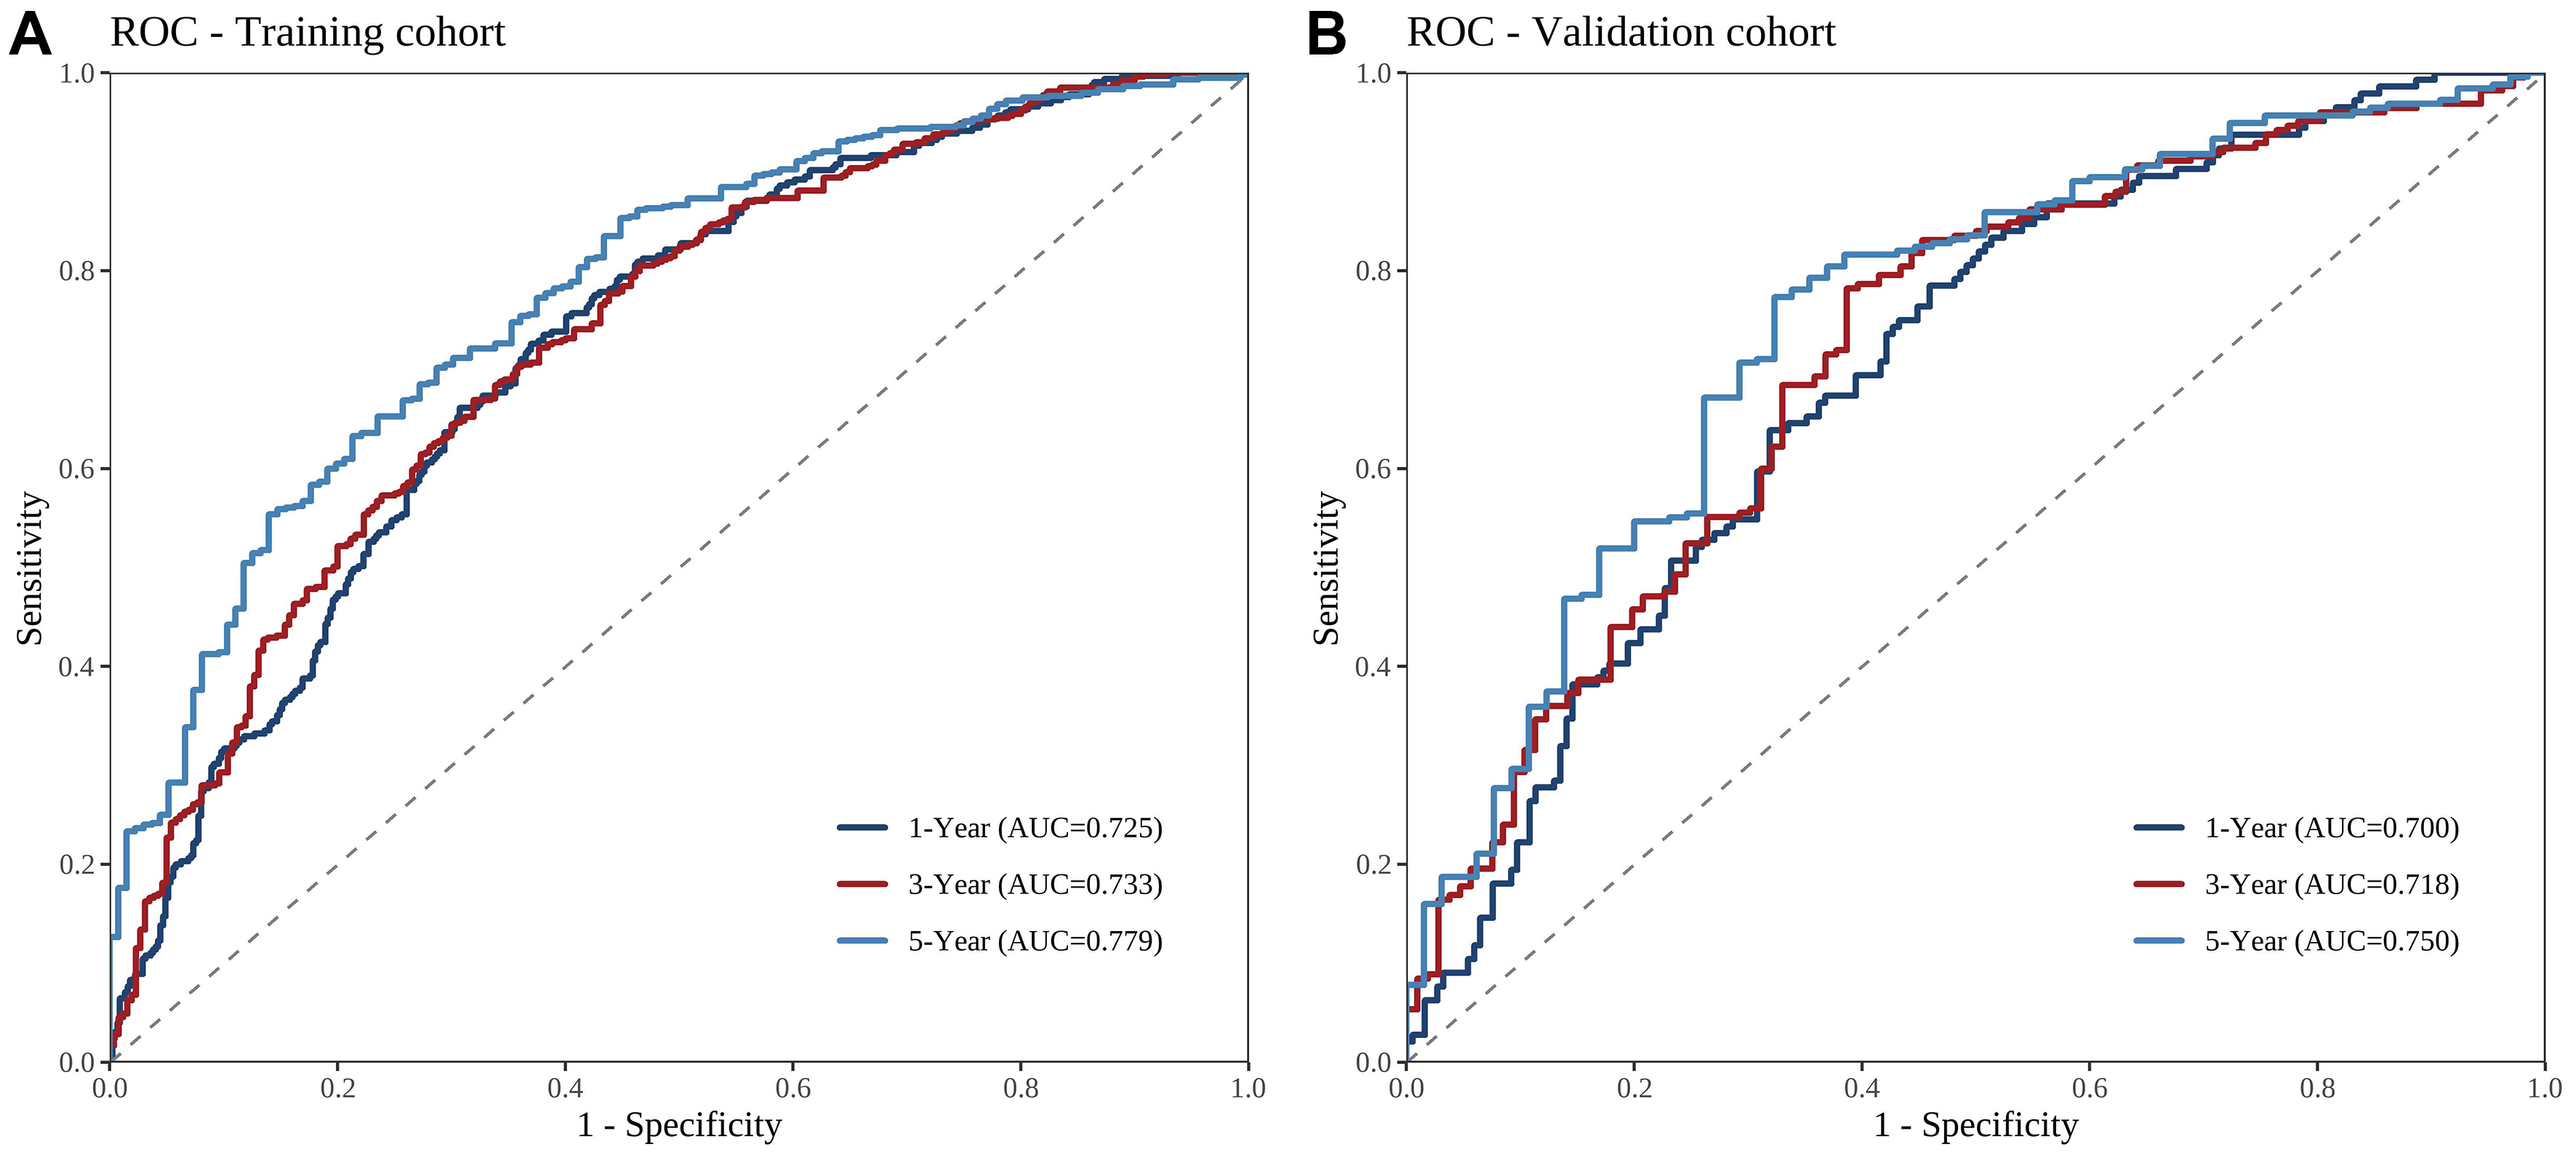
Figure 3. Time-dependent ROC curves of the prognostic model. (A and B) ROC curves were used to evaluate the sensitivity and specificity of the model for predicting 1-, 3-, and 5-year OS: (A) training cohort; (B) validation cohort. AUC values indicate the discriminative performance at each time point. ROC: Receiver operating characteristic; AUC: area under the curve; OS: overall survival.
Figure 4. Calibration curves for predicting 1-, 3-, and 5-year OS. (A-F) Calibration curves for 1-year OS in the training cohort (A) and validation cohort (B); 3-year OS in the training cohort (C) and validation cohort (D); 5-year OS in the training cohort (E) and validation cohort (F). The dashed 45-degree line represents ideal prediction, and the solid line represents the performance of the nomogram. A closer fit to the dashed line indicates better calibration. OS: Overall survival.
Figure 5. DCA for the prognostic nomogram. (A-F) DCA curves for 1-, 3-, and 5-year OS in the training and validation cohorts: 1-year OS in the training cohort (A) and validation cohort (B); 3-year OS in the training cohort (C) and validation cohort (D); 5-year OS in the training cohort (E) and validation cohort (F). The nomogram was compared with the TNM staging system, “Treat All”, and “Treat None” strategies. The Y-axis represents net benefit. The nomogram provided greater net benefit than the TNM staging system for 3- and 5-year OS, while the benefit was comparable or slightly better for 1-year OS. DCA: Decision curve analysis; OS: overall survival; TNM: tumor-node-metastasis.
Risk stratification and survival analysis
Using the median risk score of the training cohort as the cutoff value, patients were separated into low- and high-risk categories; this identical threshold was subsequently implemented in the validation cohort. Kaplan-Meier curves demonstrated significantly reduced OS for high-risk patients compared with low-risk counterparts across both cohorts (log-rank P < 0.001; Figure 6), confirming the model’s capacity to discriminate patient risk.
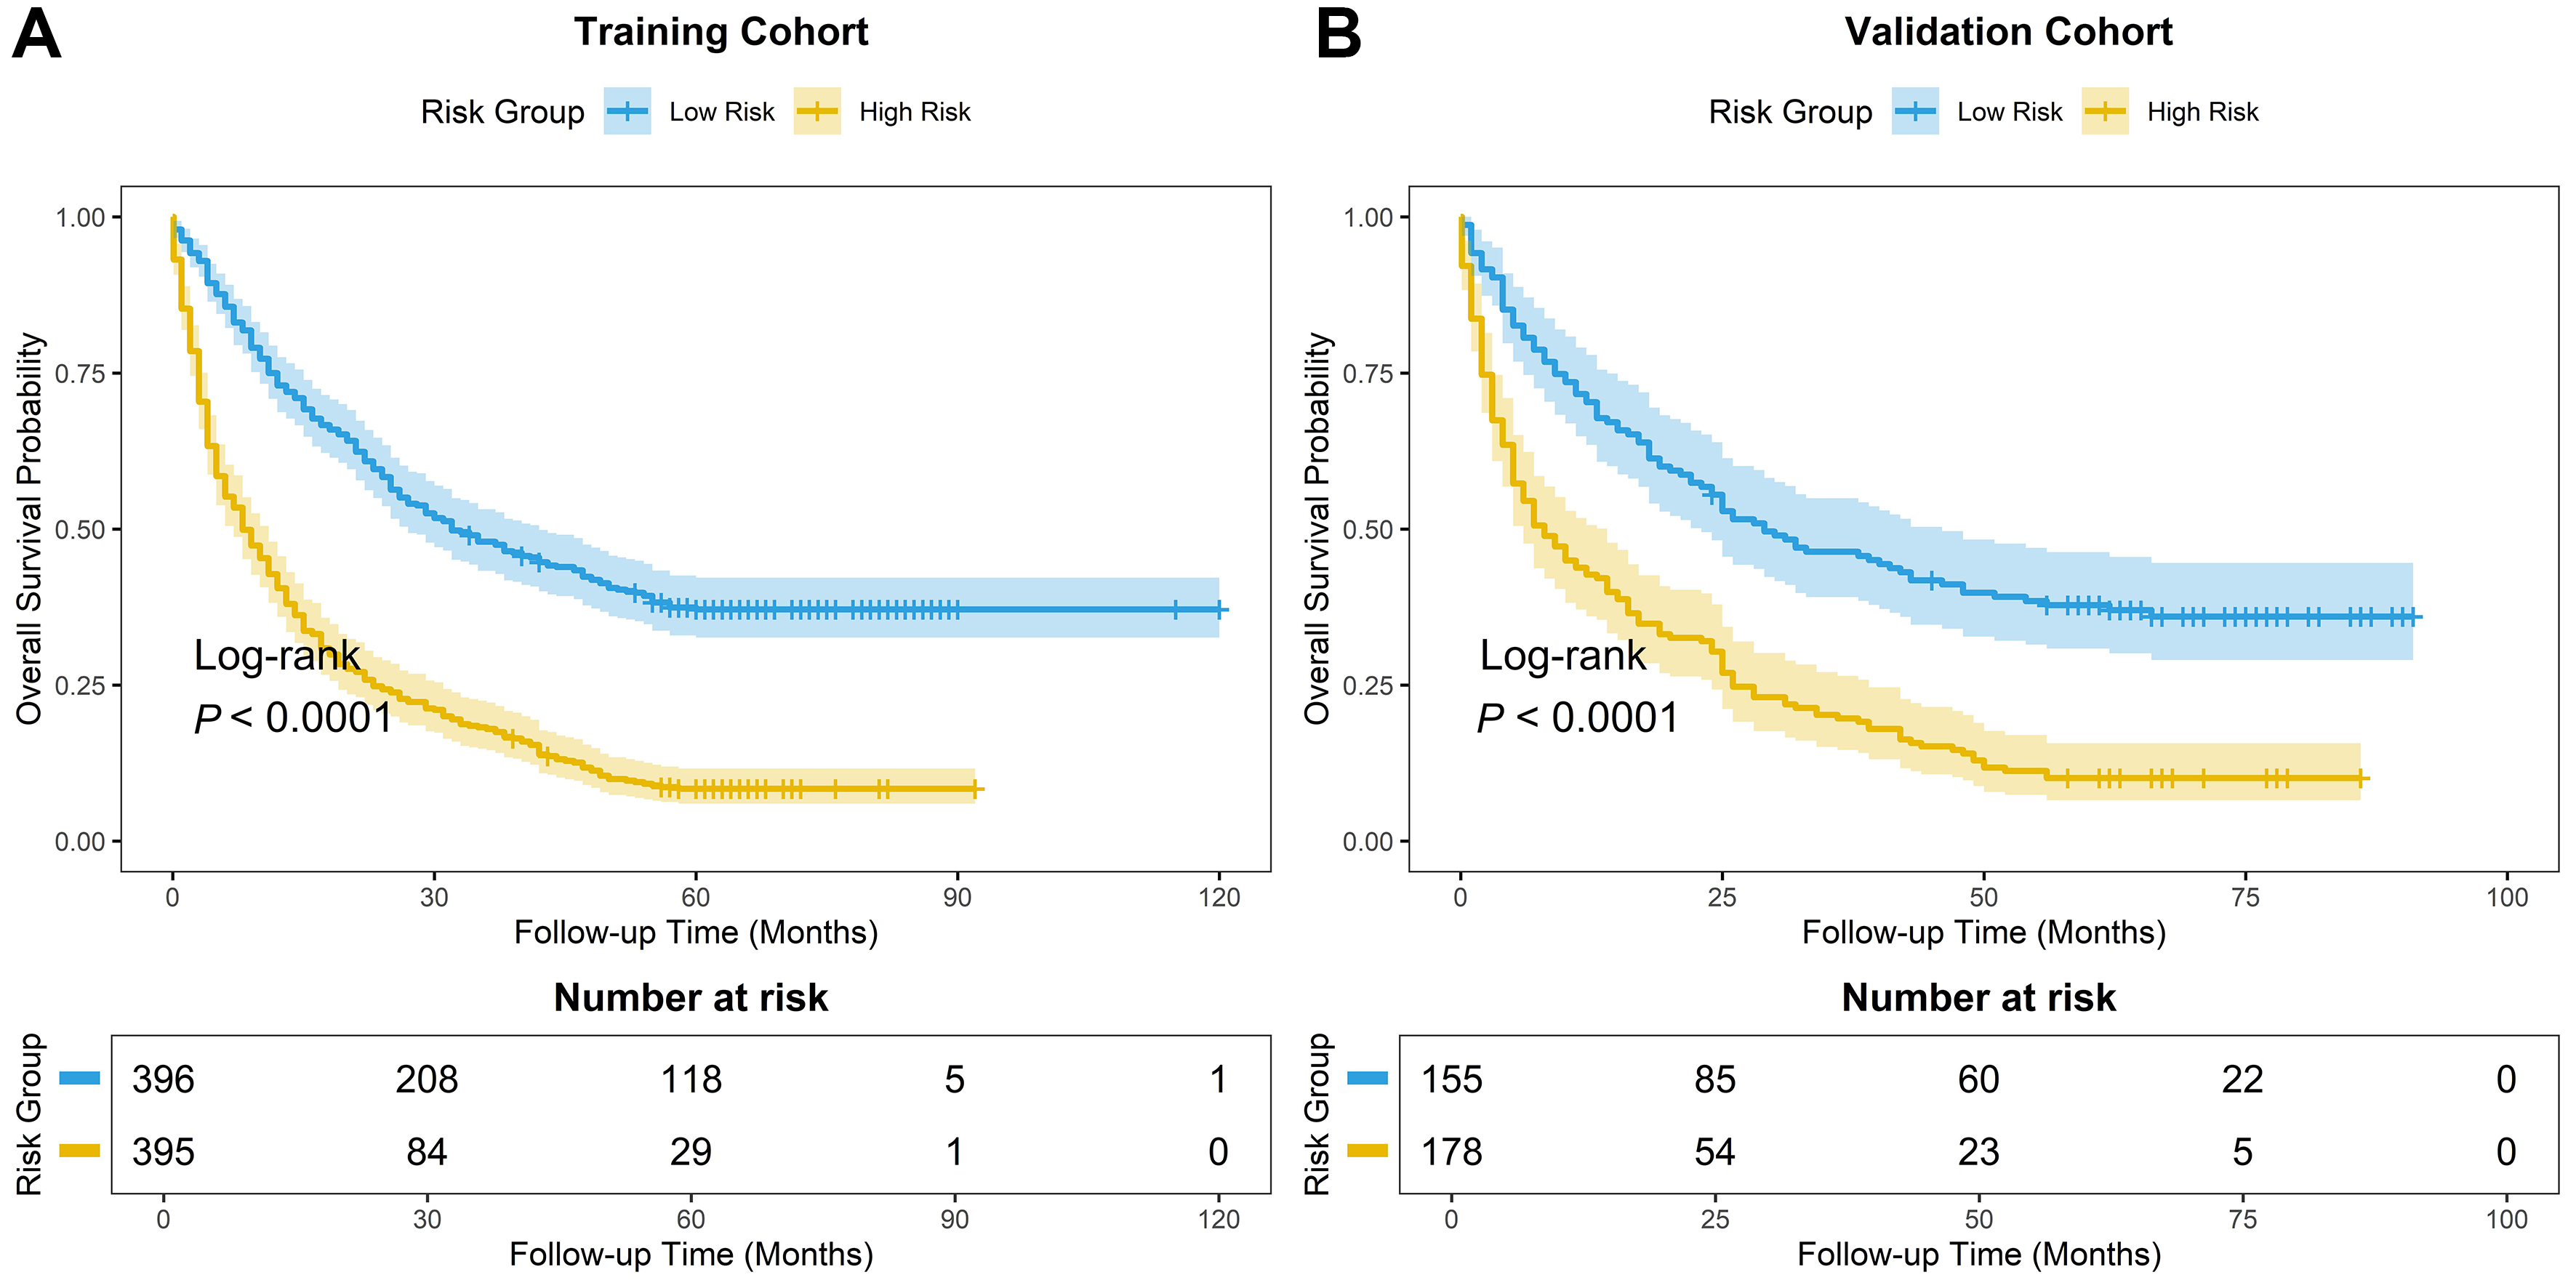
Figure 6. Kaplan-Meier survival curves for patients stratified into high- and low-risk groups. Based on the scores from the nomogram, patients were stratified into high-risk and low-risk groups. (A and B) OS curves show significant discrimination between the two groups in both cohorts: (A) training cohort; (B) validation cohort (P < 0.001). OS: Overall survival.
Sensitivity analysis
After fitting the Cox PH model, we assessed the PH assumption using Schoenfeld residuals. Covariates displaying P < 0.05 upon Schoenfeld residual testing comprised interventional therapy, surgery, tumor location, BMI, M stage, chemotherapy, and N stage. As a sensitivity analysis, we fitted a stratified Cox model in which the three most severely violating variables (tumor location, interventional therapy, and surgery) were included as stratification factors. The stratified model produced a training-cohort C-index of 0.636, which was lower than that of the primary unstratified model (C-index = 0.678). In a stratified model, HRs are not estimated for the stratification variables. After stratification, the global PH test remained significant (P = 0.005), indicating residual non-proportionality; therefore, findings from this stratified analysis warrant cautious interpretation. Despite the reduction in C-index, the directions of the remaining key predictors (AST/ALT ratio, AFP, and TNM stage) were consistent with the primary model, providing partial support for the stability of the main associations. Furthermore, the cluster-robust variance model achieved a C-index of 0.678. On bootstrap internal validation, the apparent and optimism-corrected C-indices were 0.678 and 0.665, respectively, while split-sample validation demonstrated a C-index of 0.659 [Table 3]. In addition, sensitivity analysis using a non-proportional Weibull AFT model showed strong consistency with the primary Cox predictions (r = 0.9994, P < 0.001, Supplementary Figure 1), suggesting that non-proportional hazards had limited influence on individual risk stratification.
Sensitivity analysis of primary Cox model
| Analysis | Cohort | C-index | Notes |
| Primary Cox model | Training | 0.678 | Reference |
| Primary Cox model with cluster-robust variance | Training | 0.678 | Robust SE |
| Stratified Cox model | Training | 0.636 | 3 variables as strata |
| Bootstrap internal validation | Training | 0.678 (apparent) 0.665 (optimism-corrected) | 500 resamples; optimism-corrected |
| Split-sample validation | Validation | 0.659 | Independent cohort |
DISCUSSION
Despite advances in liver cancer treatment, substantial geographic differences in survival persist. Epidemiological data indicate that the 5-year relative survival among liver cancer patients in China is approximately 14.4%[20], considerably lower than the 22% observed in the United States during the same period[21]. Differences in early screening coverage may contribute to this gap. The gap also highlights the need for prognostic models suited to local populations to inform clinical decisions. In this cohort of 1,124 patients with long-term follow-up, we identified the AST/ALT ratio, AFP level, BMI, TNM stage, surgical treatment, and history of hepatitis as independent prognostic factors for OS, consistent with previous reports[22-25]. Leveraging these identified variables, a predictive nomogram was established.
First, the model underscores the importance of anatomical stage and surgical treatment in prognostic assessment. The TNM framework captures anatomical disease burden by evaluating primary tumor infiltration (T), regional nodal involvement (N), and distant metastatic spread (M). Several recent large studies have found that TNM stage is independently associated with OS in primary liver cancer[26-28]. Previous multicenter studies have reported C-indices of 0.651-0.678 for TNM staging[29]. For patients with early-stage disease or those with intermediate-stage tumors who are carefully selected, surgical resection continues to be a vital therapeutic approach[30,31]. The model was designed as a prognostic assessment tool to be applied after the initial treatment decision, rather than for prediction at the exact moment of diagnosis. Resection removes tumor tissue, though its survival correlation within an observational dataset likely captures inherent selection bias. Potential biological influences on postoperative inflammation and tumor progression warrant dedicated mechanistic exploration[32].
The inclusion of routine biochemical markers may make this model more practical in clinical practice, obtaining a biopsy sample from a patient with liver cancer can be limited by bleeding risk or technical difficulties related to coexisting severe cirrhosis, coagulation disorders, or challenging tumor locations[33,34]. Consequently, pathological subtyping may not be feasible for some patients. Compared to invasive pathological assessments, the AST/ALT ratio and AFP employed in this study are routine preoperative blood markers. These noninvasive, relatively low-cost tests are standardized and widely available across levels of care, particularly in primary care settings[35].
From a biological perspective, these biochemical markers may capture aspects of both tumor characteristics and host status. An elevated AST/ALT ratio may reflect hepatocellular injury[36-38] and changes in mitochondrial function. AST has a mitochondrial isoenzyme; however, the ratio alone cannot establish the mechanism. An elevated ratio may also accompany reduced hepatic functional reserve and greater systemic stress[39-41]. AFP is an established tumor marker associated with survival[42-44]. High circulating AFP levels correlate strongly with tumor progression[45,46]; furthermore, AFP is also involved in the molecular pathogenesis of liver cancer. Preclinical evidence indicates that AFP triggers the phosphatidylinositol 3-kinase/protein kinase B (PI3K/Akt) pathway, which promotes the propagation of liver cancer stem cells (LCSCs) and upregulates stemness-associated genes in the tumor microenvironment, which may drive aggressive malignant phenotypes[47-49]. LCSC markers commonly implicated in this process include epithelial cell adhesion molecule (EpCAM), cluster of differentiation 133 (CD133), cluster of differentiation 90 (CD90), cluster of differentiation 44 (CD44), and aldehyde dehydrogenase 1 (ALDH1), with EpCAM and CD133 being the most frequently reported[50]. Notably, AFP-mediated activation of PI3K/Akt signaling has been shown to promote LCSC generation, wherein EpCAM, CD133, and CD44 serve as critical markers in this process[51]. AFP has also been linked to immune evasion, including reduced macrophage phagocytic activity, which may weaken antitumor immune surveillance[52,53].
Another finding was the association between documented hepatitis history and longer survival. This counterintuitive association does not imply that viral hepatitis improves survival. Earlier diagnosis through surveillance, including lead-time bias, may help explain it[54]. Patients with a documented history of chronic hepatitis may receive regular long-term surveillance. Surveillance may detect tumors before symptoms appear, increasing the opportunity for curative-intent surgery; postoperative antiviral treatment may confer additional benefits in eligible patients[55-57]. Conversely, among patients with HCC, those with non-viral HCC often lack established clinical cues to trigger regular screening; consequently, they frequently present with higher tumor burdens and advanced disease stages at initial diagnosis, which may limit treatment options and survival[58].
The model’s discrimination is modest compared with that of complex multi-omics or advanced radiomics models, which often report C-indices above 0.75[59,60] - its potential advantage is practical feasibility. Compared with previously published Cox models for liver cancer prognosis[14,15], this study has several features. First, our model was developed and internally verified using a regional cancer registry comprising 1,124 primary liver cancer cases with extended follow-up, providing evidence from routine care in this region. Second, we integrated routinely available biochemical markers (AST/ALT ratio and AFP) with clinicopathological variables, which may make the model useful where advanced diagnostic resources are limited. In contrast, previous models have relied on specialized biomarkers such as the heat shock protein 90α/albumin ratio[14] or on database-derived variables with limited laboratory information[15]. Third, we performed a series of sensitivity analyses, including stratified Cox regression, cluster-robust variance estimation, bootstrap internal validation, and split-sample validation, to assess the stability of the findings. We acknowledge that the stratified model showed a lower C-index (0.636 vs. 0.678) and the global PH assumption was not fully satisfied after stratification (P = 0.005); therefore, these findings warrant cautious interpretation. Fourth, according to DCA, our model demonstrated superior net benefit over conventional TNM staging for 3- and 5-year OS, with similar utility at 1 year. These features warrant further evaluation of the model in primary care. Most high-performance models rely on genomic sequencing or advanced imaging features that are frequently unavailable in resource-limited settings. By combining AFP, the AST/ALT ratio, and treatment information, this model may be feasible at different levels of care, including primary care.
The model also addresses practical constraints in liver cancer care. In clinical practice, obtaining tissue samples through pathological biopsy often involves significant bleeding risks or technical limitations due to coexisting severe cirrhosis, coagulation disorders, or challenging tumor locations[61]. Consequently, precise pathological subtyping is not always achievable for every patient. Compared to invasive assessments, the AST/ALT ratio and AFP are routine blood markers that are non-invasive, cost-effective, and highly standardized[62]. Because liver cancer disproportionately affects rural populations in China[63] - where access to advanced diagnostic infrastructure is limited, a model based on widely available markers could improve access to risk stratification. Despite its moderate C-index, the model showed greater net benefit than TNM staging at 3 and 5 years in DCA. This finding suggests that an accessible tool may help clinicians in resource-limited settings.
We also conducted sensitivity analyses. Several covariates violated the PH assumption. A stratified Cox regression was therefore performed. The stratified model yielded a lower C-index than the primary model, and the global PH test remained significant after stratification, indicating residual non-proportionality. Therefore, findings from the stratified model warrant cautious interpretation. Nevertheless, the key associations for TNM stage, AFP, and the AST/ALT ratio maintained directional consistency with the primary model, providing partial support for their stability.
Several limitations warrant cautious interpretation. First, the retrospective design of this study may introduce inherent selection bias. Excluding patients with missing survival data or essential follow-up information may limit the model’s applicability. Large prospective cohorts are needed to evaluate and refine its predictive performance in broader populations. Second, several recognized prognostic indicators in liver cancer, such as cirrhosis, vascular invasion, tumor burden (size and count), ECOG performance status, Child-Pugh score, and ALBI grade, were not routinely documented and could not be evaluated. Detailed information on alcohol drinking duration and amount was not available, and alcohol consumption history was therefore categorized as never, former, or current drinking. Detailed information on underlying liver disease, including HBV, HCV, and MASH, was not uniformly available. Histological subtypes, including HCC, ICC, and cHCC-CCA, were not uniformly recorded, and subgroup analyses by subtype could not be performed. The absence of these variables may limit the predictive performance of the model and may introduce residual confounding. Missing data were minimal (< 5%), and complete-case analysis was used; however, residual bias from unmeasured or incompletely recorded variables cannot be fully excluded. Third, several variables violated the PH assumption, and although cluster-robust variance estimation and stratified Cox regression were performed as sensitivity analyses, the global PH assumption was not fully satisfied after stratification (P = 0.005). Sensitivity analysis using a parametric Weibull AFT model showed strong consistency with the primary Cox predictions (r = 0.9994), suggesting limited distortion in relative risk ranking; however, time-varying effects may still influence baseline risk estimation. Fourth, while the model demonstrated acceptable discrimination, absolute calibration varied across time points. Quantitative evaluation confirmed a relatively low MAE at 3 years (MAE = 0.0167), but noticeable calibration deviations were observed at 1 year (MAE = 0.2485) and 5 years (MAE = 0.1174), likely attributable to early acute hazard dynamics and late right-censoring, respectively. Consequently, the nomogram is primarily applicable for intermediate-term (3-year) survival estimation, and predictions at earlier or later time points should be interpreted with caution. Fifth, the data were derived from a regional cancer registry; its performance in other regions remains to be established through external, multicenter validation. Moreover, treatment variables were included as prognostic factors, and treatment-selection bias may exist. In the absence of a landmark analysis, the potential for immortal-time bias cannot be completely ruled out. Finally, the nomogram provides a static prediction and does not incorporate longitudinal biomarker trajectories; it may therefore miss changes in risk during follow-up. Future prospective studies are needed for further validation.
Conclusion
In conclusion, this study identified the AST/ALT ratio, AFP, BMI, TNM stage, surgical resection, and hepatitis history as independent prognostic factors for OS in patients with primary liver cancer. The Cox regression nomogram showed moderate discrimination. Calibration was closest at 3 years, with deviations at 1 and 5 years. The tool may help clinicians to identify patients at higher risk and support prognostic assessment in primary liver cancer.
DECLARATIONS
Authors’ contributions
Contributed to conceptualization, data curation, and writing of the original draft: Liu B
Contributed to methodology and writing, review, and editing: Li D
Contributed resources, conducted investigation, and participated in writing, review, and editing: Liu Y
Contributed software, conducted investigation, and participated in writing, review, and editing: He Z
Contributed to conceptualization, investigation, supervision, and writing, review, and editing: He Y
All authors read and approved the final manuscript.
Availability of data and materials
The datasets used and analyzed during the current study are available from the corresponding author upon reasonable request.
AI and AI-assisted tools statement
During the preparation of this manuscript, the AI tool Google AI Studio (version Gemini 3.8 Flash model; accessed in 2026; https://aistudio.google.com/) was used solely for language editing. The tool did not influence the study design, data collection, analysis, interpretation, or the scientific content of the work. All authors take full responsibility for the accuracy, integrity, and final content of the manuscript.
Financial support and sponsorship
None.
Conflicts of interest
All authors declared that there are no conflicts of interest.
Ethical approval and consent to participate
This study was approved by the Medical Ethics Committee of The Fourth Hospital of Hebei Medical University (Approval No. 2026KS121). Given the retrospective nature of the study, the requirement for informed consent was waived by the committee. All procedures performed in this study were in accordance with the ethical standards of the institutional research committee and with the 1964 Helsinki Declaration and its later amendments or comparable ethical standards.
Consent for publication
Not applicable.
Copyright
© The Author(s) 2026.
Supplementary Materials
REFERENCES
1. Bray F, Laversanne M, Sung H, et al. Global cancer statistics 2022: GLOBOCAN estimates of incidence and mortality worldwide for 36 cancers in 185 countries. CA Cancer J Clin. 2024;74:229-63.
2. Jiang Z, Zeng G, Dai H, et al. Global, regional and national burden of liver cancer 1990-2021: a systematic analysis of the global burden of disease study 2021. BMC Public Health. 2025;25:931.
3. Chan SL, Sun HC, Xu Y, et al. The Lancet Commission on addressing the global hepatocellular carcinoma burden: comprehensive strategies from prevention to treatment. Lancet. 2025;406:731-78.
4. Chen C, Xu Q, Wang T, et al. Comparative analysis of liver cancer burden trends in China and worldwide between 1990 and 2021. Front Public Health. 2025;13:1513210.
5. Qin Y, Tang C, Li J, Gong J. Liver cancer in China: the analysis of mortality and burden of disease trends from 2008 to 2021. BMC Cancer. 2024;24:594.
6. Zhang Y, Chen YX, Cao R, et al. Epidemiological characteristics and disease burden of liver cancer in Guangdong Province. Public Health Prev Med. 2026;37:68-72. (in Chinese). Available from http://fbyf.ijournals.cn/ggwsyyfyx/article/abstract/20260114 [accessed 5 November 2026].
7. Cao GW. Epidemiological characteristics and precision prevention and control of primary liver cancer in China. J Guangxi Med Univ. 2024;41:1455-63. (in Chinese).
8. He J, Chen WQ, Shen HB, et al. China guideline for liver cancer screening (2022, Beijing). J Clin Hepatol. 2022;38:1739-58. (in Chinese).
9. Lin D, Deng Z, Chen Z, et al. The disease burden and its distribution characteristics of clonorchiasis in Guangdong Province, Southern China. Parasit Vectors. 2024;17:353.
10. Hashem EM, Karrar AM, Mabrouk MS. Advancing liver cancer diagnosis and treatment with multi-omics approaches: a systematic review. Discov Oncol. 2025;16:2188.
11. Yang JD, Hainaut P, Gores GJ, Amadou A, Plymoth A, Roberts LR. A global view of hepatocellular carcinoma: trends, risk, prevention and management. Nat Rev Gastroenterol Hepatol. 2019;16:589-604.
12. Reig M, Forner A, Rimola J, et al. BCLC strategy for prognosis prediction and treatment recommendation: The 2022 update. J Hepatol. 2022;76:681-93.
13. Sato-Espinoza K, Valdivia-Herrera M, Chotiprasidhi P, Diaz-Ferrer J. Hepatocellular carcinoma in patients without cirrhosis. World J Gastroenterol. 2025;31:107100.
14. Li H, Wang J, Ming X, Zhou M, Zhou L. Comparison of machine learning and Cox regression models for prognostic analysis in hepatocellular carcinoma patients with distant metastasis. Surg Open Sci. 2025;27:36-44.
15. Chen J, Chen S, Li H, et al. Interpretable LASSO-Cox model: Hsp90α/albumin ratio predicts hepatocellular carcinoma prognosis. Transl Cancer Res. 2025;14:8462-74.
16. Fan H, Kouvari M, Guo C, et al. A comprehensive comparison of two commonly used BMI thresholds for non-communicable diseases and multimorbidity in the Chinese population. Clin Nutr. 2025;48:70-9.
17. Kaewdech A, Sripongpun P, Assawasuwannakit S, et al. FAIL-T (AFP, AST, tumor size, ALT, and tumor number): a model to predict intermediate-stage HCC patients who are not good candidates for TACE. Front Med. 2023;10:1077842.
18. National Health Commission of the People’s Republic of China. Reference intervals for common clinical immunological tests-Part 2: Serum alpha-fetoprotein, carcinoembryonic antigen, carbohydrate antigen 19-9, carbohydrate antigen 15-3, carbohydrate antigen 125: WS/T 645.2-2018. Available from https://www.nhc.gov.cn/. [accessed 3 November 2026].
19. Zhou J, Sun H, Wang Z, et al. China Liver Cancer Guidelines for the Diagnosis and Treatment of Hepatocellular Carcinoma (2024 Edition). Liver Cancer. 2025;14:779-835.
20. Cao W, Qin K, Liu B, Chen W. Cancer statistics in China: epidemiology, risk factors, and prevention. Chin J Cancer Res. 2025;37:912-28.
21. Siegel RL, Kratzer TB, Wagle NS, Sung H, Jemal A. Cancer statistics, 2026. CA Cancer J Clin. 2026;76:e70043.
22. Bai J, Zhou J, Zhao X, et al. Effect of AFP and PIVKA-II secretion status on prognosis of advanced hepatocellular carcinoma patients receiving TACE combined with systemic therapy. BMC Cancer. 2025;25:1701.
23. Wang Q, Liu F, Liu C, et al. Impact of body mass index in patients with hepatocellular carcinoma treated with TACE combined with lenvatinib and PD-1 inhibitors. Oncologie. 2025;27:603-14.
24. Ye Q, Yu Y, Pang S, et al. Nomogram for predicting postoperative recurrence in patients with microvascular invasion-negative hepatocellular carcinoma: development and validation. Front Immunol. 2025;16:1614392.
25. Fu J, Liu M, Chen S, Chen L, Liang S. Prognostic nomogram for hepatocellular carcinoma with major vascular invasion: a population-based study from the SEER database and a Chinese cohort. Eur J Med Res. 2025;30:836.
26. Chen QF, Lyu N, Wang X, et al. Cost-effectiveness and prognostic model of hepatic arterial infusion chemotherapy for hepatocellular carcinoma with high tumor burden and/or Vp4 tumor thrombus compared with sorafenib: a post-hoc analysis of the FOHAIC-1 trial. Int J Surg. 2023;109:3929-39.
27. Yuqin L, Hongyan L, Hongyuan L, et al. Lymph node metastasis in patients with hepatocellular carcinoma using machine learning: a population-based study. Front Oncol. 2025;15:1601985.
28. Ji K, Zhu H, Zhang C, et al. Nomogram-based prognostic stratification for patients with large hepatocellular carcinoma: a population study of SEER database and a Chinese cohort. J Gastrointest Oncol. 2024;15:2201-15.
29. Yao LQ, Fan HX, Chen FJ, et al. Heterogeneity in prognosis for early-stage hepatocellular carcinoma after hepatectomy: a multicenter analysis of 4,623 patients across five major staging systems. Eur J Surg Oncol. 2025;51:110383.
30. Suddle A, Reeves H, Hubner R, et al. British Society of Gastroenterology guidelines for the management of hepatocellular carcinoma in adults. Gut. 2024;73:1235-68.
31. Park MS, Cho JY, Kim E, et al. Surgical treatment of hepatocellular carcinoma: an expert consensus-based practical recommendation from the Korean Liver Cancer Association. J Liver Cancer. 2025;25:140-59.
32. Di Sandro S, Centonze L, Ratti F, et al. ; IGoMILS Collaborative Group. Robotic vs laparoscopic resection for hepatocellular carcinoma: multicentric propensity-score matched analysis of surgical and oncologic outcomes in 647 patients. Updates Surg. 2025;77:1451-62.
33. Riescher-Tuczkiewicz A, Caldwell SH, Kamath PS, Villa E, Rautou PE; Bleeding in liver diseases investigators†, Bleeding in liver diseases investigators. Expert opinion on bleeding risk from invasive procedures in cirrhosis. JHEP Rep. 2024;6:100986.
34. Madan K, Kumar A. To biopsy or not to biopsy? Re-examining the role of tissue diagnosis in hepatocellular carcinoma. J Clin Exp Hepatol. 2026;16:103209.
35. Lu J, Wang F, Zhang W, et al. Perioperative changes in serum transaminases levels predicts long-term survival following liver resection of hepatocellular carcinoma. Ann Surg Oncol. 2025;32:2446-55.
36. Zheng Z, Mei J, Guan R, et al. A novel liver-function-indicators-based prognosis signature for patients with hepatocellular carcinoma treated with anti-programmed cell death-1 therapy. Cancer Immunol Immunother. 2024;73:158.
37. Kostakis ID, Kotelis N, Safavi D, Iype S. Preoperative blood tests provide diagnostic and prognostic information about patients with hepatocellular carcinoma. Eur J Gastroenterol Hepatol. 2025;37:219-29.
38. Crișan D, Procopeț B, Crăciun R, et al. The role of easy-to-use non-invasive scores in the assessment of hepatocellular carcinoma prognosis - data from the romanian hepatocellular carcinoma registry. J Gastrointestin Liver Dis. 2025;34:205-13.
39. Gao B, Lu Y, Lai X, et al. Metabolic reprogramming in hepatocellular carcinoma: mechanisms of immune evasion and therapeutic implications. Front Immunol. 2025;16:1592837.
40. Huo RR, Pan LX, Wu PS, et al. Prognostic value of aspartate aminotransferase/alanine aminotransferase ratio in hepatocellular carcinoma after hepatectomy. BJS Open. 2024;8:zrad155.
41. Mo Q, Liu Y, Zhou Z, et al. Prognostic value of aspartate transaminase/alanine transaminase ratio in patients with hepatitis B virus-related hepatocellular carcinoma undergoing hepatectomy. Front Oncol. 2022;12:876900.
42. Ikuta S, Aihara T, Nakajima T, Yamanaka N. Alpha-fetoprotein as a prognostic factor in alpha-fetoprotein-negative hepatocellular carcinoma - integration into post-resection prognostic nomograms. Contemp Oncol. 2025;29:69-76.
43. Xu S, Duan L, Cho WC, Jin S, Ma L. Identification of patients with early-stage hepatocellular carcinoma benefiting from neoadjuvant chemotherapy-A SEER-based study. J Gastrointest Cancer. 2025;56:144.
44. Yao LQ, Fan ZQ, Wang MD, et al. Prognostic value of serum α-fetoprotein level as an important characteristic of tumor biology for patients undergoing liver resection of early-stage hepatocellular carcinoma (BCLC Stage 0/A): a large multicenter analysis. Ann Surg Oncol. 2024;31:1219-31.
45. Glowska-Ciemny J, Pankiewicz J, Malewski Z, von Kaisenberg C, Kocylowski R. Alpha-fetoprotein (AFP) - new aspects of a well-known marker in perinatology. Ginekol Pol. 2022;93:70-5.
46. Luo P, Wu S, Yu Y, et al. Current status and perspective biomarkers in AFP negative HCC: towards screening for and diagnosing hepatocellular carcinoma at an earlier stage. Pathol Oncol Res. 2020;26:599-603.
47. Jeng KS, Chang CF, Sheen IS, Jeng CJ, Wang CH. Cellular and molecular biology of cancer stem cells of hepatocellular carcinoma. Int J Mol Sci. 2023;24:1417.
48. Ashokachakkaravarthy K, Pottakkat B. Mitotic quiescence in hepatic cancer stem cells: An incognito mode. Oncol Rev. 2020;14:452.
49. Xu Y, Guo Q, Wei L. The emerging influences of alpha-fetoprotein in the tumorigenesis and progression of hepatocellular carcinoma. Cancers. 2021;13:5096.
50. Gramantieri L, Giovannini C, Suzzi F, Leoni I, Fornari F. Hepatic cancer stem cells: molecular mechanisms, therapeutic implications, and circulating biomarkers. Cancers. 2021;13:4550.
51. Zhu M, Li W, Lu Y, et al. HBx drives alpha fetoprotein expression to promote initiation of liver cancer stem cells through activating PI3K/AKT signal pathway. Int J Cancer. 2017;140:1346-55.
52. Munson PV, Adamik J, Butterfield LH. Immunomodulatory impact of α-fetoprotein. Trends Immunol. 2022;43:438-48.
53. Kim HI, Lim J, Shim JH. Role of the alpha-fetoprotein response in immune checkpoint inhibitor-based treatment of patients with hepatocellular carcinoma. J Cancer Res Clin Oncol. 2022;148:2069-77.
54. Huang DQ, Hoang JK, Kamal R, et al. Antiviral therapy utilization and 10-year outcomes in resected hepatitis B virus- and hepatitis C virus-related hepatocellular carcinoma. J Clin Oncol. 2024;42:790-9.
55. Liu J, Bai S, Shi X, et al. Benefits of entecavir therapy in HBV-related hepatocellular carcinoma patients with compensated cirrhosis after hepatectomy: a ten-year retrospective cohort study. Eur J Surg Oncol. 2025;51:109621.
56. Singal AG, Zhang E, Narasimman M, et al. HCC surveillance improves early detection, curative treatment receipt, and survival in patients with cirrhosis: a meta-analysis. J Hepatol. 2022;77:128-39.
57. Liang Y, Zhong D, Zhang Z, et al. Impact of preoperative antiviral therapy on the prognosis of hepatitis B virus-related hepatocellular carcinoma. BMC Cancer. 2024;24:291.
58. Mauro E, de Castro T, Zeitlhoefler M, et al. Hepatocellular carcinoma: epidemiology, diagnosis and treatment. JHEP Rep. 2025;7:101571.
59. Xie H, Shi B, Fan J, et al. A predictive model based on radiomics, clinical features, and pathologic indicators for disease-free survival after liver transplantation for hepatocellular carcinoma: a 7-year retrospective study. J Gastrointest Oncol. 2024;15:2187-200.
60. Wu Y, Wu J, Duan S, et al. A refined prognostic model for postoperative overall survival in hepatocellular carcinoma based on CODEX-based multiproteomics and radiomics. J Hepatocell Carcinoma. 2025;12:2169-82.
61. Bissonnette J, Riescher-Tuczkiewicz A, Gigante E, et al. Predicting bleeding after liver biopsy using comprehensive clinical and laboratory investigations: a prospective analysis of 302 procedures. J Thromb Haemost. 2022;20:2786-96.
Cite This Article
 Open Access
How to Cite
Liu B, Li D, Liu Y, He Z, He Y. Prognostic factors and a Cox proportional hazards model for survival in primary liver cancer. Hepatoma Res. 2026;12:64. https://dx.doi.org/10.20517/2394-5079.2026.88
Download Citation
If you have the appropriate software installed, you can download article citation data to the citation manager of your choice. Simply select your manager software from the list below and click on download.
Export Citation File
Type of Import
Tips on Downloading Citation
Citation Manager File Format
Type of Import
Direct Import: When the Direct Import option is selected (the default state), a dialogue box will give you the option to Save or Open the downloaded citation data. Choosing Open will either launch your citation manager or give you a choice of applications with which to use the metadata. The Save option saves the file locally for later use.
Indirect Import: When the Indirect Import option is selected, the metadata is displayed and may be copied and pasted as needed.
About This Article
Copyright

Data & Comments
Data
0











Comments
Comments must be written in English. Spam, offensive content, impersonation, and private information will not be permitted. If any comment is reported and identified as inappropriate content by OAE staff, the comment will be removed without notice. If you have any queries or need any help, please contact us at [email protected].