


fig6
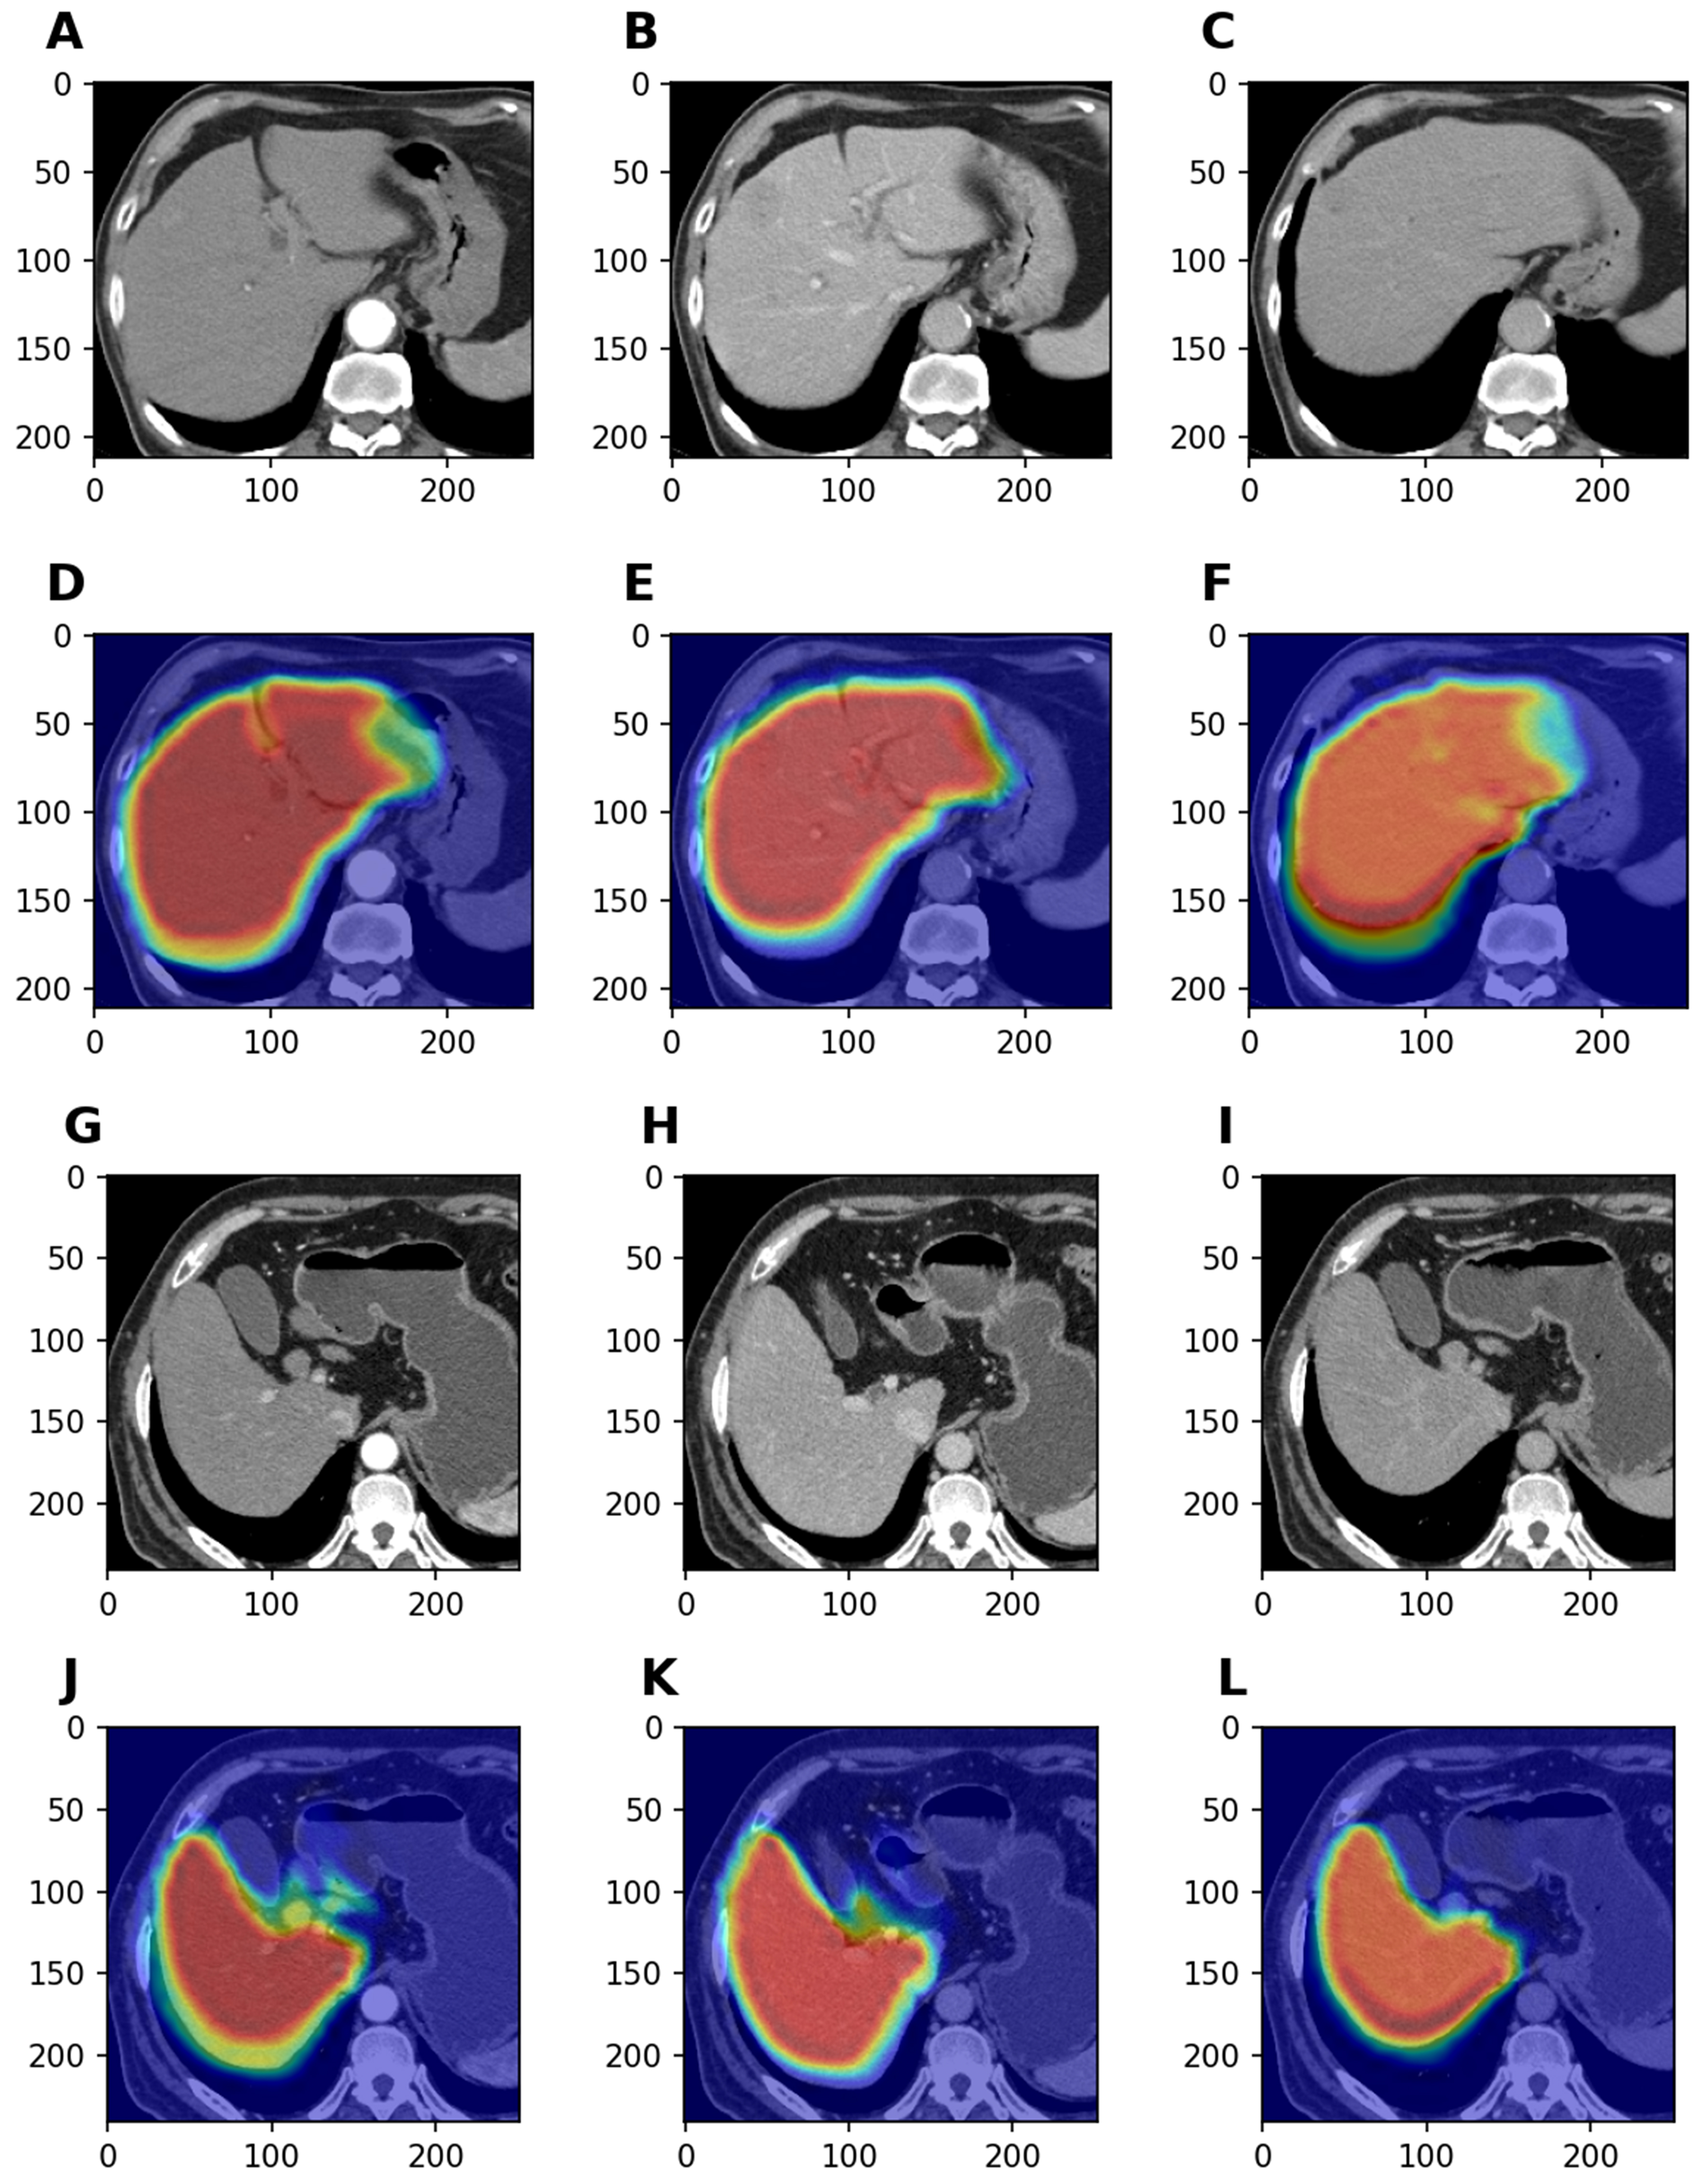
Figure 6. Visual interpretability using CAMs. These images highlight the specific liver regions on which the model focused during feature extraction. (A-F) show representative triphasic CT scans from the training cohort alongside their CAM-overlaid counterparts. Similarly, panel (G-L) displays original and attention-mapped images selected from the validation cohort. CAM: Class activation map; CT: computed tomography.


