


fig5
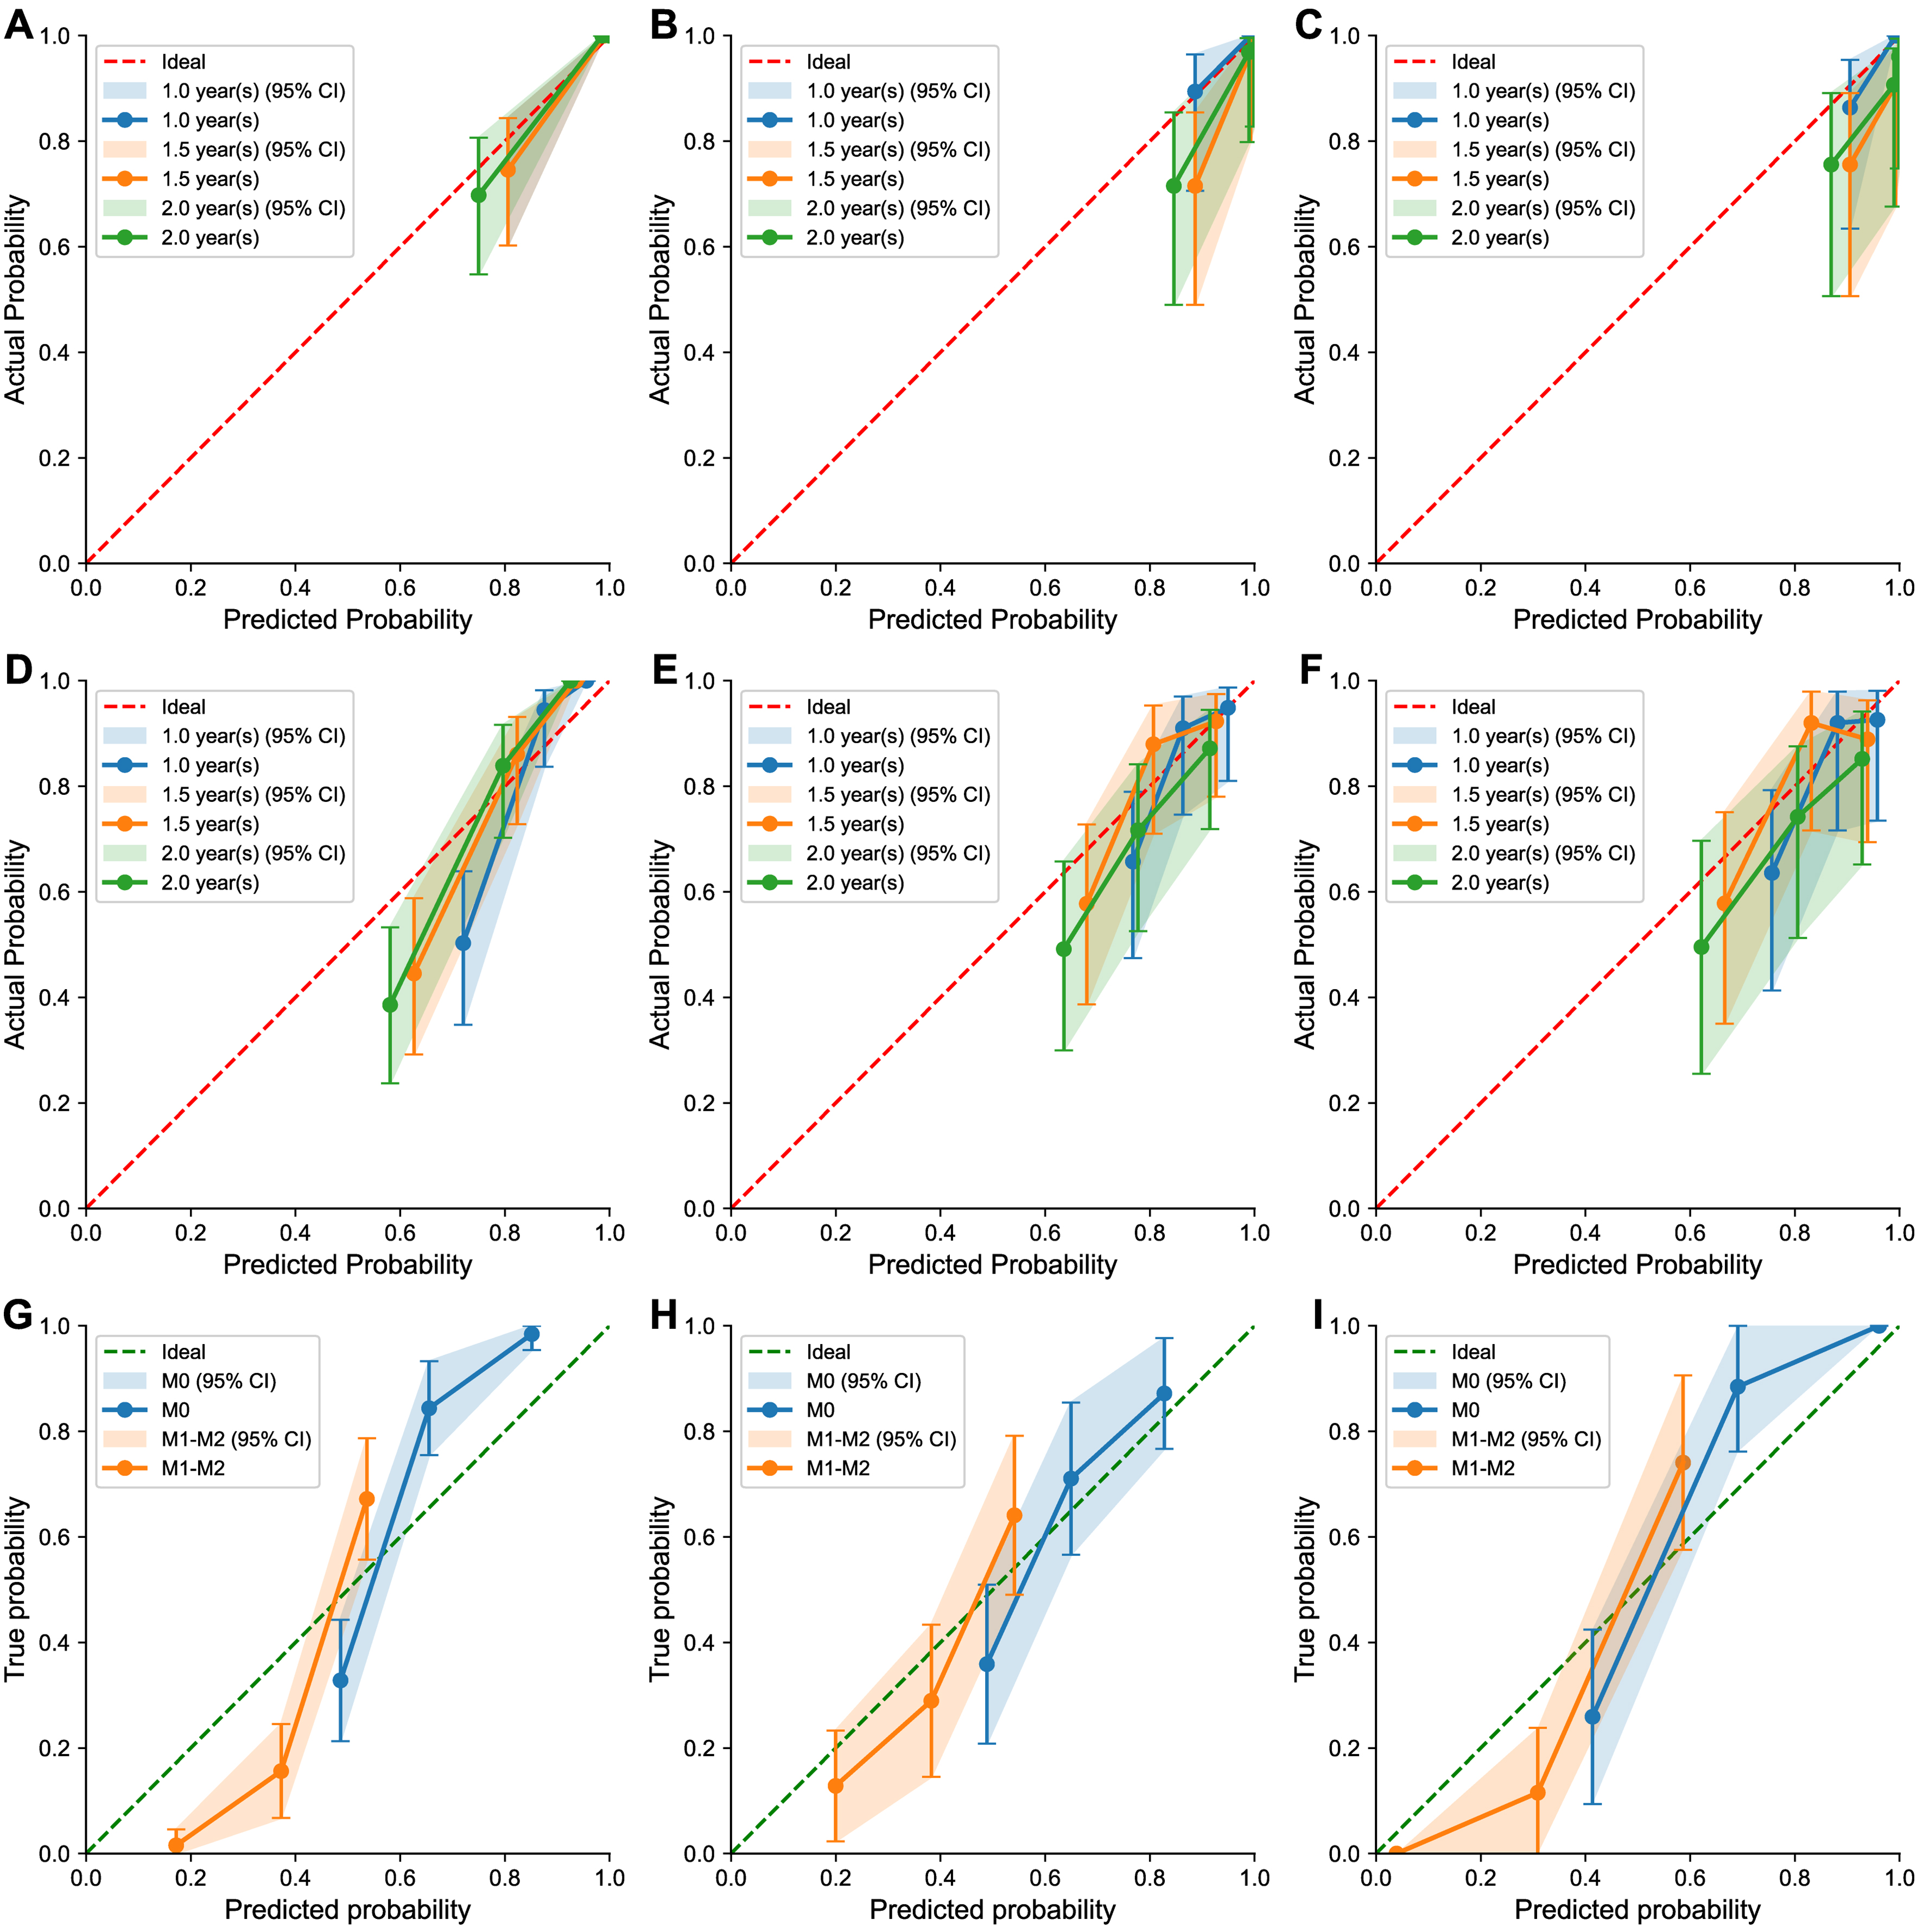
Figure 5. Goodness-of-fit assessment via calibration plots. These diagrams demonstrate the agreement between the model’s predicted probabilities and the observed clinical outcomes. The panels are organized by metric: (A-C) for overall survival, (D-F) for recurrence-free survival, and (G-I) for the prediction of MVI status. Each metric is evaluated across the training, internal validation, and external validation cohorts. OS: Overall survival; RFS: recurrence-free survival; MVI: microvascular invasion; CI: confidence interval; M0: no microvascular invasion; M1-M2: presence of microvascular invasion.


