


fig4
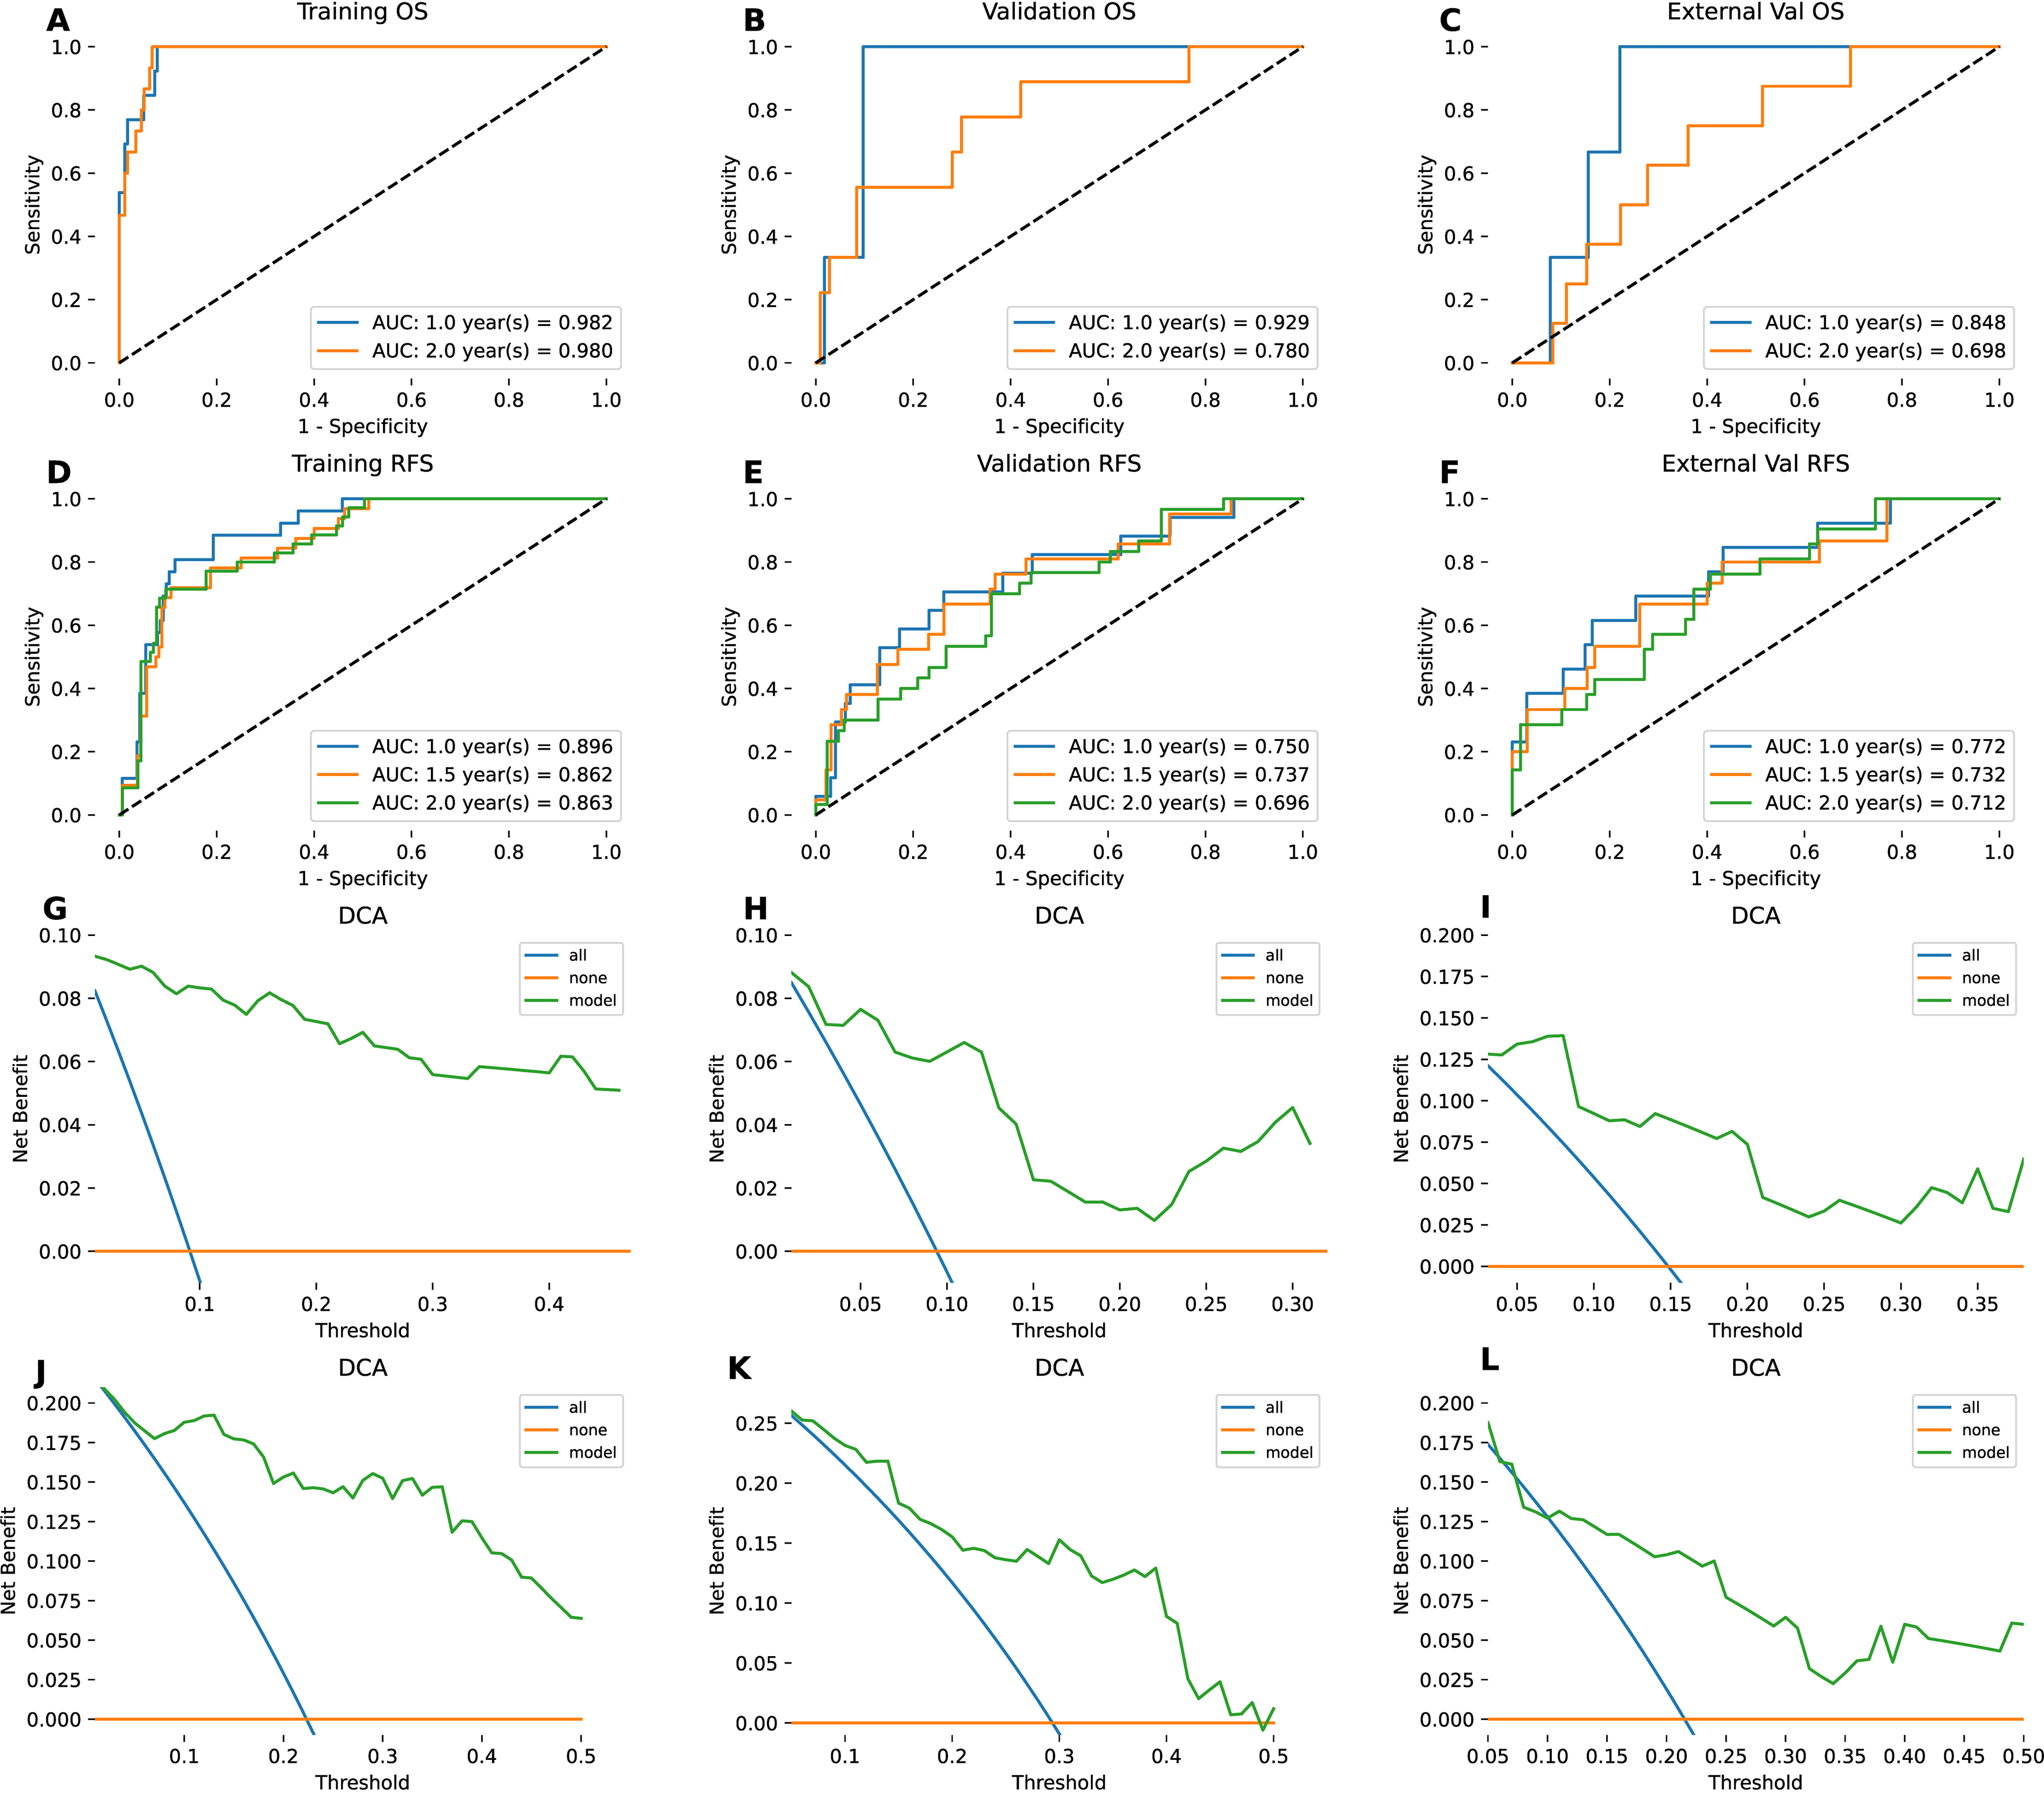
Figure 4. Assessment of discriminatory power and clinical utility. (A-F) ROC curves and corresponding AUC values, evaluating the model’s performance for OS and RFS across all three study cohorts (training, validation, and external); (G-L) DCA, highlighting the net clinical benefit for OS and RFS prediction in the respective datasets. Note: The 1.5-year metrics in A-C correspond to the 2-year metrics. To enhance visual clarity, data points for the 1.5-year survival rate have been excluded. ROC: Receiver operating characteristic; AUC: area under the curve; DCA: decision curve analysis; OS: overall survival; RFS: recurrence-free survival.


