


fig3
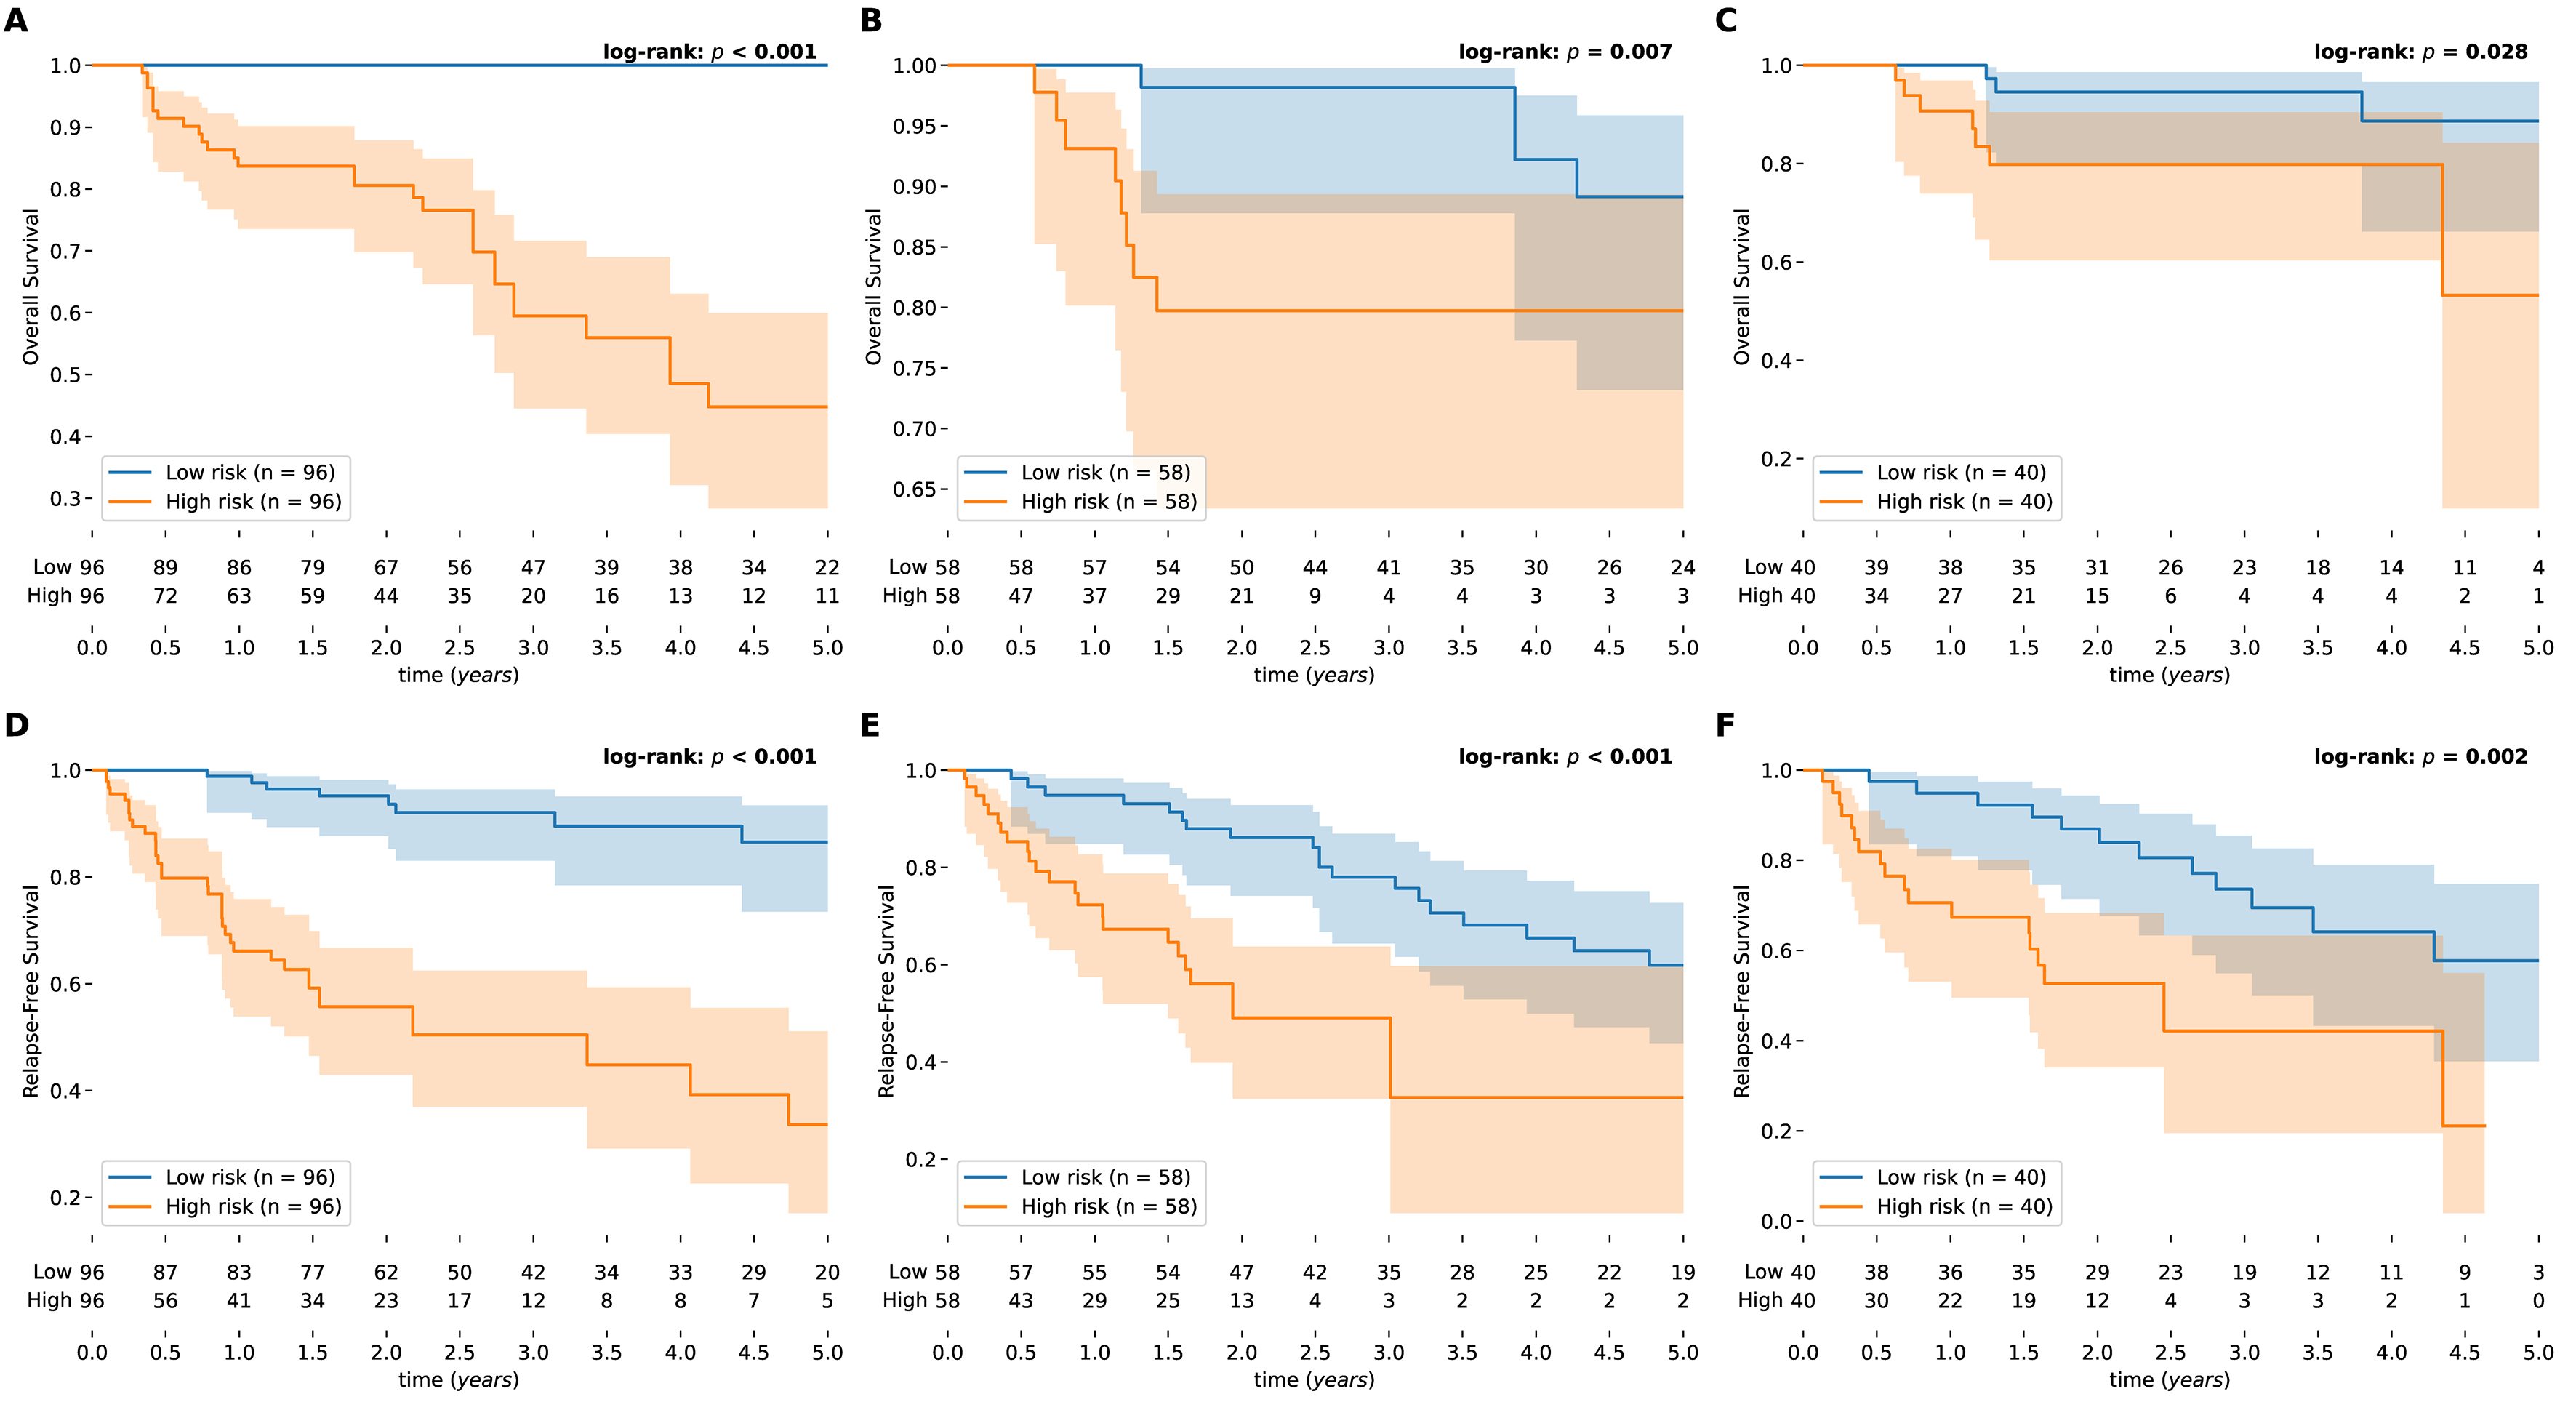
Figure 3. Kaplan-Meier survival analysis stratified by model-predicted risk. Patients were categorized into high- and low-risk groups to compare outcomes. The (A-C) and (D-F) display the survival curves for OS and RFS, respectively. These comparisons encompass the training, internal validation, and external validation cohorts. Note: Analysis was truncated at 5 years (60 months) to emphasize the clinically significant window for HCC prognosis, despite raw follow-up data extending to 2,934 days. OS: Overall survival; RFS: recurrence-free survival; HCC: hepatocellular carcinoma.


