
fig1
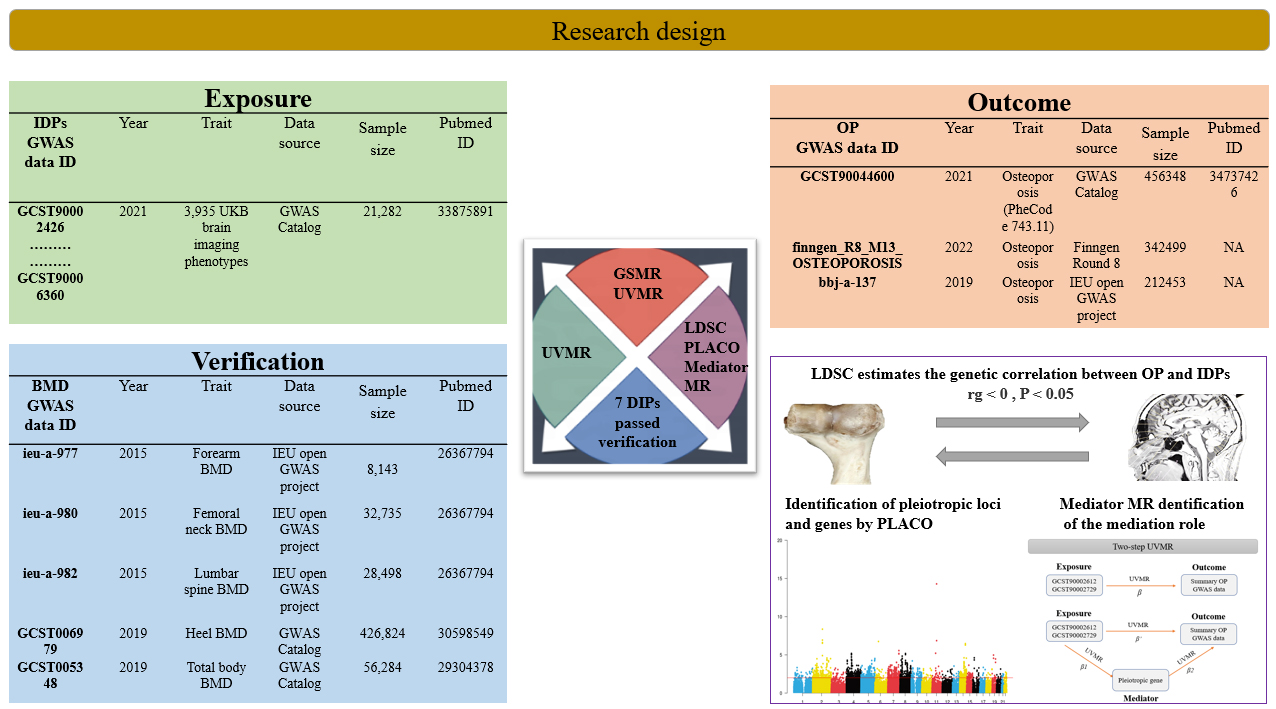
Figure 1. Study workflow. Overview of the analytical pipeline used in this study, including large-scale screening of brain imaging-derived phenotypes, Mendelian randomization analyses, genetic correlation analysis, pleiotropy screening, colocalization analysis, and mediation analysis. The human tissue and imaging illustrations shown in this figure were created entirely by the authors using Adobe Illustrator. DP: Imaging-derived phenotype; GWAS: genome-wide association studies; OP: osteoporosis; BMD: bone mineral density; LDSC: linkage disequilibrium score regression; PLACO: pleiotropic analysis under composite null hypothesis; MR: Mendelian randomization. The human tissue and imaging illustrations shown in this figure were created entirely by the authors using Adobe Illustrator.

