

Shared genetic architecture between brain imaging-derived phenotypes and osteoporosis: a large-scale genetic correlation study
 0
0 Abstract
Aim: To investigate whether large-scale brain imaging-derived phenotypes share genetic architecture with osteoporosis and to evaluate potential pleiotropic loci and candidate mediators linking brain structure and skeletal risk.
Methods: We analyzed summary statistics for 3,935 UK Biobank brain imaging-derived phenotypes (IDPs) and a meta-analyzed European osteoporosis genome-wide association studies (GWAS) using generalized and inverse-variance-weighted Mendelian randomization. Five bone mineral density datasets were used for validation. Linkage disequilibrium score regression, pleiotropy analysis under the composite null hypothesis, colocalization, and two-step Mendelian randomization were applied to characterize shared loci and to assess candidate mediation.
Results: Seventy-five imaging-derived phenotypes showed evidence of association with osteoporosis, and 16 remained supported after validation with bone mineral density traits. BrainSegVol-to-eTIV (estimated total intracranial volume) and left thalamic volume CL (central lateral nucleus) showed the most consistent signals across osteoporosis and bone mineral density outcomes. Seven imaging-derived phenotypes showed significant genetic correlation with osteoporosis by linkage disequilibrium score regression. Forty pleiotropic loci were detected at genome-wide significance, and six had colocalization support. HLA-DRB1 (human leukocyte antigen - DRB1) showed evidence consistent with partial mediation of the association between BrainSegVol-to-eTIV and osteoporosis, with an estimated mediation proportion of 41.8% and a 95% confidence interval of 19.90% to 63.70%.
Conclusion: Genome-wide cross-trait analyses support shared genetic architecture between selected imaging-derived phenotypes and osteoporosis. BrainSegVol-to-eTIV, left thalamic volume CL, and HLA-DRB1 emerged as prioritized statistical signals, although replication and functional validation remain necessary before any mechanistic brain-bone pathway can be inferred.
Keywords
INTRODUCTION
Osteoporosis (OP) is characterized by increased bone turnover, decreased bone mass, and skeletal fragility, which increases fracture risk. OP is a major public health problem, and more than 9 million fragility fractures occur globally each year[1,2]. Experimental and clinical evidence suggests that the central nervous system can modulate bone metabolism through neuroendocrine and autonomic pathways[3,4]. Neurodegenerative disorders such as Alzheimer’s disease and Parkinson’s disease are also associated with higher osteoporosis prevalence[5,6]. Recent genome-wide association studies (GWAS) have further suggested that loci associated with bone density and brain structure may partially overlap[7]. These observations support a systematic assessment of the shared genetic basis between osteoporosis and brain anatomy.
Magnetic resonance imaging (MRI) is an efficient, noninvasive technique for examining the brain[8]. Brain imaging holds significant potential for early disease prediction. Dual-energy X-ray absorptiometry is a widely used diagnostic technique that assesses bone mineral density (BMD) at specific skeletal sites in children and older adults. The most commonly examined bone locations for diagnosing OP are the forearm, lumbar spine, and femoral neck[9]. Heel loci have recently been used to measure OP, and whole-body BMD examinations are a practical approach to objectively assessing BMD[10]. Establishing the causal association between brain anatomy and OP is important for understanding disease biology. Nonetheless, observational clinical studies may be confounded, complicating the establishment of a causal link between brain outcomes and OP. Randomized controlled trials (RCTs), regarded as the most dependable approach for determining cause-and-effect relationships, are constrained by ethical considerations or the substantial expenses of such research[11]. Mendelian randomization (MR) is a widely used epidemiological method for causal inference about the relationship between an exposure and an outcome. The potential bias from residual confounding and reverse causation in traditional observational research is reduced because genetic tools are independent of environmental variables. The disease process is not altered because alleles are randomly distributed during meiosis[12]. Generalized summary-data-based Mendelian randomization (GSMR) jointly models linkage disequilibrium (LD) among instruments and applies Heterogeneity in Dependent Instruments (HEIDI) testing to filter pleiotropic outliers[13]. To further assess genetic associations between brain anatomy and OP, the predominant method for genetic correlation analysis is linkage disequilibrium score regression (LDSC)[14]. Cross-trait studies that use GWAS signal correlations to examine polyvalent genetic variation or loci across multiple phenotypes have been shown to effectively identify common loci across traits or illnesses[15,16]. Interventions targeting these pleiotropic loci may simultaneously prevent or treat multiple diseases. Using a level-α intersection-union test (IUT), a new methodology, termed “PLACO”, has been developed to identify pleiotropy at the single-nucleotide polymorphism (SNP) level[17]. Consequently, examining the common genetic etiology or identifying specific genetic variants or loci underlying genome-wide associations is essential. Additionally, two-step MR may be used to elucidate the effect of exposure on outcomes via mediation studies that use mediating variables[18]. We used these complementary methods to characterize shared genetic signals between brain architecture and osteoporosis.
MATERIALS AND METHODS
GWAS summary statistics for osteoporosis and bone mineral density
The osteoporosis dataset included 1,011,300 participants from three public summary-statistics resources. The GWAS Catalog contributed 456,348 participants, FinnGen Round 8 contributed 342,499 participants, and the IEU Open GWAS project contributed 212,453 participants. A fixed-effects inverse-variance-weighted meta-analysis was performed in METAL[19]. Before meta-analysis, variants were harmonized by genomic position, effect allele, non-effect allele, effect estimate, standard error, and, where available, allele frequency. Palindromic variants with unresolved strand orientation or inconsistent allele frequencies were excluded. Participant-level overlap across the contributing cohorts could not be quantified directly from the released summary statistics and is therefore acknowledged as a potential source of residual bias. All three data sources were restricted to European-ancestry samples. Summary statistics for total body bone mineral density, femoral neck bone mineral density, lumbar spine bone mineral density, forearm bone mineral density, and heel bone mineral density were obtained from the Genetic Factors for Osteoporosis consortium.
GWAS data sources for imaging-derived phenotypes
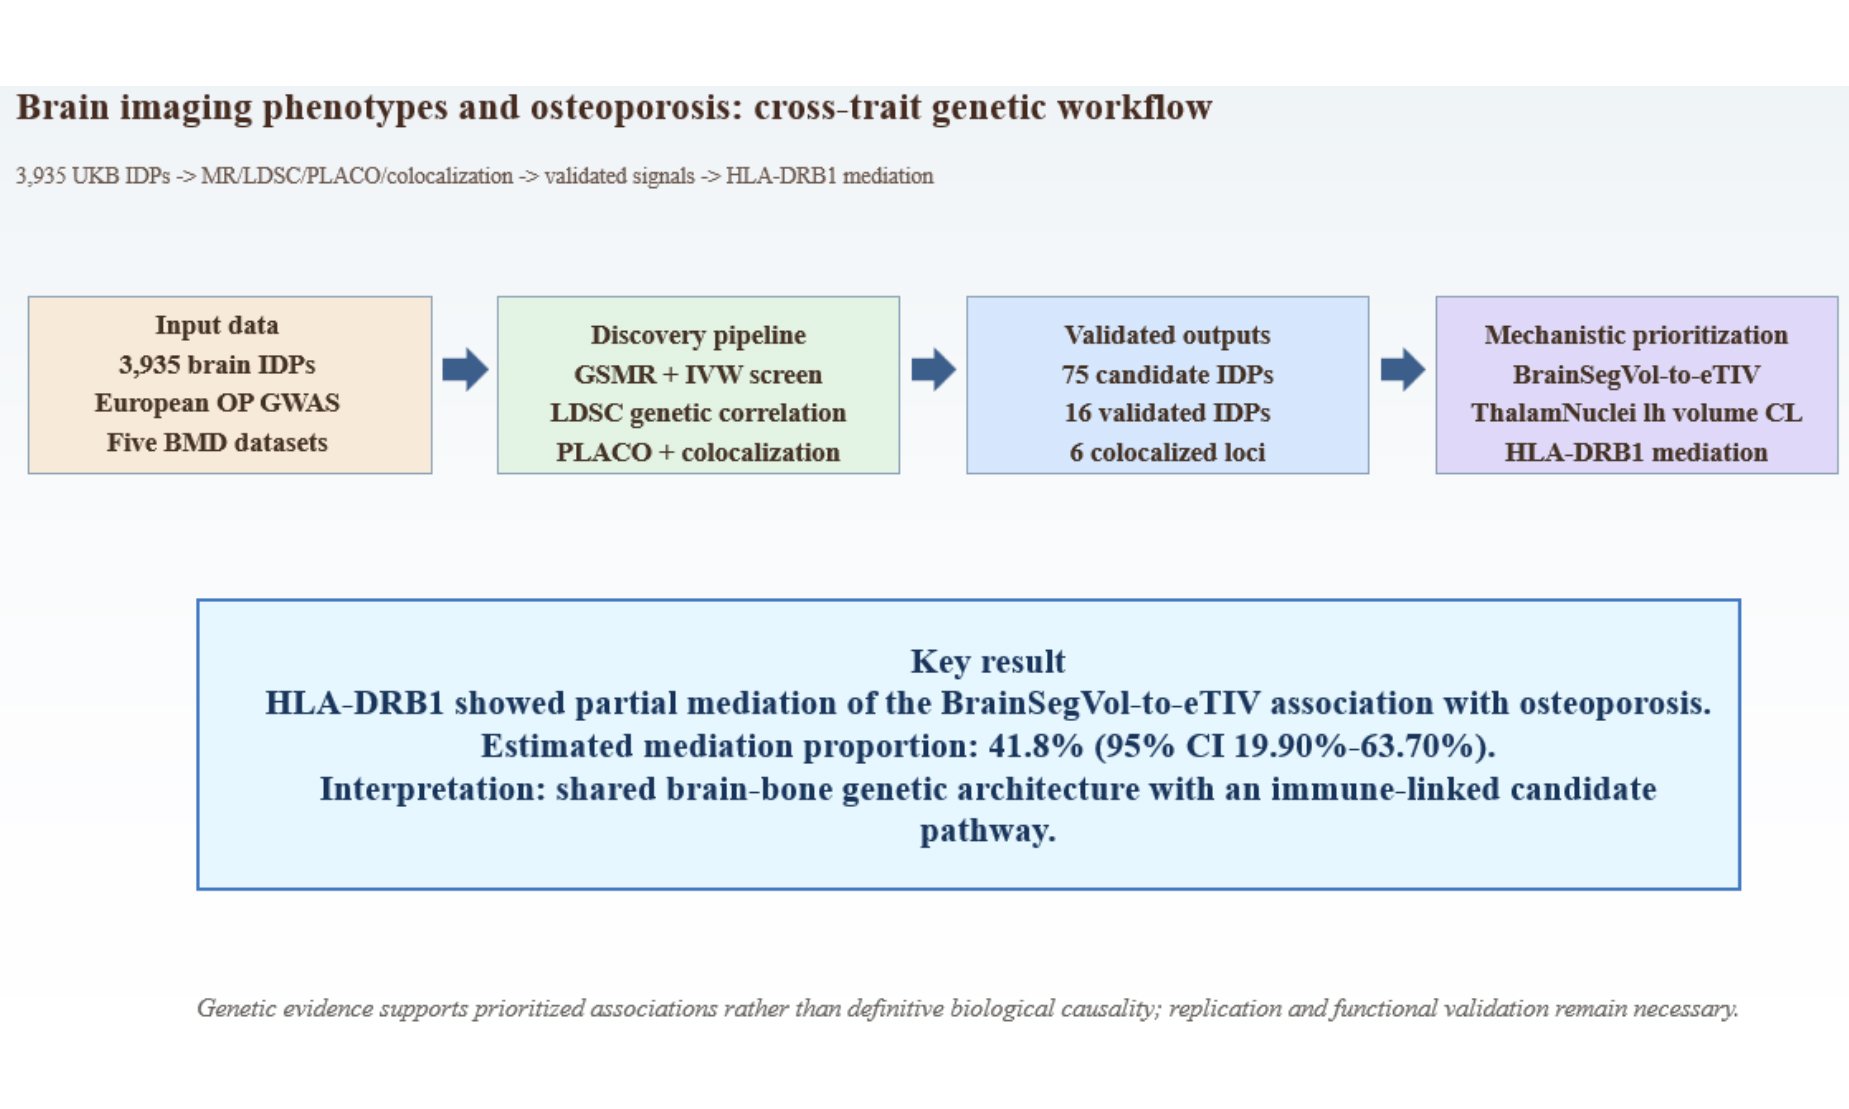
Summary statistics for the 3,935 UK Biobank imaging-derived phenotypes were obtained from the published resource reported by Smith et al.[20]. The dataset integrates raw and processed imaging measures, along with related non-imaging variables, released through the UK Biobank imaging pipeline. The present study used publicly available summary statistics from the GWAS Catalog and related public repositories rather than newly accessed individual-level UK Biobank data. Figure 1 summarizes the overall study workflow and is cited here before the primary Mendelian randomization results. Supplementary Table 1 presents the identifier-to-trait mapping and imaging-location characteristics for the 3,935 imaging-derived phenotypes.
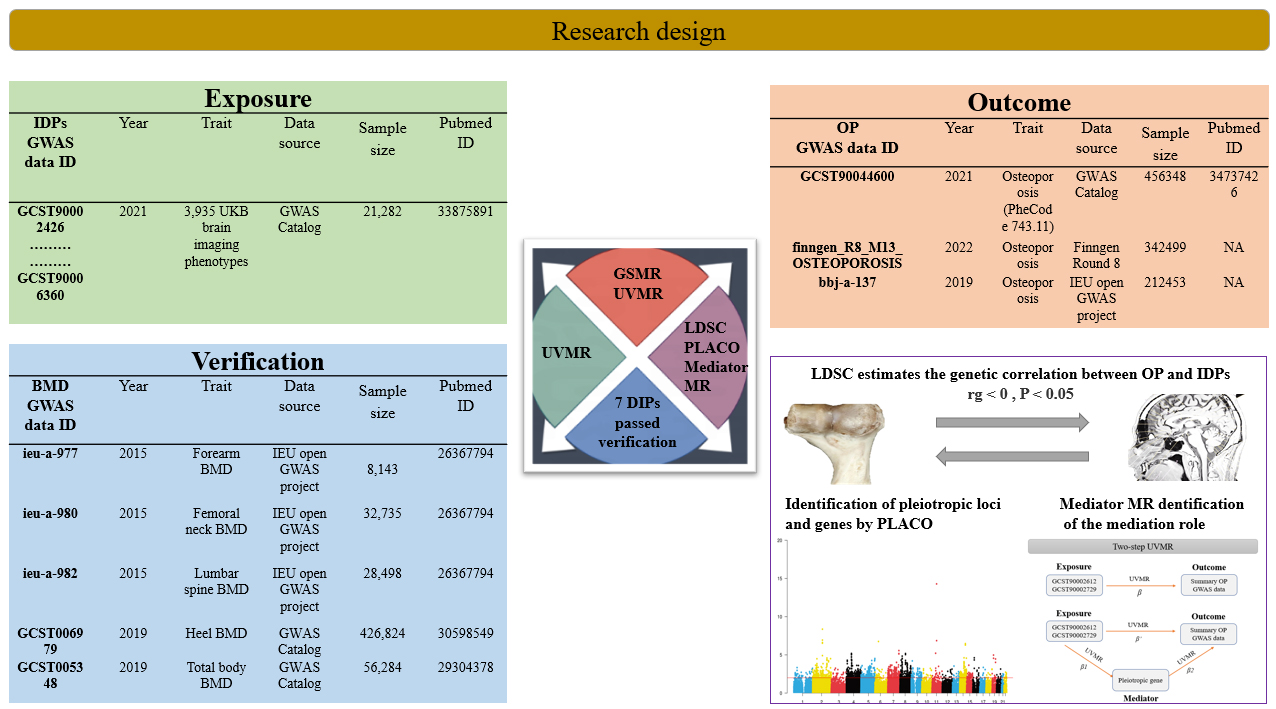
Figure 1. Study workflow. Overview of the analytical pipeline used in this study, including large-scale screening of brain imaging-derived phenotypes, Mendelian randomization analyses, genetic correlation analysis, pleiotropy screening, colocalization analysis, and mediation analysis. The human tissue and imaging illustrations shown in this figure were created entirely by the authors using Adobe Illustrator. DP: Imaging-derived phenotype; GWAS: genome-wide association studies; OP: osteoporosis; BMD: bone mineral density; LDSC: linkage disequilibrium score regression; PLACO: pleiotropic analysis under composite null hypothesis; MR: Mendelian randomization. The human tissue and imaging illustrations shown in this figure were created entirely by the authors using Adobe Illustrator.
Mendelian randomization analysis
Genetic variants were used as instrumental variables to evaluate genetically predicted associations between imaging-derived phenotypes and osteoporosis[21]. Three core assumptions were considered: relevance, independence from major confounders, and the absence of direct paths from the instrumental variables to the outcome outside the exposure[22]. All 3,935 imaging-derived phenotypes were screened as exposures against the meta-analyzed osteoporosis dataset. Generalized summary-data-based Mendelian randomization was used as the primary screening method. Two-sample Mendelian randomization with inverse-variance weighting was then applied to the prioritized imaging-derived phenotypes, followed by weighted median, MR-Egger[23], and Mendelian Randomization Pleiotropy RESidual Sum and Outlier (MR-PRESSO) as sensitivity analyses. Cochran’s Q statistic was used to assess heterogeneity. Reverse Mendelian randomization analyses were subsequently performed with osteoporosis as the exposure and the 16 validated imaging-derived phenotypes as the outcomes. Because several imaging-derived phenotypes required relaxed instrument thresholds and included variants with F statistics below 10, those findings were interpreted as exploratory throughout the manuscript. The extent of sample overlap between UK Biobank-derived imaging GWAS data and the public osteoporosis or bone mineral density datasets could not be quantified directly from the available summary statistics and remains an acknowledged limitation of the MR framework used here.
Linkage disequilibrium score regression analysis
Linkage disequilibrium score regression was used to estimate genetic correlation from summary statistics. For two traits with nonzero genetic correlation, the product of Z-scores across variants is regressed on linkage-disequilibrium scores to estimate the genetic covariance component.
In linkage disequilibrium score regression, sample overlap is expected to affect the intercept more than the slope, reducing but not eliminating concern about overlap-related bias. This property is specific to linkage disequilibrium score regression and should not be extrapolated to Mendelian randomization analyses[24]. Therefore, potential overlap between UK Biobank-derived imaging data and osteoporosis or bone mineral density datasets remains a recognized limitation of the Mendelian randomization framework used in this study.
Pleiotropy and colocalization analysis
Imaging-derived phenotypes with the strongest genetic correlation with osteoporosis were taken forward for pleiotropy analysis under the composite null hypothesis. Single-nucleotide polymorphisms that met genome-wide significance at P < 5 × 10⁻⁸ were classified as pleiotropic candidates. Functional mapping and GWAS annotation were used to identify pleiotropic loci. Bayesian colocalization[25] was then applied to distinguish provisional pleiotropic signals from higher-confidence shared causal regions. The pooled genome-wide association results for osteoporosis were annotated using FUMA[26] with default settings. Within each locus, the nearest gene and the top-ranked Polygenic Priority Score[27] gene within a 500-kb window were recorded for interpretation. Colocalization support was defined as PP.H4 > 0.75.
Mediation analysis
Genes prioritized by pleiotropy analysis under the composite null hypothesis and colocalization were evaluated as candidate mediators of the BrainSegVol-to-eTIV association with osteoporosis. Tissue-specific cis-expression quantitative trait loci were obtained from the GTEx v8 resource. For the primary mediation model, whole-blood cis-expression quantitative trait loci were selected a priori because the working biological hypothesis centered on immune regulation relevant to systemic bone remodeling. Independent whole-blood cis-expression quantitative trait loci that met a false discovery rate threshold of 0.05 or lower were used as instruments in the primary mediation analysis. GTEx served here as the source of tissue-specific instrument panels rather than as the basis for a formal genome-wide tissue-enrichment analysis. Steiger filtering was applied as a directionality screen during instrument selection, whereas reverse-direction testing was evaluated separately. Two-step Mendelian randomization was then used to estimate the effect of BrainSegVol-to-eTIV on each mediator, the effect of each mediator on osteoporosis conditional on BrainSegVol-to-eTIV, and the corresponding indirect effect and mediation proportion. The two-step mediation workflow is shown in Supplementary Figure 1. Confidence intervals for the mediated effects were derived with the delta method[18]. Given the complexity of linkage disequilibrium and pleiotropy in the HLA region, the mediation analysis was interpreted as evidence supporting a putative candidate mediator rather than a confirmed biological mechanism.
Instrument selection
Instrument selection began at P < 5 × 10⁻⁸. When fewer than four variants were available for a given imaging-derived phenotype, a secondary threshold of P < 1 × 10⁻⁶ was used as an exploratory instrument-retention strategy. Variants were clumped at r2 < 0.001 within a 10,000-kb window. Variants absent from the outcome dataset, variants with unresolved strand ambiguity, and palindromic variants with inconsistent allele information were excluded. The GWAS Catalog was queried to remove variants associated with major confounders, including alcohol dependence, body fat percentage, body mass index, body height, lean body mass, and body weight, as summarized in Supplementary Table 2. Instrument strength was evaluated with F statistics greater than 10.
Statistical analysis
All analyses were conducted using TwoSampleMR, gsmr2, GenomicSEM, MRPRESSO, plinkbinr, ieugwasr, dplyr, coloc, and base packages in R version 4.4.1. Multiple-testing control was applied in a staged manner across the analytical pipeline. We conducted an initial discovery screen of imaging-derived phenotypes. We retained traits that showed nominal significance, with concordant directions across generalized summary-data-based Mendelian randomization and inverse-variance-weighted analyses. False discovery rate correction[28] was then applied at the validation stage, and prioritized traits were required to retain support across the osteoporosis and bone mineral density analyses. Pleiotropic loci were defined at the conventional genome-wide significance threshold of P < 5 × 10⁻⁸, and colocalization required PP.H4 > 0.75. For reverse Mendelian randomization, false discovery rate correction was applied across the 16 primary inverse-variance-weighted tests.
RESULTS
Mendelian randomization analyses
Using the meta-analyzed osteoporosis dataset as the outcome, discovery Mendelian randomization screening identified 180 imaging-derived phenotypes with nominal evidence of association. The full GSMR screening results are provided in Supplementary Table 3. Seventy-five imaging-derived phenotypes showed concordant support across generalized summary-data-based Mendelian randomization and inverse-variance-weighted analyses and were retained for validation, as summarized in Supplementary Table 4. After cross-validation against five bone mineral density traits with false discovery rate control, 16 imaging-derived phenotypes remained supported, and the confirmatory MR results across the five bone mineral density traits are presented in Supplementary Table 5. Seven imaging-derived phenotypes showed evidence of genetic correlation with osteoporosis, as summarized in Supplementary Table 6. Detailed PLACO and colocalization results are summarized in Supplementary Table 7. Instrument-strength assessment for the 16 validated imaging-derived phenotypes (IDPs) is summarized in Supplementary Table 8, and SNP-level instrument parameters are provided in Supplementary Table 9. Thirteen of the 16 validated IDPs showed low weak-instrument risk, whereas three traits, specifically GCST90006352, GCST90006346, and GCST90004325, used the relaxed threshold and included at least one SNP with an F statistic below 10. We therefore treated these findings as exploratory in the subsequent interpretation. Figure 2A summarizes the screening workflow, and Figure 2B shows the outcome-specific effect estimates. Seven imaging-derived phenotypes were validated in forearm bone mineral density, seven in femoral neck bone mineral density, seven in lumbar spine bone mineral density, three in total body bone mineral density, and four in heel bone mineral density. BrainSegVol-to-eTIV (GCST90002612) and ThalamNuclei lh volume CL (GCST90002729) showed the most consistent pattern across osteoporosis and all five bone mineral density outcomes [Table 1].
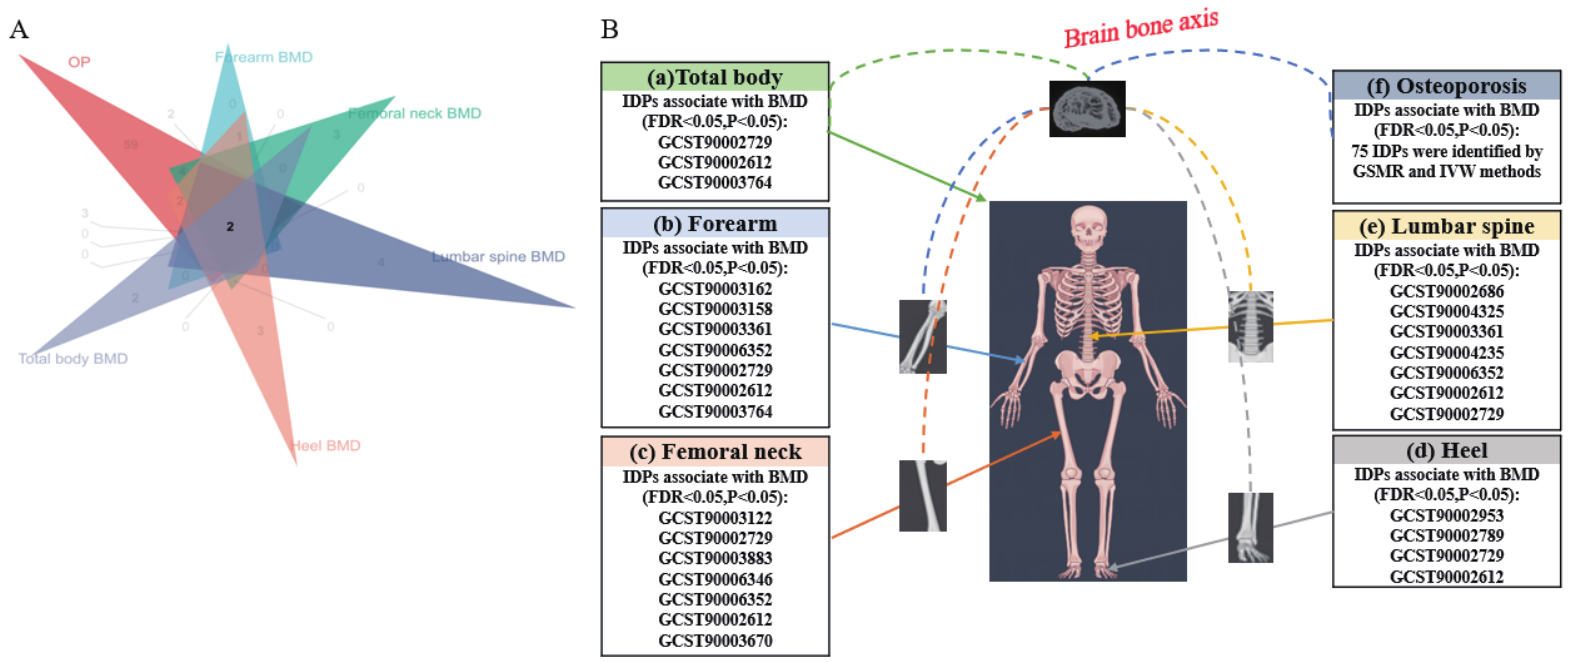
Figure 2. Mendelian randomization screening and validation of imaging-derived phenotypes associated with osteoporosis and bone mineral density. (A) Venn diagram summarizing significant findings after discovery and validation; (B) Panels a to f show effect estimates for validated imaging-derived phenotypes across total body bone mineral density, forearm bone mineral density, femoral neck bone mineral density, heel bone mineral density, lumbar spine bone mineral density, and osteoporosis. The imaging illustration was created entirely by the authors using Adobe Illustrator. IDP: Imaging-derived phenotype; FDR: false discovery rate; BMD: bone mineral density.
Summary of MR results for the 16 IDPs as exposure with OP and BMD as outcomes
| Exposure ID/trait | Outcome | GSMR (Main analysis) | Inverse variance weighted | |||||
| beta | pval | OR (95% CI) | beta | pval | OR (95% CI) | FDR | ||
| GCST90003162 aparc-pial lh area postcentral | OP | -0.16 | 0.01 | 0.84(0.73,0.97) | -0.15 | 0.03 | 0.86(0.74,0.99) | 0.02 |
| Forearm BMD | -0.42 | 0.03 | 0.65(0.43,0.98) | 0.02 | ||||
| GCST90003158 aparc-pial lh area parsopercularis | OP | 0.23 | 0.01 | 1.26(1.05,1.51) | 0.23 | 0.0007 | 1.27(1.11,1.46) | 0.03 |
| Forearm BMD | | -0.40 | 0.04 | 0.67(0.45,0.99) | 0.03 | |||
| GCST90003361 aparc-a2009s lh area S-parieto-occipital | OP | 0.22 | 0.001 | 1.25(1.09,1.44) | 0.17 | 0.009 | 1.19(1.04,1.35) | 0.04 |
| Forearm BMD | -0.28 | 0.02 | 0.75(0.58,0.96) | 0.02 | ||||
| Lumbar spine BMD | -0.29 | 0.01 | 0.74(0.59,0.94) | 0.02 | ||||
| GCST90006352 QC SWI-to-T1 linear alignment discrepancy | OP | 0.28 | 0.001 | 1.34(1.12,1.59) | 0.29 | 0.0006 | 1.35(1.13,1.60) | 0.02 |
| Forearm BMD | -0.45 | 0.003 | 0.63(0.47,0.86) | 0.02 | ||||
| Femoral neck BMD | -0.24 | 0.001 | 0.78(0.68,0.91) | 0.02 | ||||
| Lumbar spine BMD | -0.23 | 0.008 | 0.79(0.67,0.94) | 0.02 | ||||
| GCST90002729 ThalamNuclei lh volume CL | OP | -0.18 | 0.008 | 0.83(0.71,0.97) | -0.16 | 0.01 | 0.85(0.74,0.97) | 0.02 |
| Forearm BMD | 0.36 | 0.03 | 1.44(1.03,2.02) | 0.02 | ||||
| Femoral neck BMD | 0.17 | 0.04 | 1.19(1.01,1.41) | 0.02 | ||||
| Lumbar spine BMD | 0.22 | 0.04 | 1.25(1.01,1.56) | 0.02 | ||||
| Total body BMD | 0.14 | 0.01 | 1.16(1.03,1.30) | 0.03 | ||||
| Heel BMD | 0.03 | 0.03 | 1.04(1.00,1.07) | 0.03 | ||||
| GCST90002612 aseg global volume-ratio BrainSegVol-to-eTIV | OP | -0.17 | 1.3E-07 | 0.84(0.73,0.97) | -0.14 | 0.001 | 0.87(0.76,0.99) | 0.02 |
| Forearm BMD | 0.51 | 0.01 | 1.67(1.10,2.53) | 0.03 | ||||
| Femoral neck BMD | 0.16 | 0.03 | 1.18(1.01,1.37) | 0.03 | ||||
| Lumbar spine BMD | 0.29 | 0.01 | 1.35(1.06,1.71) | 0.03 | ||||
| Total body BMD | 0.13 | 0.03 | 1.14(1.00,1.30) | 0.03 | ||||
| Heel BMD | 0.05 | 0.04 | 1.05(1.00,1.10) | 0.02 | ||||
| GCST90003764 aseg lh intensity Lateral-Ventricle | OP | -0.18 | 0.01 | 0.83(0.73,0.96) | -0.16 | 0.02 | 0.84(0.73,0.98) | 0.03 |
| Total body BMD | 0.21 | 0.04 | 1.23(1.01,1.51) | 0.04 | ||||
| GCST90003122 aparc-Desikan rh area parahippocampal | OP | 0.15 | 0.04 | 1.17(1.00,1.36) | 0.17 | 0.008 | 1.19(1.05,1.35) | 0.02 |
| Femoral neck BMD | -0.30 | 0.01 | 0.74(0.58,0.95) | 0.02 | ||||
| GCST90003883 IDP dMRI TBSS FA Corticospinal tract R | OP | -0.18 | 0.02 | 0.83(0.71,0.97) | -0.19 | 0.02 | 0.83(0.70,0.98) | 0.02 |
| Femoral neck BMD | 0.26 | 0.008 | 1.31(1.07,1.59) | 0.04 | ||||
| GCST90006346 QC T1-to-standard nonlinear alignment discrepancy | OP | 0.20 | 0.0005 | 1.22(1.09,1.37) | 0.20 | 0.0007 | 1.23(1.09,1.39) | 0.02 |
| Femoral neck BMD | -0.17 | 0.008 | 0.84(0.74,0.96) | 0.02 | ||||
| GCST90003670 aparc-a2009s lh thickness S-precentral-inf-part | OP | -0.17 | 0.03 | 0.84(0.71,0.99) | -0.20 | 0.007 | 0.81(0.70,0.95) | 0.03 |
| Femoral neck BMD | -0.21 | 0.02 | 0.80(0.66,0.97) | 0.04 | ||||
| GCST90002686 HippSubfield lh volume HATA | OP | -0.18 | 0.01 | 0.83(0.71,0.97) | -0.12 | 0.008 | 0.89(0.80,0.98) | 0.02 |
| Lumbar spine BMD | -0.24 | 0.03 | 0.78(0.62,0.98) | 0.02 | ||||
| GCST90004325 IDP dMRI ProbtrackX L3 unc | OP | -0.17 | 0.004 | 0.84(0.75,0.95) | -0.12 | 0.02 | 0.88(0.79,0.98) | 0.02 |
| Lumbar spine BMD | -0.23 | 0.03 | 0.79(0.64,0.98) | 0.02 | ||||
| GCST90004235 IDP dMRI ProbtrackX MD mcp | OP | -0.36 | 0.007 | 0.69(0.53,0.91) | -0.26 | 0.03 | 0.77(0.60,0.98) | 0.02 |
| Lumbar spine BMD | -0.22 | 0.01 | 0.79(0.66,0.96) | 0.02 | ||||
| GCST90002953 aparc-a2009s lh volume G-precentral | OP | -0.12 | 0.04 | 0.88(0.78,1.00) | -0.10 | 0.04 | 0.90(0.82,1.00) | 0.02 |
| Heel BMD | 0.05 | 0.02 | 1.06(1.01,1.11) | 0.02 | ||||
| GCST90002789 aparc-Desikan lh volume postcentral | OP | -0.15 | 0.01 | 0.86(0.75,0.97) | -0.13 | 0.01 | 0.87(0.79,0.97) | 0.02 |
| Heel BMD | 0.06 | 0.007 | 1.07(1.02,1.12) | 0.06 | 0.006 | 1.07(1.02,1.12) | ||
Linkage disequilibrium score regression analyses
We used linkage disequilibrium score regression to evaluate genetic correlation between osteoporosis and the 16 validated imaging-derived phenotypes. A nominal significance level of P < 0.05 was used as the screening threshold in this step. Seven imaging-derived phenotypes showed evidence of genetic correlation with osteoporosis [Figure 3 and Supplementary Table 6], including ()) aseg global volume-ratio BrainSegVol-to-eTIV (id: GCST90002612); (2) HippSubfield lh volume HATA (id: GCST90002686); (3) ThalamNuclei lh volume CL (id: GCST90002729); (4) aparc-Desikan lh volume postcentral (id: GCST90002789); (5) aparc-a2009s lh volume G-precentral (id: GCST90002953); (6) aparc-pial lh area postcentral (id: GCST90003162); and (7) aparc-a2009s lh thickness S-precentral-inf-part (id: GCST90003670).
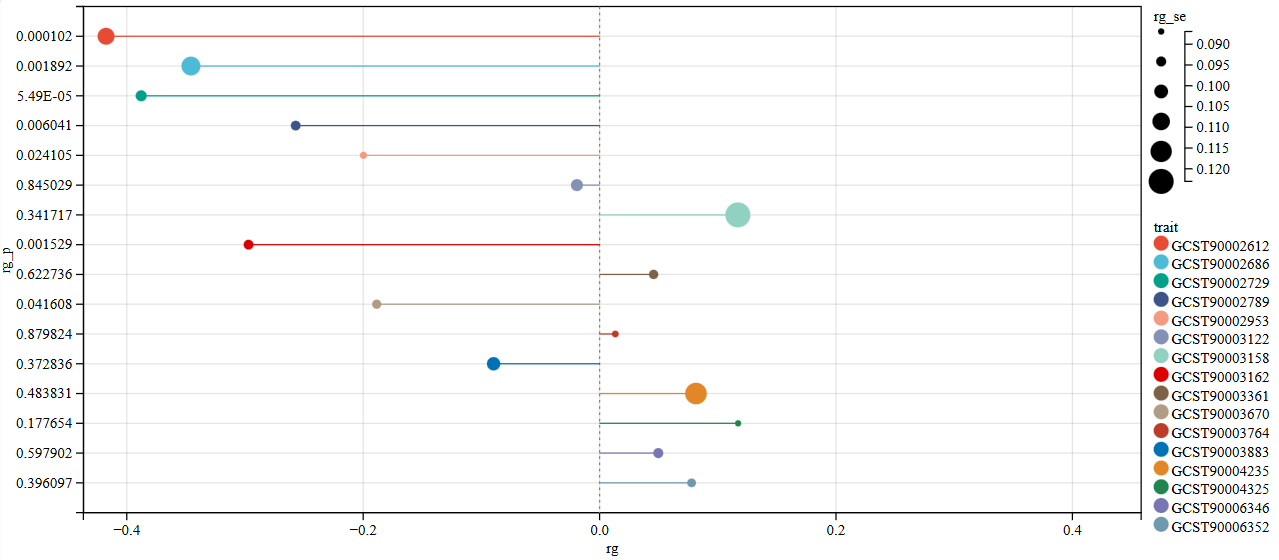
Figure 3. LDSC genetic correlation results between brain structure and OP. rg represents the degree of correlation, and rg_p < 0.05 indicates a genetic correlation. LDSC: linkage disequilibrium score regression; OP: osteoporosis.
Pleiotropic loci and colocalization results
BrainSegVol-to-eTIV showed convergent support in the Mendelian randomization and linkage disequilibrium score regression analyses. We therefore conducted pleiotropy screening between this phenotype and osteoporosis. The quantile-quantile plot showed no early deviation from the null distribution [Supplementary Figure 2]. Pleiotropy analysis under the composite null hypothesis identified 40 loci at P < 5 × 10⁻⁸ [Figure 4]. Six loci showed strong colocalization support with PP.H4 > 0.75, as illustrated in Figure 5A-F. The pleiotropic loci and prioritized genes are summarized in Table 2. Detailed PLACO and colocalization results are summarized in Supplementary Table 7. The remaining loci showed weaker evidence and require cautious interpretation.
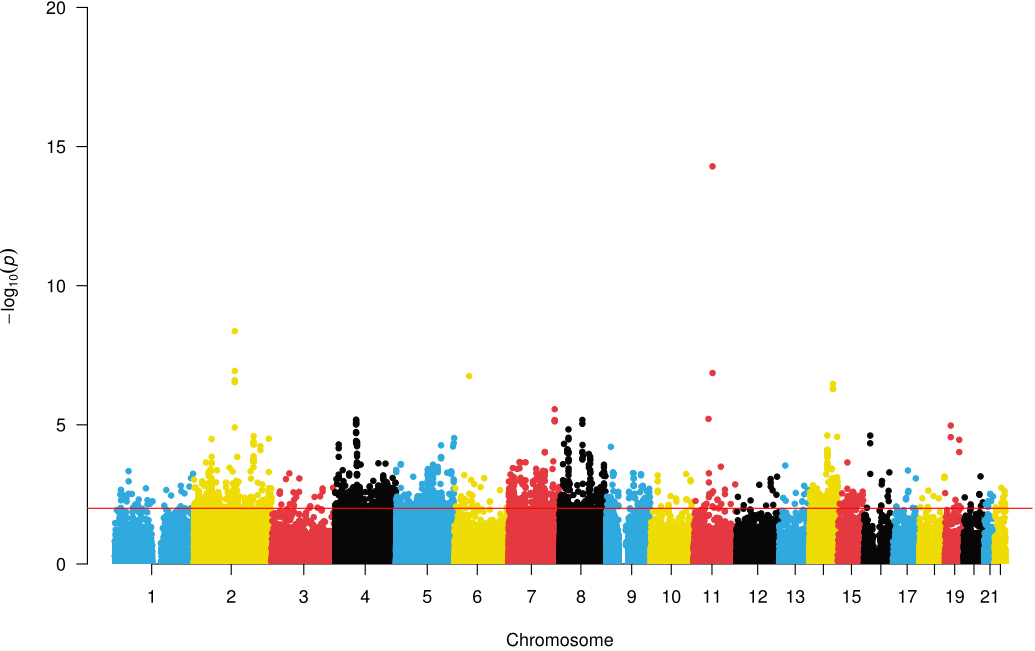
Figure 4. A Manhattan plot showed the correlation between SNPs and common genetic loci. Manhattan plots illustrating the -log10(P-value) connections for each SNP from the GWAS analysis are shown on the y-axis as a function of chromosomal position. The red dashed line represents the threshold for genome-wide significance. SNP: single-nucleotide polymorphism; GWAS: genome-wide association studies.
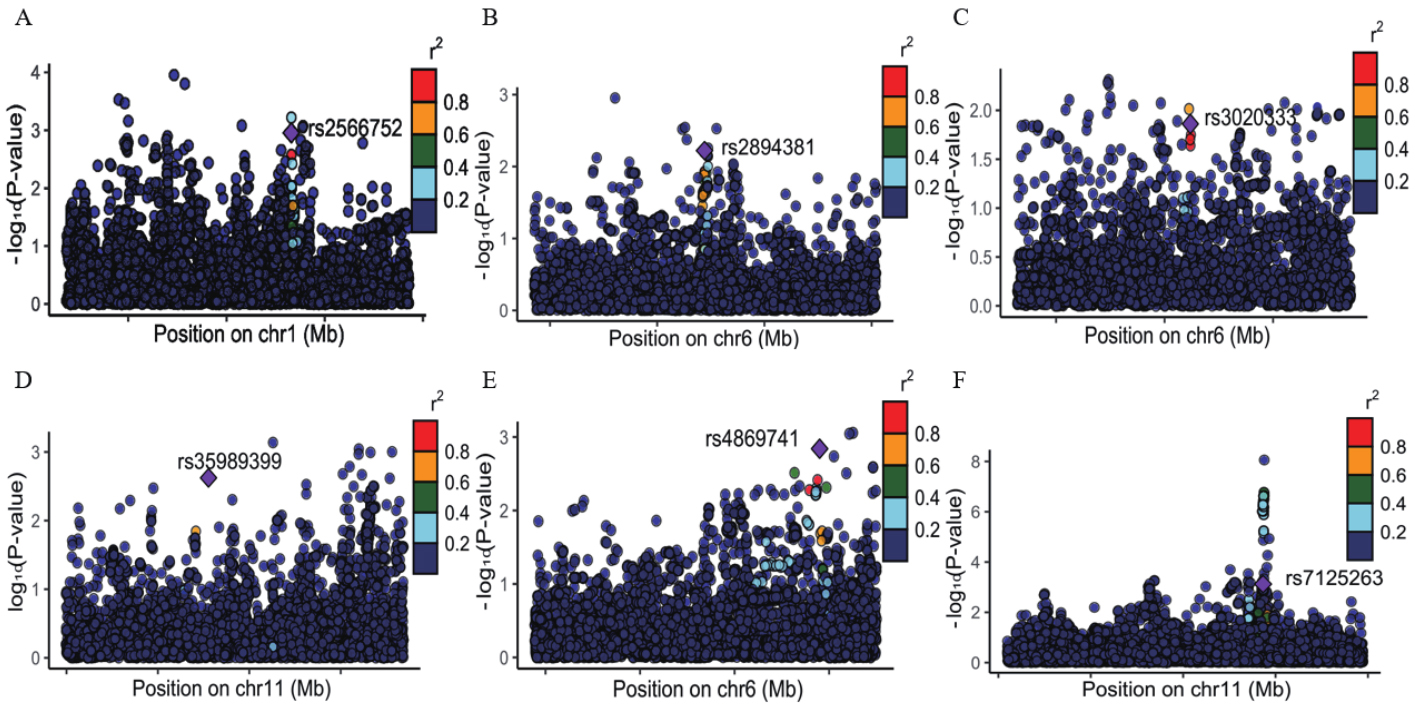
Figure 5. Regional association plots for the six loci with strong colocalization support. (A-F) correspond to rs2566752, rs2894381, rs3020333, rs35989399, rs4869741, and rs7125263, respectively.
Determination of pleiotropic loci and genes for volume-ratio BrainSegVol-to-eTIV and OP
| rsID | Chr | Pos | Nearest gene | PoPs gene | Pops_score | PP.H4.abf | adjusted_P-values |
| rs2566752 | 1 | 68191014 | IL12RB2 | IL12RB2 | 0.877 | 0.763 | 3.73E-13 |
| rs2894381 | 6 | 32714451 | HLA-DRB1 | HLA-DRB1 | 0.805 | 0.874 | 3.50E-13 |
| rs3020333 | 6 | 151689119 | ESR1 | ESR1 | 0.254 | 0.839 | 6.06E-10 |
| rs35989399 | 11 | 68622433 | PPP6R3 | PPP6R3 | 0.313 | 0.897 | 3.75E-13 |
| rs4869741 | 6 | 151585158 | PLEKHG1 | PLEKHG1 | 0.586 | 0.806 | 3.69E-12 |
| rs7125263 | 11 | 112564656 | NCAM1 | NCAM1 | 0.277 | 0.790 | 9.02E-17 |
Mediation analysis
We next evaluated whether the pleiotropic genes prioritized by pleiotropy analysis under the composite null hypothesis and colocalization contributed to the association between BrainSegVol-to-eTIV and osteoporosis. Six genes were evaluated in the mediation framework: IL12RB2, HLA-DRB1, ESR1, PPP6R3, PLEKHG1, and NCAM1. Gene-specific Mendelian randomization results for these pleiotropic candidates are shown in Supplementary Figure 3. Among them, using whole-blood cis-expression quantitative trait loci derived from GTEx v8, HLA-DRB1 showed evidence of partial mediation, with an estimated mediation proportion of 41.8% and a 95% confidence interval of 19.90% to 63.70%. The corresponding Mendelian randomization diagnostics are shown in Figure 6A-C; the colocalization result is shown in Figure 6D; and the indirect-effect estimate is summarized in Figure 6E.
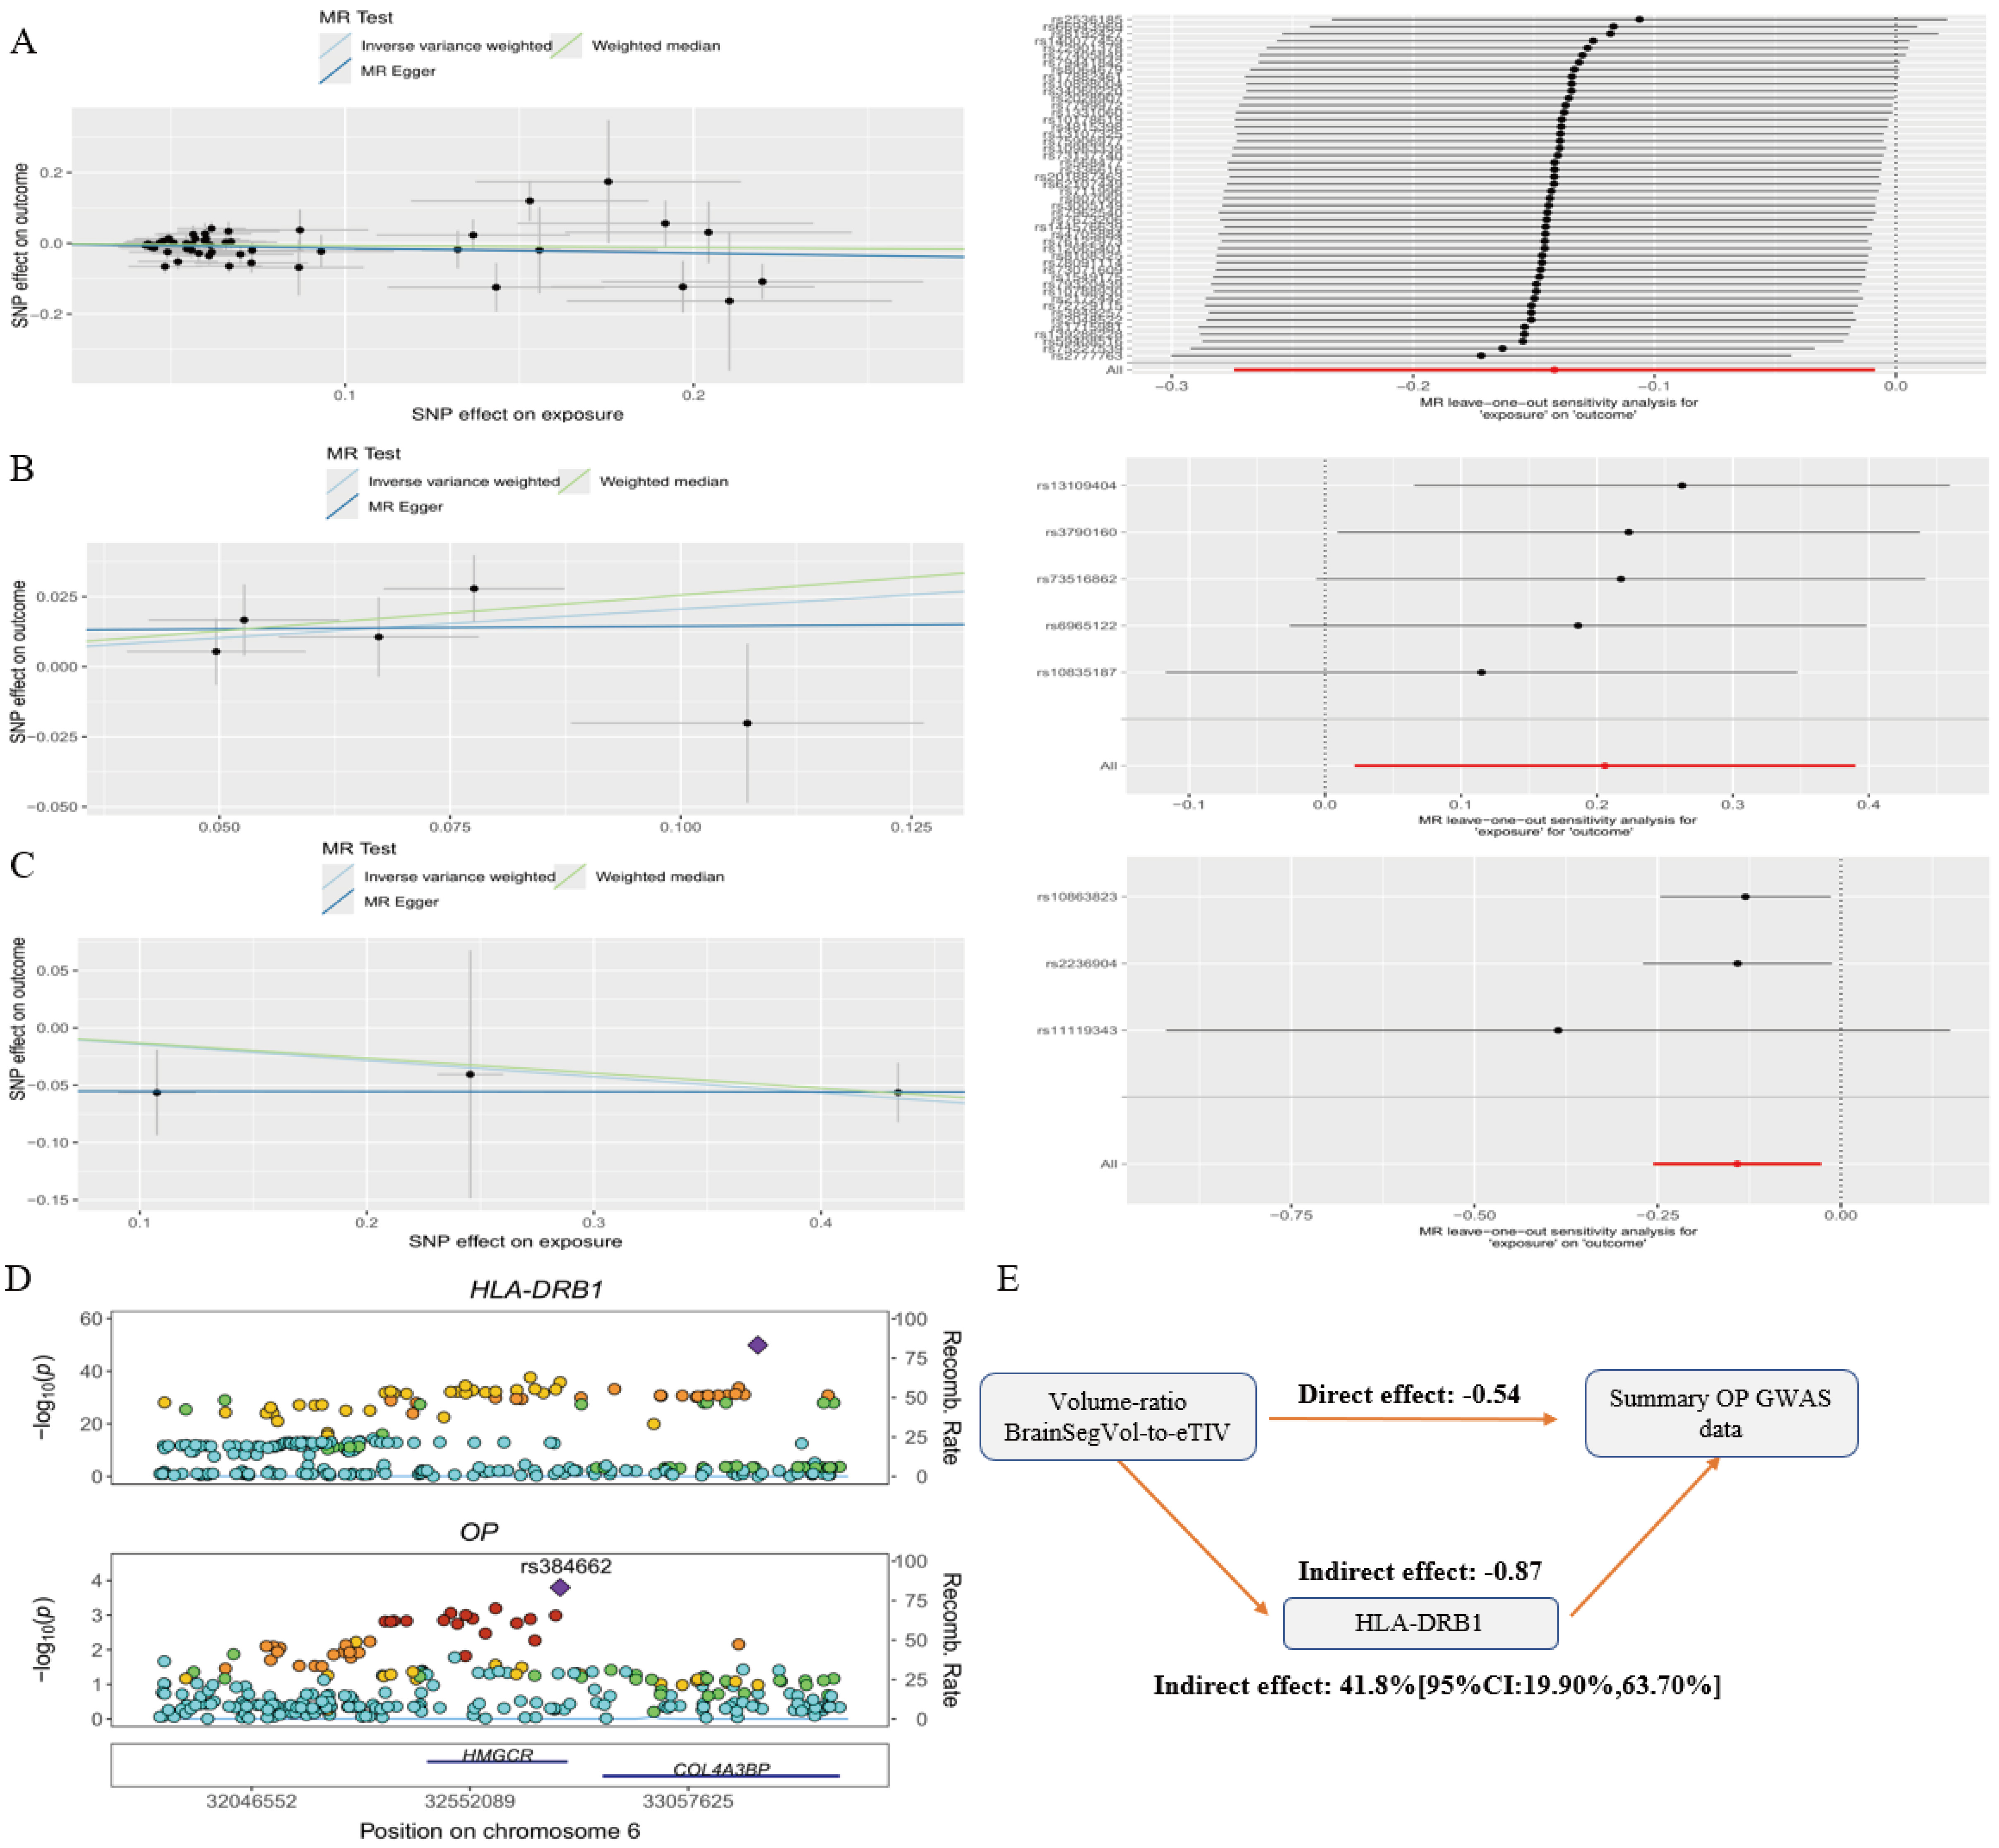
Figure 6. Mediation analysis centered on BrainSegVol-to-eTIV and HLA-DRB1. (A) Scatter plot and leave-one-out analysis for BrainSegVol-to-eTIV on OP; (B) Scatter plot and leave-one-out analysis for BrainSegVol-to-eTIV on HLA-DRB1; (C) Scatter plot and leave-one-out analysis for HLA-DRB1 on OP; (D) Colocalization result for HLA-DRB1; (E) Indirect-effect estimate and mediation proportion for the HLA-DRB1 pathway. MR: Mendelian randomization; HLA-DRB1: human leukocyte antigen - DRB1; OP: osteoporosis; GWAS: genome-wide association studies.
Reverse Mendelian randomization and sensitivity analyses
Reverse Mendelian randomization analyses with osteoporosis as the exposure and the 16 validated IDPs as the outcomes are summarized in Supplementary Table 10. None of the reverse analyses remained significant after false discovery rate correction. Nominal inverse variance weighted associations were observed for QC SWI-to-T1 linear alignment discrepancy, aseg lh intensity Lateral-Ventricle, QC T1-to-standard nonlinear alignment discrepancy, and HippSubfield lh volume HATA, but none survived multiple-testing correction. Detailed sensitivity diagnostics for the 16 primary IDP-to-osteoporosis analyses are summarized in Supplementary Table 11 and Supplementary Figures 4-48. MR-Egger intercept tests and HEIDI tests did not indicate material directional pleiotropy or marked heterogeneity across the 16 analyses. Fourteen analyses were judged robust, whereas the two QC-related traits GCST90006352 and GCST90006346 showed minor heterogeneity. In both cases, the listed candidate outlier variants did not yield significant MR-PRESSO distortion tests, and post-removal Cochran’s Q statistics were attenuated.
DISCUSSION
Current analyses support shared genetic architecture between selected brain imaging-derived phenotypes and osteoporosis. BrainSegVol-to-eTIV and left thalamic volume CL remained the most consistent statistical signals across the discovery and validation stages. Linkage disequilibrium score regression and pleiotropy analysis, under the composite null hypothesis, provided convergent support at the genome-wide level. However, the evidence was not uniform across all stages of the pipeline, and the present results do not establish a mechanistic brain-bone axis.
BrainSegVol-to-eTIV reflects whole-brain volume relative to total intracranial volume and represents a broad structural marker of relative brain atrophy or preservation[29]. The phenotype is inherently nonspecific and may capture aging-related or systemic processes rather than a direct neurobiological pathway influencing bone metabolism. Experimental and clinical work has implicated central neural pathways in bone remodeling, particularly hypothalamic and sympathetic regulation of osteoblast and osteoclast activity[30-32]. Taken together, the present genetic findings are consistent with shared biological influences between brain structure and osteoporosis, but they do not demonstrate direct mechanistic causality.
Among the candidate mediators, HLA-DRB1 showed the strongest statistical evidence in this dataset. Previous studies have reported associations between HLA-DRB1 alleles and brain volume in multiple sclerosis[33] and protective effects against age-related gray matter reduction[34]. Because HLA-DRB1 encodes a major histocompatibility complex class II molecule involved in antigen presentation, immune activation may shift the receptor activator of nuclear factor kappa B ligand-to-osteoprotegerin balance toward osteoclastogenesis and bone resorption. Chronic neuroinflammatory states associated with reduced brain volume may also alter systemic immune profiles. The HLA region is characterized by complex linkage disequilibrium and extensive pleiotropy, so the present evidence supports HLA-DRB1 as a putative or candidate mediator rather than as a confirmed biological mediator. Whole-blood cis-eQTLs should also be interpreted cautiously in the context of a proposed brain-related mechanism.
Interpretation of the broader set of imaging-derived phenotypes requires caution. Several traits showed non-uniform patterns across osteoporosis and individual bone mineral density outcomes, possibly due to trait-specific biology, limited instrument precision, or residual pleiotropy. In particular, GCST90006352, GCST90006346, and GCST90004325 relied on the relaxed instrument threshold, and each included at least one SNP with an F statistic below 10 in the validated instrument-strength assessment. Given the polygenic and low-effect-size nature of many imaging phenotypes, these findings should be regarded as exploratory. In two-sample Mendelian randomization, weak-instrument bias is expected to attenuate estimates toward the null. In contrast, overlap between exposure and outcome samples can shift inverse-variance-weighted estimates toward the observational association. The corresponding effect sizes should therefore be interpreted cautiously rather than as confirmed causal magnitudes.
Although pleiotropy analysis under the composite null hypothesis identified 40 loci at genome-wide significance, only 6 loci reached the colocalization threshold of PP.H4 > 0.75. The remaining 34 loci should therefore be interpreted as provisional pleiotropic signals that currently lack strong evidence for a shared causal variant. This discrepancy is compatible with the possibility that overlapping association signals may arise from linkage disequilibrium between distinct causal variants rather than from a single shared variant. Additional fine-mapping and functional follow-up will be required before these provisional loci can be prioritized with confidence.
Ancestry restriction remains a major limitation. All genome-wide association resources used in this study were derived from European-ancestry populations. Allele frequencies and linkage disequilibrium structure, particularly in the human leukocyte antigen region, differ across populations and could alter both colocalization and mediation results. Participant overlap between the UK Biobank imaging resource and the public osteoporosis or bone mineral density datasets also could not be quantified directly from the released summary statistics. Although the Methods section notes that linkage disequilibrium score regression intercept properties cannot fully rule out overlap bias in Mendelian randomization, the cross-trait linkage disequilibrium score regression intercept for osteoporosis versus BrainSegVol-to-eTIV was 5 × 10⁻⁴ with a standard error of 0.0049. The estimate argues against marked systematic inflation in the summary statistics, but overlap-related bias cannot be ruled out, and causal interpretation should therefore remain cautious. Functional validation is also lacking, and the present evidence should be followed by immune-cell, bone-cell, and multi-ethnic replication studies.
In summary, genome-wide cross-trait analyses suggest shared genetic architecture between selected brain imaging-derived phenotypes and osteoporosis. BrainSegVol-to-eTIV, left thalamic volume CL, and HLA-DRB1 emerged as prioritized statistical signals. These findings provide a basis for future mechanistic studies, but by themselves do not establish a direct brain-bone pathway.
DECLARATIONS
Authors’ contributions
Study conception and design: Kuang J, Sun J, Wei Z
Formal analysis and data interpretation: Kuang J, Lv S
Data curation and statistical validation: Lv S
Methodology and results interpretation: Wei Z
Supervision: Sun J, Wei Z
Manuscript drafting: Kuang J
Manuscript revision: Lv S, Sun J, Wei Z
All authors read and approved the final manuscript.
Availability of data and materials
The summary statistics analyzed in this study were obtained from publicly available genome-wide association resources, including the GWAS Catalog, FinnGen, the IEU Open GWAS project, GEFOS, and the published UK Biobank imaging-derived phenotype resource. The corresponding sources are cited in the Methods section. Additional processed results generated during this study are presented in the manuscript and Supplementary Materials or are available from the corresponding author upon reasonable request.
AI and AI-assisted tools statement
Not applicable.
Financial support and sponsorship
Not applicable.
Conflicts of interest
Wei Z is the Editor-in-Chief of Science Orthopedics. Wei Z was not involved in any steps of the editorial process, notably including reviewer selection, manuscript handling, and decision-making. The other authors declare that there are no conflicts of interest.
Ethical approval and consent to participate
This study used publicly available summary statistics from the GWAS Catalog, FinnGen, the IEU Open GWAS project, GEFOS, and the published UK Biobank imaging-derived phenotype resource. Additional institutional ethics approval for this secondary analysis was not required.
Consent for publication
Not applicable.
Copyright
© The Author(s) 2026.
Supplementary Materials
REFERENCES
1. Che L, Wang Y, Sha D, et al. A biomimetic and bioactive scaffold with intelligently pulsatile teriparatide delivery for local and systemic osteoporosis regeneration. Bioact Mater. 2023;19:75-87.
2. Subarajan P, Arceo-mendoza RM, Camacho PM. Postmenopausal osteoporosis. Endocrinol Metab Clin North Am. 2024;53:497-512.
3. Maryanovich M, Takeishi S, Frenette PS. Neural regulation of bone and bone marrow. Cold Spring Harb Perspect Med. 2018;8:a031344.
4. Qin W, Bauman WA, Cardozo CP. Evolving concepts in neurogenic osteoporosis. Curr Osteoporos Rep. 2010;8:212-8.
5. Kumar S, Chandnani A, Aung NH, et al. Alzheimer’s disease and its association with bone health: a case-control study. Cureus. 2021;13:e13772.
6. Pignolo A, Mastrilli S, Davì C, et al. Vitamin D and Parkinson’s disease. Nutrients. 2022;14:1220.
7. Adams HHH, Hibar DP, Chouraki V, et al. Novel genetic loci underlying human intracranial volume identified through genome-wide association. Nat Neurosci. 2016;19:1569-82.
8. Douaud G, Menke RAL, Gass A, et al. Brain microstructure reveals early abnormalities more than two years prior to clinical progression from mild cognitive impairment to Alzheimer’s disease. J. Neurosci. 2013;33:2147-55.
9. Kanis JA. Diagnosis of osteoporosis and assessment of fracture risk. The Lancet. 2002;359:1929-36.
10. Bai W, Wang L, Ying Z, et al. Identification of PIEZO1 polymorphisms for human bone mineral density. Bone. 2020;133:115247.
11. Ma B, Li C, Pan J, et al. Causal associations of anthropometric measurements with fracture risk and bone mineral density: a mendelian randomization study. J Bone Miner Res. 2020;36:1281-7.
12. Choi KW, Chen C, Stein MB, et al. ; Major Depressive Disorder Working Group of the Psychiatric Genomics Consortium. Assessment of bidirectional relationships between physical activity and depression among adults: a 2-sample mendelian randomization study. JAMA Psychiatry. 2019;76:399.
13. Zhu Z, Zheng Z, Zhang F, et al. Causal associations between risk factors and common diseases inferred from GWAS summary data. Nat Commun. 2018;9:224.
14. Bulik-sullivan BK, Loh P, Finucane HK, et al. ; Schizophrenia Working Group of the Psychiatric Genomics Consortium. LD score regression distinguishes confounding from polygenicity in genome-wide association studies. Nat Genet. 2015;47:291-5.
15. Gong W, Guo P, Li Y, et al. Role of the gut-brain axis in the shared genetic etiology between gastrointestinal tract diseases and psychiatric disorders: a genome-wide pleiotropic analysis. JAMA Psychiatry. 2023;80:360.
16. Lu H, Qiao J, Shao Z, Wang T, Huang S, Zeng P. A comprehensive gene-centric pleiotropic association analysis for 14 psychiatric disorders with GWAS summary statistics. BMC Med. 2021;19:314.
17. Ray D, Chatterjee N. A powerful method for pleiotropic analysis under composite null hypothesis identifies novel shared loci between type 2 diabetes and prostate cancer. PLoS Genet. 2020;16:e1009218.
18. Carter AR, Sanderson E, Hammerton G, et al. Mendelian randomisation for mediation analysis: current methods and challenges for implementation. Eur J Epidemiol. 2021;36:465-78.
19. Willer CJ, Li Y, Abecasis GR. METAL: fast and efficient meta-analysis of genomewide association scans. Bioinformatics. 2010;26:2190-1.
20. Smith SM, Douaud G, Chen W, et al. An expanded set of genome-wide association studies of brain imaging phenotypes in UK Biobank. Nat Neurosci. 2021;24:737-45.
21. Nitsch D, Molokhia M, Smeeth L, Destavola BL, Whittaker JC, Leon DA. Limits to causal inference based on mendelian randomization: a comparison with randomized controlled trials. Am J Epidemiol. 2006;163:397-403.
22. Davies NM, Holmes MV, Davey Smith G. Reading Mendelian randomisation studies: a guide, glossary, and checklist for clinicians. BMJ. 2018:k601.
23. Burgess S, Thompson SG. Interpreting findings from Mendelian randomization using the MR-Egger method. Eur J Epidemiol. 2017;32:377-89.
24. Bulik-sullivan B, Finucane HK, Anttila V, et al. ; Genetic Consortium for Anorexia Nervosa of the Wellcome Trust Case Control Consortium 3. An atlas of genetic correlations across human diseases and traits. Nat Genet. 2015;47:1236-41.
25. Giambartolomei C, Vukcevic D, Schadt EE, et al. Bayesian test for colocalisation between pairs of genetic association studies using summary statistics. PLoS Genet. 2014;10:e1004383.
26. Watanabe K, Taskesen E, Van Bochoven A, Posthuma D. Functional mapping and annotation of genetic associations with FUMA. Nat Commun. 2017;8:1826.
27. Weeks EM, Ulirsch JC, Cheng NY, et al. Leveraging polygenic enrichments of gene features to predict genes underlying complex traits and diseases. Nat Genet. 2023;55:1267-76.
28. Glickman ME, Rao SR, Schultz MR. False discovery rate control is a recommended alternative to Bonferroni-type adjustments in health studies. J Clin Epidemiol. 2014;67:850-7.
29. Courchesne E, Chisum HJ, Townsend J, et al. Normal brain development and aging: quantitative analysis at in vivo MR imaging in healthy volunteers. Radiology. 2000;216:672-82.
30. Baldock PA, Sainsbury A, Allison S, et al. Hypothalamic control of bone formation: distinct actions of leptin and Y2 receptor pathways. J Bone Miner Res. 2005;20:1851-7.
33. Fukumoto S, Nakamura Y, Watanabe M, et al. Risk HLA-DRB1 alleles differentially influence brain and lesion volumes in Japanese patients with multiple sclerosis. J Neurol Sci. 2020;413:116768.
Cite This Article
How to Cite
Download Citation
Export Citation File:
Type of Import
Tips on Downloading Citation
Citation Manager File Format
Type of Import
Direct Import: When the Direct Import option is selected (the default state), a dialogue box will give you the option to Save or Open the downloaded citation data. Choosing Open will either launch your citation manager or give you a choice of applications with which to use the metadata. The Save option saves the file locally for later use.
Indirect Import: When the Indirect Import option is selected, the metadata is displayed and may be copied and pasted as needed.
About This Article
Copyright

Data & Comments
Data
0


Comments
Comments must be written in English. Spam, offensive content, impersonation, and private information will not be permitted. If any comment is reported and identified as inappropriate content by OAE staff, the comment will be removed without notice. If you have any queries or need any help, please contact us at [email protected].