

Sequence diversity of gut microbial enzymes reveals strain-level associations with obesity
 0
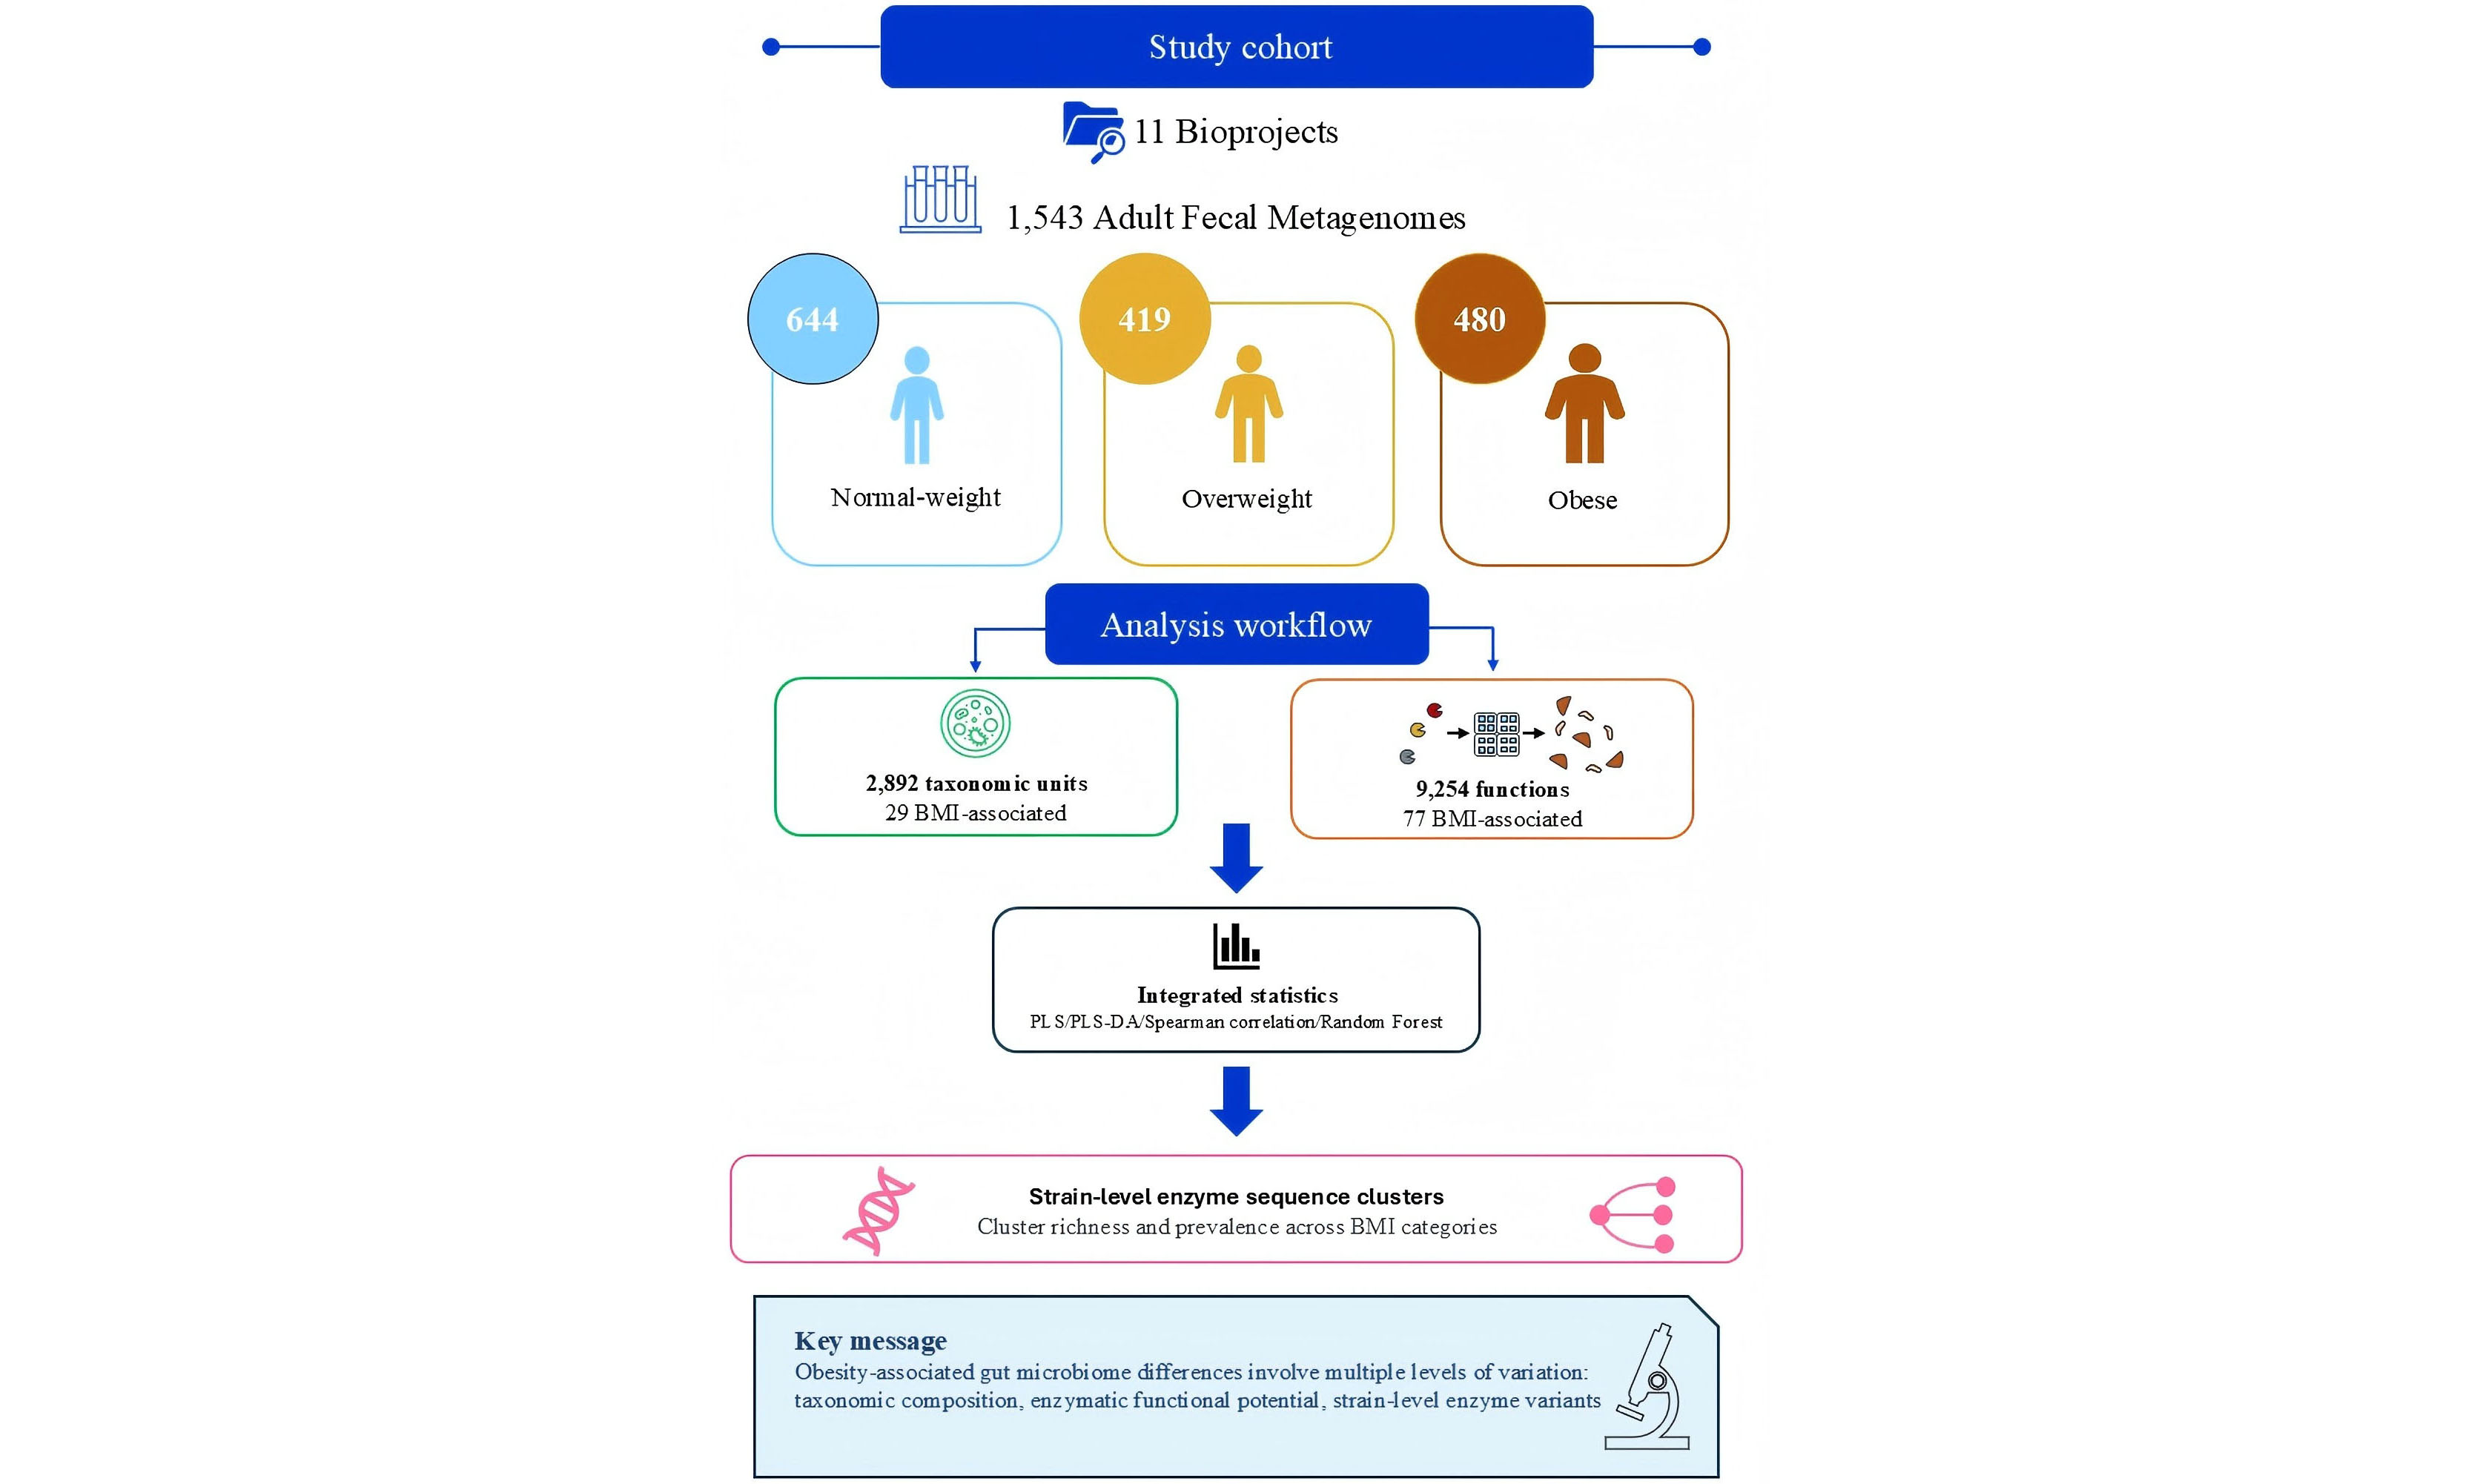
Graphical Abstract
Abstract
Background: Obesity is a complex, multifactorial condition increasingly associated with alterations in the gut microbiome. However, large-scale studies integrating taxonomic, functional, and strain-level information remain limited.
Methods: We analyzed 1,543 publicly available human fecal whole-genome shotgun metagenomes from 11 independent cohorts, classifying individuals as normal-weight, overweight, or obese according to body mass index. Taxonomic and enzymatic functional profiling were integrated with multivariate analyses, correlation testing, Random Forest-based feature ranking, taxonomic back-tracing, and comparative analysis of operational protein sequence clusters.
Results: Increasing body mass index (BMI) was associated with gradual changes in the relative abundance of specific microbial taxa, including enrichment of Clostridium fessum, Prevotella pectinovora, and Segatella copri. Functional profiling identified enrichment of genes involved in branched-chain amino acid catabolism, aminoacyl-tRNA-mediated biosynthesis, nucleotide metabolism, and lipid biosynthesis, together with depletion of functions related to short-chain fatty acid production, energy metabolism, and vitamin biosynthesis. Taxonomic back-tracing indicated that a limited subset of microbial taxa accounted for a substantial proportion of the reads assigned to BMI-associated enzymatic functions. Analysis of three selected enzymes further revealed differences in the richness, prevalence, and distribution of operational protein sequence clusters across BMI categories.
Conclusion: Obesity-associated gut microbiome variation involves not only species-level compositional differences but also changes in microbial functional potential and strain-level enzyme sequence-cluster distribution. These findings identify candidate microbial functions and protein sequence clusters for future functional and experimental validation.
Keywords


 Download PDF
INTRODUCTION
Obesity represents a major global health burden, with prevalence rising across both industrialized and developing regions[1]. It is a multifactorial condition resulting from complex interactions among genetic predisposition, dietary habits, lifestyle, and environmental factors[2,3]. Pathophysiologically, obesity is characterized by chronic low-grade inflammation and metabolic alterations[4], which substantially increase the risk of several other chronic diseases as well as certain cancers[5].
In recent years, the gut microbiota has emerged as a crucial regulator of metabolic and immune homeostasis within a bidirectional network of interactions with the host[6-8]. Both microbial composition and functional capacity can influence fat accumulation, glucose and lipid metabolism, and systemic inflammatory responses[9-14]. Notably, obese individuals often exhibit reduced microbial diversity, shifts in dominant taxa, and alterations in microbial functional potential compared with non-obese individuals[15-18].
Despite these advances, current studies investigating gut microbiota alterations in obesity are limited by heterogeneous study designs, small sample sizes, and a focus primarily on taxonomic characterization. While 16S rRNA gene sequencing has offered valuable insights into microbial community structure, it lacks the resolution needed to explore functional potential[19,20]. Even shotgun metagenomic studies often prioritize taxonomic analysis over functional profiling[21,22] and none have ever tried to explore genetic variability at the strain level. Moreover, the lack of large-scale microbiota comparisons and the limited integration of data from independent studies significantly restricts the generalizability and robustness of existing findings[22-24]. Consequently, the gut microbiota–associated metabolic pathways altered in obesity and the microbial taxa underlying these functional shifts remain poorly defined.
To address these gaps, we performed a comprehensive meta-analysis of publicly available human gut metagenomic datasets, representing one of the largest shotgun metagenomic collections analyzed to date from independent cohorts stratified by body mass index (BMI). By integrating taxonomic, enzymatic functional, and strain-level genetic profiling, we systematically compared the gut microbiota of normal-weight, overweight, and obese individuals. This approach allowed us not only to identify recurrent taxonomic patterns and metabolic pathways altered in obesity, but also to link these functional shifts to specific microbial taxa and correlated metabolic functions. Remarkably, this study also moves forward with respect to the current state of the art by exploring whether strain-level genetic variation is associated with increased BMI.
MATERIALS AND METHODS
Metagenomic datasets and bioinformatics pipeline
In this meta-analysis, 1,755 publicly available whole-genome shotgun (WGS) metagenomic datasets from adult fecal samples were initially retrieved from 11 studies [Supplementary Table 1]. Studies were selected based on the availability of raw sequencing data and their relevance to obesity-related research. At the sample level, datasets lacking complete BMI information, failing the predefined quality-control criteria, or belonging to disease groups not directly related to obesity were excluded. Following this curation process, 1,543 metagenomic samples were retained for downstream analyses. Corresponding BioProjects included PRJEB1220, PRJEB17632, PRJEB1786, PRJEB4336, PRJEB5224, PRJEB6070, PRJEB7774, PRJEB8347, PRJNA32089, PRJNA422434, and PRJNA48479. Sample metadata, read counts after quality and host DNA filtering, and the analytical depths used for taxonomic and functional profiling are provided in Supplementary Table 2.
To improve cross-study comparability, all raw sequencing datasets were reanalyzed using a standardized pipeline. Raw sequencing data in FASTQ format were downloaded from the NCBI Sequence Read Archive and quality-filtered using fastq-mcf, applying an average quality score threshold greater than 20 and a minimum read length greater than 100 bp[25].
Following quality filtering and host DNA removal, the retained reads were processed using the METAnnotatorX2 bioinformatics pipeline[26] for both taxonomic and functional profiling.
METAnnotatorX2 was configured to analyze a fixed number of 100,000 reads per sample for taxonomic profiling and up to 5,000,000 reads per sample for functional profiling. All retained samples contained at least 100,000 reads and were therefore analyzed at the same taxonomic depth. For functional profiling, samples retaining at least 5,000,000 reads after quality and host DNA filtering were analyzed at this fixed depth, whereas samples below this threshold were processed using all remaining reads.
For taxonomic profiling, Megablast was used to classify each metagenomic read, using an updated, manually curated, and taxonomically corrected non-redundant sequence database of genomes retrieved from NCBI servers. The generation of the taxonomic database was reported in detail by Milani et al.[26]. Reads with > 94% nucleotide identity to reference genomes were classified at the species level, while those below this threshold were assigned to the genus level as undefined species.
Functional profiling was performed using DIAMOND (version 2.1.9), mapping reads to a curated enzymatic sequence database derived from Rhea[27], with a minimum query coverage of 80%, an E-value threshold of 1 × 10⁻⁸, and a maximum of one target sequence per query.
Taxonomic and enzymatic profiles were expressed as relative abundances within each sample. Taxonomic abundances were additionally corrected for species genome size using the normalization implemented in METAnnotatorX2[26]. Zero values were retained as non-detections, without pseudocount addition or zero replacement. No centered log-ratio transformation was applied. No global low-abundance or prevalence filter was imposed before multivariate screening; all detected features were initially retained and subsequently selected according to the integrated statistical criteria described below.
To identify microbial taxa associated with specific enzymatic functions, we performed back-tracking analysis using the METAnnotatorX2 pipeline[26]. This allowed taxonomic attribution of enzymatic codes to specific microbial species, thereby yielding a taxonomic profile of reads associated with the enzymatic functions of interest. For each enzymatic function, a microbial taxon was considered assigned when its mean relative abundance in the corresponding function-specific back-tracing profile was equal to or greater than the 90th percentile of that profile. Taxa below this threshold were considered not assigned.
Statistical analyses
All analyses were performed using R software (version 4.4.3). Principal Coordinates Analysis (PCoA) based on Bray-Curtis distances was applied to evaluate global differences in microbiota composition among BMI groups. Bray-Curtis dissimilarity was calculated on relative abundance profiles using the vegan package, and PCoA was performed using the ape package. Overall differences in gut microbiota composition among BMI categories were assessed by permutational multivariate analysis of variance (PERMANOVA) using the adonis2 function of the vegan package, based on Bray-Curtis dissimilarities and 9,999 permutations. Homogeneity of multivariate dispersions was evaluated using the betadisper function followed by a permutation test with 9,999 permutations.
Partial Least Squares (PLS) regression was used to identify microbial taxa and enzymatic functions associated with BMI as a continuous variable, whereas Partial Least Squares Discriminant Analysis (PLS-DA) was used to identify features discriminating among BMI groups. Both analyses were performed using the mixOmics package. Predictor variables were internally mean-centered and scaled to unit variance before PLS and PLS-DA modeling. PLS and PLS-DA were used as exploratory supervised approaches for feature ranking based on VIP scores rather than as standalone predictive classifiers. Accordingly, features were retained only when supported by the additional statistical criteria described below, and no biological interpretation was based on PLS or PLS-DA results alone. Associations between microbial taxa abundance and BMI as a continuous variable were assessed using Spearman’s rank correlation, with p-values adjusted for multiple testing using the Benjamini-Hochberg procedure and significance set at false discovery rate (FDR) < 0.05. Spearman correlation analyses were performed using the cor.test function in the stats package, and false discovery rate correction was applied using the Benjamini-Hochberg method.
Differences in relative abundances across groups were evaluated using the Kruskal-Wallis test followed by pairwise Wilcoxon rank-sum tests, with multiple-comparison corrections. Kruskal-Wallis tests were performed using the kruskal.test function in the stats package. Pairwise comparisons were then assessed using Wilcoxon rank-sum tests, and p-values were corrected for multiple testing. Adjusted P-values < 0.05 were considered statistically significant.
Functional richness was calculated for each sample as the number of unique enzymatic functions (Rhea codes) detected with non-zero abundance. Differences in functional richness among BMI categories were assessed using the Kruskal-Wallis test followed by pairwise Wilcoxon rank-sum tests with Benjamini-Hochberg correction. Because functional richness estimates may be influenced by sequencing depth, a sensitivity analysis was additionally performed by restricting the analysis to samples uniformly profiled at 5,000,000 reads.
A Random Forest model was used as a complementary feature-ranking approach, with permutation importance applied to identify features contributing most strongly to BMI-group discrimination. Permutation importance scores were calculated from a separate model refitted on the full dataset and were the only importance measure used in the reported analyses; impurity importance scores were not used. Random Forest models were built using the ranger and caret packages, with BMI class used as the response variable and taxonomic or functional profiles used as predictors. Feature relevance was evaluated using variable importance scores and used as an additional criterion to support the identification of BMI-associated taxa and functions.
To assess the influence of the numerically largest contributing study, a targeted sensitivity analysis was performed by excluding BioProject PRJEB4336 and repeating Bray-Curtis-based PERMANOVA with 999 permutations and Random Forest permutation-importance analyses for both taxonomic and functional profiles. Full methodological details are reported in the Supplementary Methods, while the corresponding additional results are provided in the Supplementary Results.
To improve reproducibility, the R script used for the statistical analyses is provided as Supplementary code.
Strain-level enzyme sequence-cluster analysis
Microbial species of interest were included if they were identified by taxonomic back-tracing as contributors to all three enzymatic functions under investigation [branched-chain amino acid transaminase (Rhea 24813), phosphatidylserine decarboxylase (Rhea 20828), and nucleotide diphosphatase (Rhea 10248)]. Selected species were classified into two groups.
The first group included taxa significantly associated with BMI, irrespective of the direction of the association, as defined by VIP scores in both PLS and PLS-DA analyses, a statistically significant Spearman correlation with BMI (FDR < 0.05), and additional support from permutation importance scores derived from the full-data Random Forest classifier, together with overall relative abundance and prevalence.
The second group included species not significantly associated with BMI based on statistical criteria, but highly prevalent across the cohort (prevalence > 50% across all BMI categories) and consistently linked to the same enzymatic functions on taxonomic back-tracing analysis. For each selected species, genome sequences of all available strains were downloaded from the National Center for Biotechnology Information (NCBI) RefSeq database to ensure high-quality assemblies.
For each enzymatic function of interest, homologous protein sequences were retrieved from UniProt (Swiss-Prot and TrEMBL)[28] to build function-specific reference databases. Alignments were then performed using DIAMOND (version 2.1.9) against the downloaded genomes to identify homologous sequences (--query-cover 80, --evalue 1 × 10⁻⁸, --max-target-seqs 1, --outfmt 6, -b 8, -c 1, and --threads 60).
Candidate protein sequences were further analyzed using InterProScan (version 5.63-95.0)[29] to verify the presence of conserved domains characteristic of the target functions. Only sequences with the expected domains were retained. A stringent e-value threshold (1 × 10-100) was applied to increase confidence in functional assignments. Protein sequences were clustered using MMseqs2[30] at 80% amino acid identity, with a minimum alignment coverage of 80% of the shorter sequence, to define operational species-specific protein sequence clusters for downstream comparative analyses. These thresholds were used as operational criteria for grouping homologous sequences and were not interpreted as evidence of catalytic or functional divergence among clusters.
To determine the distribution of these operational protein sequence clusters across the metagenomic samples, all protein sequences retained after domain validation were assigned unique identifiers and incorporated into a custom DIAMOND-formatted database. Up to 5,000,000 quality- and host-filtered reads per sample were searched against this database using the Custom Reactions Database module of METAnnotatorX2; samples retaining fewer than 5,000,000 reads were analyzed using all remaining reads. Alignments were retained using an e-value threshold of 1 × 10⁻⁸ and a minimum query coverage of 80%. DIAMOND was configured to retain only one target sequence per read (--max-target-seqs 1); therefore, each read contributed to only one sequence-level assignment. Sequence-level hits were subsequently assigned to their corresponding operational protein sequence clusters using custom annotation and category files.
For each sample, cluster relative abundance was calculated by summing the relative abundances of all protein sequences belonging to the same cluster. Sequence relative abundance was calculated as the number of reads assigned to each sequence divided by the total number of reads analyzed for custom functional profiling and expressed as a percentage. Clusters with a relative abundance greater than 0.001% were considered detected. Differences in the number of detected clusters per sample among BMI groups were assessed using the Kruskal-Wallis test, followed by pairwise Wilcoxon rank-sum tests with Benjamini-Hochberg correction. Adjusted P values below 0.05 were considered statistically significant.
RESULTS AND DISCUSSION
Cohort characteristics and preliminary microbiota variation analysis
A total of 1,755 adult human fecal metagenomes were initially retrieved from eleven publicly available whole-genome shotgun (WGS) sequencing studies. These datasets were identified through a systematic search in metagenomic public repositories targeting obesity-related cohorts with comprehensive available metadata [Supplementary Table 1]. Following standardized quality control procedures and exclusion of samples lacking complete BMI data or not meeting quality thresholds, 212 samples were removed. The final curated dataset consisted of 1,543 high-quality metagenomic samples [Supplementary Table 2], stratified into three groups based on BMI classification[31], normal weight (BMI < 25; n = 644), overweight (25 ≤ BMI < 30; n = 419), and obese (BMI ≥ 30; n = 480). When publicly available, additional metadata were collected, including geographic location, age (years), and sex [Supplementary Table 2]. However, these variables were not consistently available across all cohorts. Given their known impact on gut microbiota composition[32-35], the lack of uniformly available metadata prevented stratified analyses and represents a source of residual heterogeneity that could not be fully controlled in the present study.
Species-level taxonomic and enzymatic functional profiling analyses [Supplementary Tables 3 and 4] were performed uniformly across all samples[26] to enable consistent comparison of microbial community structures and metabolic pathways. Reads with sequence identity below 94%, indicating putative novel taxa without reference genomes, were marked as “below species threshold” (BST). Reads matching multiple species within the same genus were labeled as “multihit species”. Both cases were treated as individual taxonomic units in downstream analyses.
To assess overall differences in gut microbiota composition across BMI categories, we performed a Principal Coordinates Analysis (PCoA) based on Bray-Curtis dissimilarities [Supplementary Figure 1]. The ordination showed substantial overlap among BMI categories, without a clear separation of the three groups. PERMANOVA nevertheless detected a statistically significant association between BMI category and overall microbiota composition (pseudo-F = 5.67, R2 = 0.0073, P < 0.001). However, BMI category explained only 0.73% of the total compositional variation, indicating a very small effect size. Multivariate dispersion also differed significantly among groups (PERMDISP F = 23.59, P < 0.001), suggesting that the PERMANOVA result may partly reflect differences in within-group dispersion.
A targeted sensitivity analysis excluding the numerically largest BioProject showed that the association with BMI category remained statistically detectable but quantitatively limited for both taxonomic composition (R2 = 0.00772, pseudo-F = 4.21, P = 0.001) and functional composition (R2 = 0.00759, pseudo-F = 4.14, P = 0.001). Concordance at the individual-feature level was partial and greater for taxonomic than for functional profiles, as detailed in the Supplementary Statistical Analyses.
To further evaluate whether obesity is associated with more subtle shifts in the gut microbiota, we estimated species-level richness across the three BMI groups. No statistically significant differences in species richness were detected among BMI categories, as assessed by the Kruskal-Wallis test (P = 0.80)
Differential abundance of gut microbial taxa across BMI groups
Since the global analyses indicated only a limited association between BMI category and overall microbiota composition, with no differences in species richness, we next investigated whether specific microbial taxa were differentially associated with BMI groups through a supervised multivariate statistical approach. Among the 2,892 microbial taxa initially profiled [Supplementary Table 3], we focused on those in the top 10% of importance scores (VIP) in both PLS (VIP ≥ 1.73) [Supplementary Table 6] and PLS-DA (VIP ≥ 1.54) statistical analyses [Supplementary Table 7] that also had a significant Spearman correlation with BMI (ρ, FDR < 0.05). Additional support was provided by permutation importance scores from a machine learning Random Forest classifier (RF importance). This multi-criterion approach identified 29 taxonomic units, of which 12 were fully resolved species, which were assessed for prevalence and mean abundance across BMI groups, revealing gradual microbial shifts along the obesity gradient [Supplementary Table 8].
Among taxa enriched in the gut of obese individuals [Figure 1A], Clostridium fessum [Table 1] and other Clostridium spp. [Supplementary Table 8] were particularly prominent, consistent with previous reports of their enrichment in the gut of obese populations and in patients with metabolic syndrome. Prevotella pectinovora also increased with BMI [Table 1], in line with prior observations describing an expansion of Prevotella species in obesogenic contexts[16,37]. However, the role of this genus in host metabolism and health remains debated, as the effects of Prevotella spp. appear to be highly context-dependent and influenced by diet, species- and strain-level diversity, host-related factors, and interactions with other members of the gut microbiota[38]. Similarly, several Segatella species [Supplementary Table 8], including S. copri [Table 1], increased with BMI. Notably, S. copri has previously been associated with insulin resistance and altered host metabolic profiles, features commonly linked to obesity and its metabolic complications[39,40]. These effects have been proposed to be mediated, at least in part, by the microbial biosynthesis of branched-chain amino acids, whose altered metabolism has been associated with impaired insulin sensitivity and obesity[41,42].
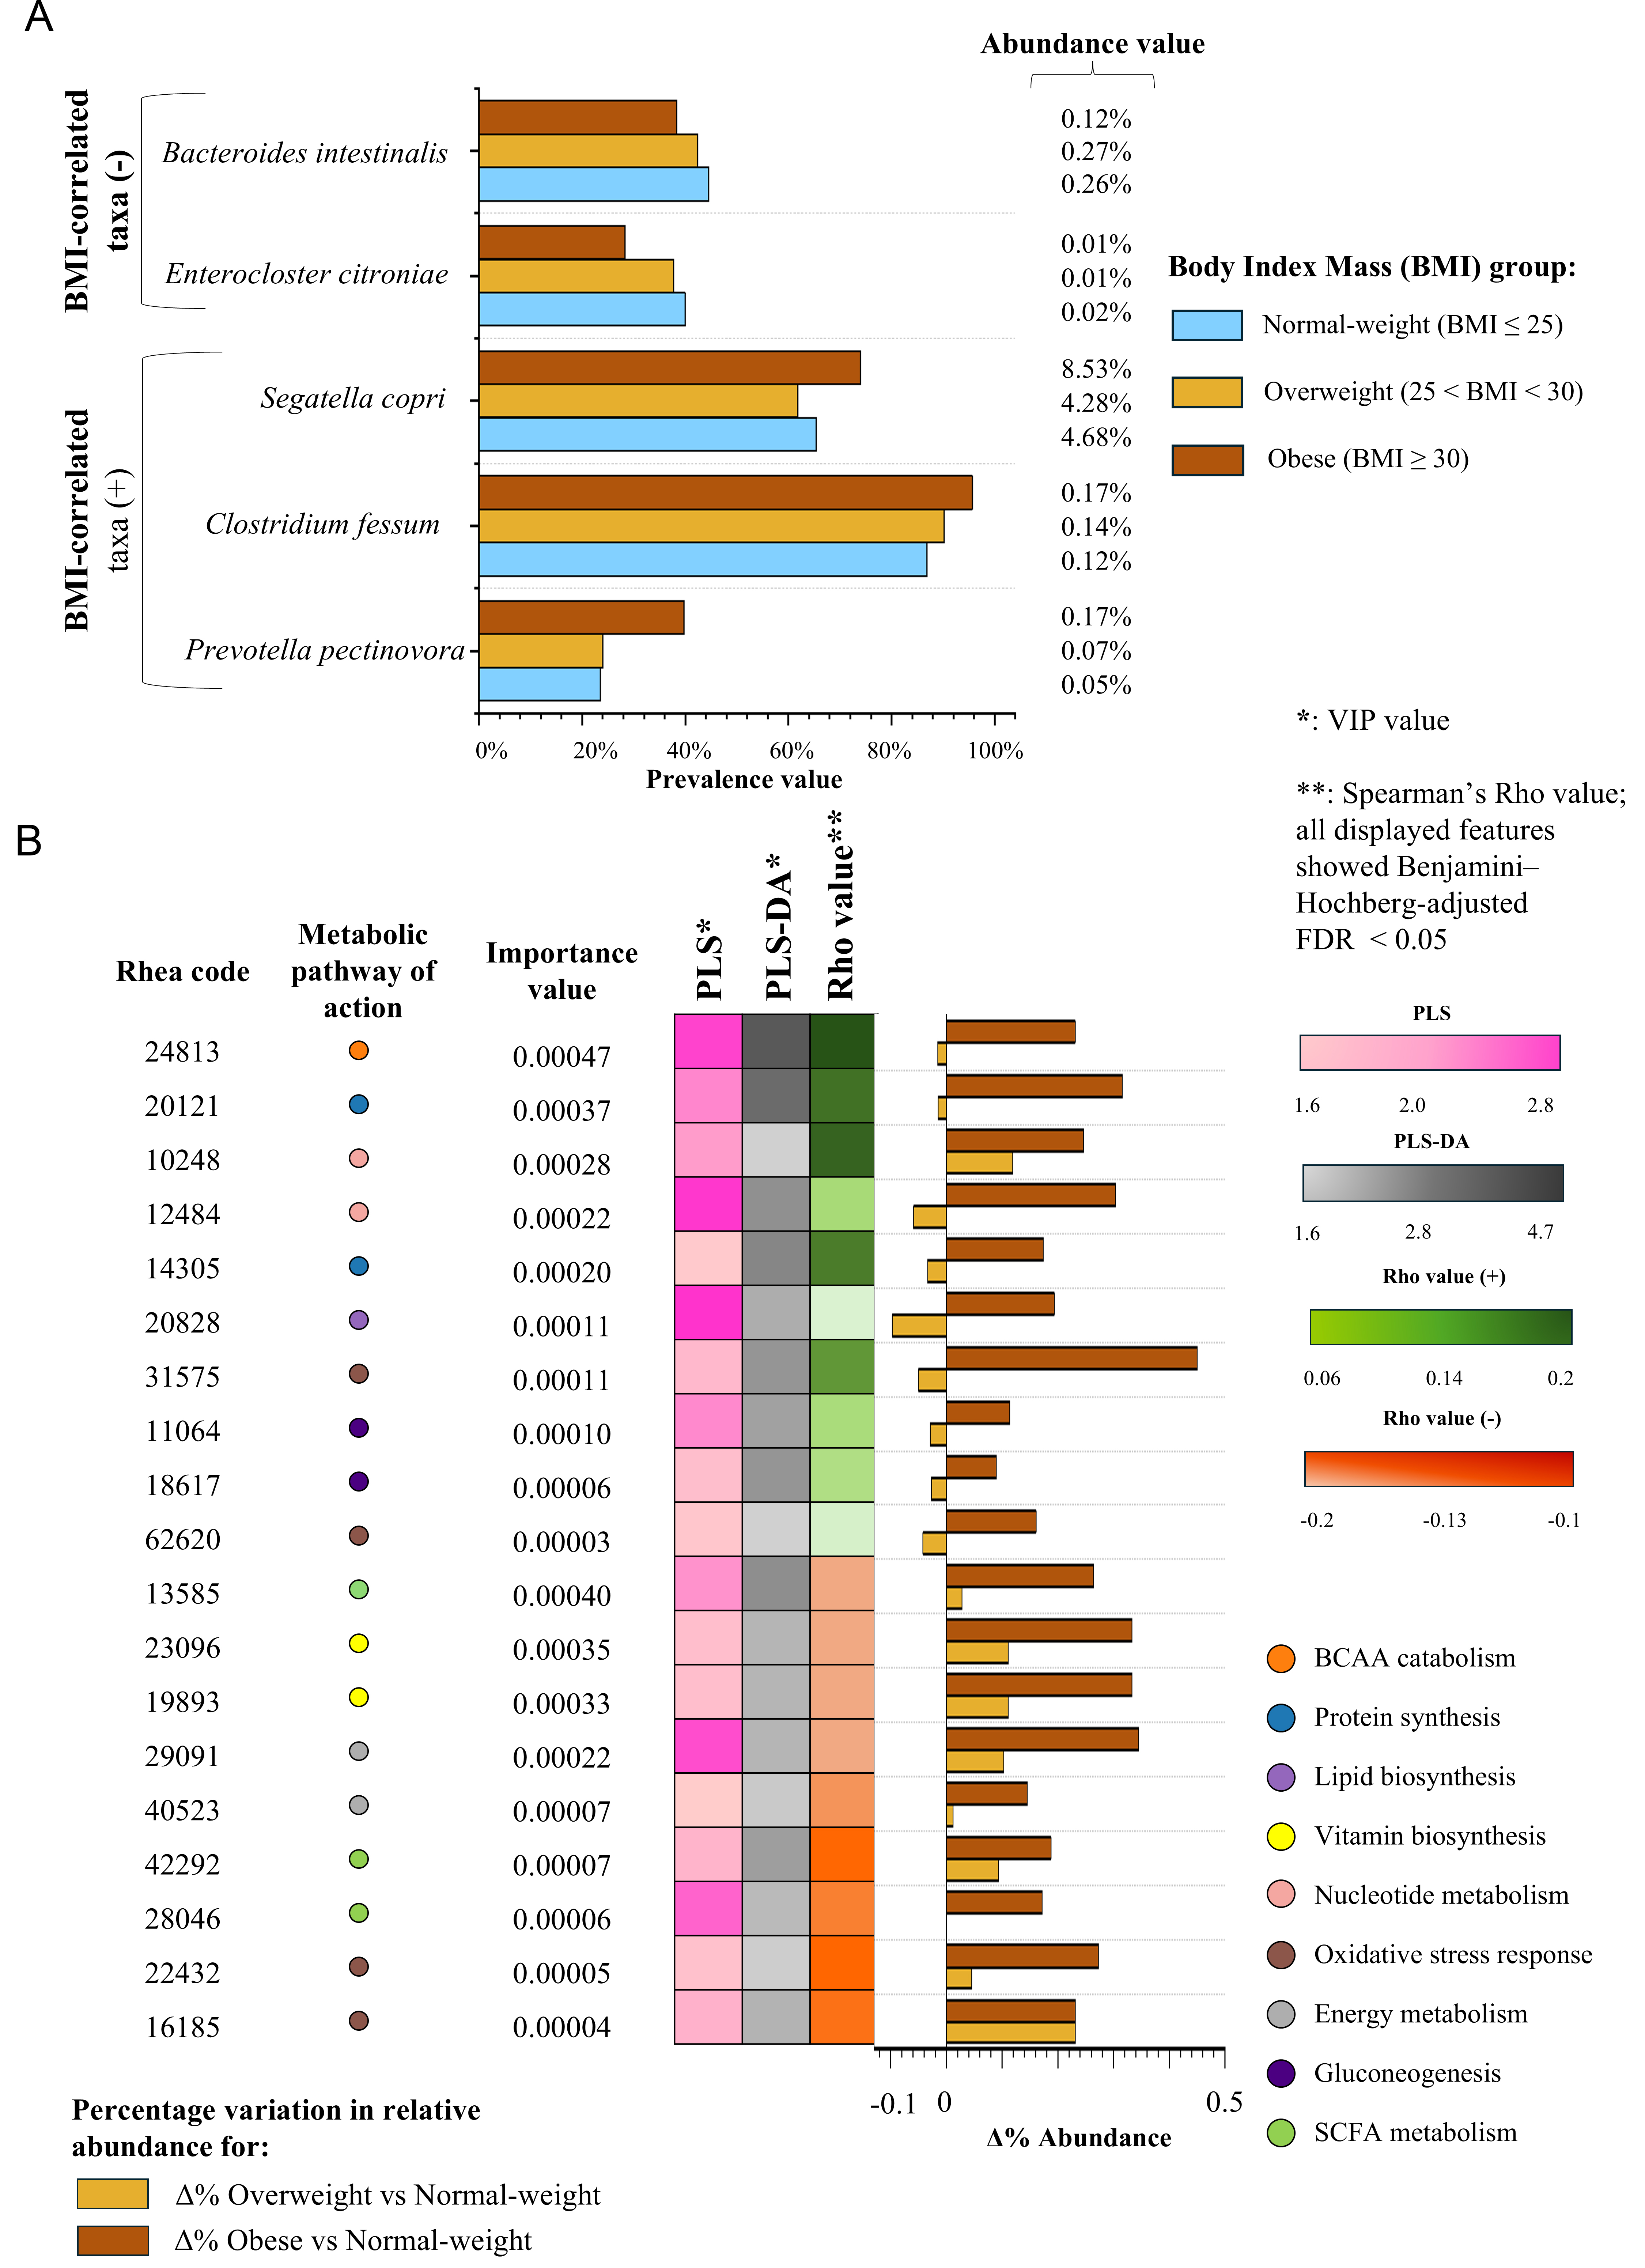
Figure 1. BMI-associated shifts in microbial taxa and enzymatic functions. (A) Bar plots displaying the prevalence of a subset of the 29 taxa identified through the multi-criteria statistical pipeline. Bars are color-coded by BMI group: brown (obese), yellow (overweight), and light blue (normal-weight). The relative abundance values of each species in the three BMI groups are shown alongside the plots; (B) Heatmap illustrating the importance of a subset of the 77 enzymatic functions identified through the statistical selection pipeline, evaluated across three complementary criteria: VIP scores from PLS and PLS-DA models, and Spearman’s correlation coefficients (rho) with BMI. Each row represents one enzymatic function and includes the corresponding Rhea ID, and a dedicated color code indicates the associated metabolic pathway. Bar plots show the percentage variation (Δ%) in relative abundance for overweight vs normal-weight (yellow) and obese vs normal-weight (brown) comparisons. BCAA: Branched-chain amino acid; FDR: false discovery rate; SCFA: short-chain fatty acid; BMI: body mass index; VIP: variable importance in projection; PLS: Partial Least Squares; PLS-DA: Partial Least Squares Discriminant Analysis.
Microbial taxa significantly associated with BMI, showing VIP scores (PLS and PLS-DA), Spearman correlations, Machine Learning Random Forest permutation importance values, changes in prevalence (percentage points), and relative changes in abundance between normal-weight and obese individuals
| Taxon | Association with BMI | Statistical support | |||||
| VIP (PLS) | VIP (PLS-DA) | Spearman ρ | RF importance | Prevalence change NW → OB (pp)* | Relative abundance change NW → OB (%)* | ||
| Clostridium fessum | Positive (↑ BMI) | 3.11 | 3.99 | 0.21 | 0.0025 | 8.79% | 41.50% |
| Prevotella pectinovora | Positive (↑ BMI) | 3.38 | 2.46 | 0.17 | 0.001 | 16.27% | 220.90% |
| Segatella copri | Positive (↑ BMI) | 2.57 | 4.06 | 0.1 | 0.001 | 8.57% | 82.00% |
| Enterocloster citroniae | Negative (↓ BMI) | 2.49 | 3.99 | -0.13 | 0.0004 | -11.61% | -67.70% |
| Bacteroides intestinalis | Negative (↓ BMI) | 1.83 | 1.94 | -0.08 | 0.0003 | -6.20% | -53.70% |
Moreover, it has also been linked to high-fiber diets and improved glucose metabolism, underscoring its context-dependent metabolic effects[17,43,44].
In contrast, Enterocloster citroniae and Bacteroides intestinalis [Table 1 and Figure 1A] were negatively associated with BMI and depleted in the gut of individuals with obesity. The reduction of Bacteroides species is a recurrent feature of obesity-associated dysbiosis and has been linked to impaired polysaccharide utilization and altered host-microbe metabolic interactions[45,46].
While these taxonomic associations provide valuable insights into species-level compositional shifts linked to BMI, they do not fully capture the functional consequences of these shifts; therefore, we complemented the taxonomic analysis with functional profiling of the gut microbiome across BMI groups.
Functional shifts in the gut microbiome across BMI categories
In parallel with the taxonomic analysis, we characterized the functional profile of the gut microbiota in the three BMI groups using the same multivariate workflow applied to taxonomic data (PLS, PLS-DA, Spearman correlation with BMI, and Machine Learning Random Forest validation) [Supplementary Tables 9-11].
Functional richness, defined as the number of enzymatic functions (unique Rhea codes) detected with non-zero abundance per sample, differed significantly across BMI categories. In the complete dataset, obese individuals showed fewer detectable functions than normal-weight individuals (1,626 vs. 2,021; Kruskal-Wallis P = 9.33 × 10⁻²⁶; FDR-corrected pairwise P < 0.001; Supplementary Table 12). Because the absolute number of detectable functions was influenced by sequencing depth, the analysis was repeated in the 1,221 samples uniformly profiled at 5,000,000 reads. In this subset, median functional richness was 2,201.5, 2,358.5, and 1,971 functions in normal-weight, overweight, and obese individuals, respectively. The overall difference remained significant (Kruskal-Wallis P = 1.19 × 10⁻¹⁰), with obese individuals retaining significantly lower functional richness than normal-weight individuals after Benjamini-Hochberg correction (adjusted P = 1.37 × 10⁻⁴). These results indicate lower functional richness in obese individuals, although the absolute estimates were partly influenced by sequencing depth.
Of the 9,254 annotated enzymatic functions, the supervised multivariate statistical approach comprising multivariate and correlation-based filtering identified 77 BMI-associated functions, of which 33 were positively correlated and 44 negatively correlated with BMI [Supplementary Tables 4, 9-12]. Detailed statistical analyses, selection criteria, and full functional annotations are provided in the Supplementary Results, while a representative subset of BMI-associated enzymatic functions is shown in Figure 1B.
Functions enriched in obesity were mainly involved in branched-chain amino acid catabolism (Rhea code: 24813), purine degradation (Rhea code: 10248 and 12484), gluconeogenesis (Rhea code: 11064 and 18617), lipid biosynthesis (Rhea code: 20828), oxidative stress response, microbial biosynthetic activity (Rhea code: 31575 and 62620) along with nitrogen metabolism and protein synthesis (Rhea code: 20121 and 14305) [Table 2]. Together, these associations define a metagenomic functional profile characterized by shifts in genes related to energy metabolism, biosynthetic activity, and oxidative-stress response at higher BMI[5,47-53]. Consistent with these findings, a recent fecal metagenomic study reported reduced fermentative potential and an increased microbial capacity to respond to oxidative stress in individuals with obesity[54].
Microbial enzymes associated with BMI: trends of increase and decrease in relation to obesity
| Trend | Rhea code | Enzyme | Summary description and potential relevance to obesity | Reference |
| Enzymes increased with BMI | 24813 | Branched-chain amino acid transaminase | Initiates BCAA catabolism, leading to the formation of branched-chain keto acids (BCKAs), whose accumulation has been associated with insulin resistance and metabolic inflexibility in the host | [47] |
| 10248 | Nucleotide diphosphatase | Hydrolyzes dUTP to dUMP and diphosphate, contributing to microbial nucleotide-pool homeostasis. Its increased abundance may indicate altered microbial nucleotide metabolism associated with higher BMI | [50] | |
| 12484 | 5′-Nucleotidase | Converts AMP to adenosine, whose increased levels have been associated with pro-inflammatory signaling and impaired glucose regulation in obese subjects | [50] | |
| 11064 | Fructose-bisphosphatase | Catalyzes a key gluconeogenic step, potentially suggesting an increased microbial capacity for endogenous sugar production and dietary energy extraction in the obese gut | [55] | |
| 18617 | Phosphoenolpyruvate carboxykinase (PEPCK) | Promotes gluconeogenesis and carbon recycling, which may support higher energy yield and metabolic efficiency in obesogenic microbiota | [56] | |
| 20828 | Phosphatidylserine decarboxylase | Drives microbial phospholipid biosynthesis, which may potentially influence lipid metabolism and inflammatory pathways | [57] | |
| 31575 | 8-oxo-dGTP diphosphatase (MutT) | Protects microbial DNA from oxidative damage; its enrichment may reflect adaptation to the pro-oxidative intestinal environment associated with obesity | [58] | |
| 62620 | Thioredoxin-dependent peroxiredoxin | Detoxifies peroxides via thioredoxin; increased abundance may reflect microbial coping mechanisms in response to obesity-related oxidative stress | [59] | |
| 20121 | Glutamine-tRNA ligase | Catalyzes aminoacylation of tRNA; its enrichment may be consistent with enhanced microbial biosynthetic and translational activity in dysbiotic, obesity-associated microbiomes | [60] | |
| 14305 | Proline-tRNA ligase | Proline-tRNA ligase catalyzes the ATP-dependent attachment of proline to tRNA^Pro, essential for bacterial protein synthesis. Translation-related genes, including aminoacyl-tRNA synthetases, are often enriched in obesity-associated microbiomes, which may suggest higher microbial growth and activity | [61] | |
| Enzymes decreased with BMI | 13585 | Butyrate kinase | Catalyzes the terminal step of butyrate formation; its reduction may indicate diminished SCFA production, potentially contributing to gut barrier dysfunction and systemic inflammation | [62] |
| 42292 | Phosphate acyltransferase | Participates in butyrate biosynthesis; lower abundance may indicate a reduced representation of anti-inflammatory SCFA pathways in the obese gut. | [63] | |
| 28046 | Phosphate propanoyltransferase | Catalyzes propionate formation; its decrease may suggest reduced capacity to produce SCFAs, which are involved in the regulation of lipogenesis and insulin sensitivity | [63] | |
| 40523 | Succinate dehydrogenase | Links the TCA cycle to electron transport; changes in SDH levels may influence microbial respiration and metabolic fluxes | [64] | |
| 29091 | NADH: ubiquinone reductase (H+-translocating) | Key component of oxidative phosphorylation; its reduced abundance may be associated with lower ATP generation, potentially favoring a more hypoxic and fermentative intestinal environment | [65] | |
| 16185 | Aldehyde dehydrogenase (NAD+) | Detoxifies reactive aldehydes; its decline may suggest altered redox balance and could be associated with the accumulation of pro-inflammatory metabolites | [66] | |
| 22432 | 3-Hydroxyacyl-CoA dehydrogenase | Involved in β-oxidation of fatty acids; reduced abundance may suggest impaired microbial lipid catabolism and could potentially contribute to host fat accumulation | [67] | |
| 23096 | Hydroxymethylpyrimidine kinase | Catalyzes an early step in thiamine (vitamin B1) biosynthesis. Reduced abundance of this enzyme may limit microbial thiamine production and could thereby influence host carbohydrate metabolism | [68,69] | |
| 19893 | Phosphooxymethylpyrimidine kinase | Acts in the thiamine biosynthetic pathway; decreased abundance may suggest reduced microbial production of B-vitamins associated with obesity-related micronutrient imbalances | [68] |
Conversely, enzymes depleted with increasing BMI predominantly included those involved in short-chain fatty acid (SCFA) production, including butyrate and propionate biosynthesis (Rhea code: 13585, 42292 and 28046), oxidative phosphorylation and central energy metabolism (Rhea code: 40523 and 29091), β-oxidation and redox balance (Rhea code: 16185 and 22432), as well as thiamine biosynthesis (Rhea code: 23096; and 19893) [Table 2]. The depletion of SCFA-related pathways is particularly relevant, as butyrate and propionate are key microbial metabolites involved in maintaining intestinal barrier integrity, immune regulation, and metabolic homeostasis[70,71]. In particular, reduced microbial capacity for butyrate and propionate biosynthesis may weaken tight-junction organization and epithelial barrier function, thereby increasing intestinal permeability and facilitating the translocation of lipopolysaccharide and other microbial products into the circulation[72]. This process may promote metabolic endotoxemia and, consequently, the chronic low-grade systemic inflammation that characterizes obesity[73,74]. Together, these patterns indicate reduced microbial functions supporting intestinal barrier integrity, metabolic homeostasis, redox balance, and micronutrient availability in obesity[62,63,68,75].
Overall, the functional remodeling across BMI groups highlights a progressive enrichment of pathways related to amino acid turnover alongside a concomitant depletion of short-chain fatty acid production, oxidative and redox metabolism, and vitamin B biosynthesis. This shift supports the hypothesis that the gut microbiota contributes to metabolic dysregulation in obesity not only through compositional changes but also via functional reprogramming, ultimately affecting host energy balance, inflammation, and micronutrient availability[22,54].
Back-tracing of microbial taxa involved in relevant metabolic reactions
Building on the functional shifts identified above, we investigated which bacteria were associated with reads assigned to these BMI-associated enzymatic functions. To this end, a back-tracing analysis was performed to link key enzymatic functions to their microbial sources. Specifically, we focused on 10 enzymatic functions (Rhea codes: 24813, 12484, 11064, 18617, 20828, 31575, 62620, 20121, 10248, and 14305) [Supplementary Tables 13-22 and Figure 2], which were identified in the previous functional analysis as significantly and positively correlated with BMI and as part of metabolic pathways potentially enriched in obese individuals. These included branched-chain amino acid (BCAA) catabolism, gluconeogenesis and energy metabolism, oxidative stress response, nucleotide metabolism, lipid metabolism, and aminoacyl-tRNA-mediated protein biosynthesis. These functions represented a subset of the 33 catalytic activities previously associated with increasing BMI, as described above. These positively associated functions were prioritized because the back-tracing analysis was used to identify microbial contributors for the subsequent strain-level investigation of enzyme sequence-cluster heterogeneity. Functions negatively associated with BMI were not selected for this downstream analysis because their reduced abundance and detection at higher BMI could make it difficult to distinguish differences in sequence-cluster distribution from an overall depletion of the corresponding function. Accordingly, the back-tracing analysis was not intended as a comprehensive assessment of all positively and negatively associated enzymatic functions.
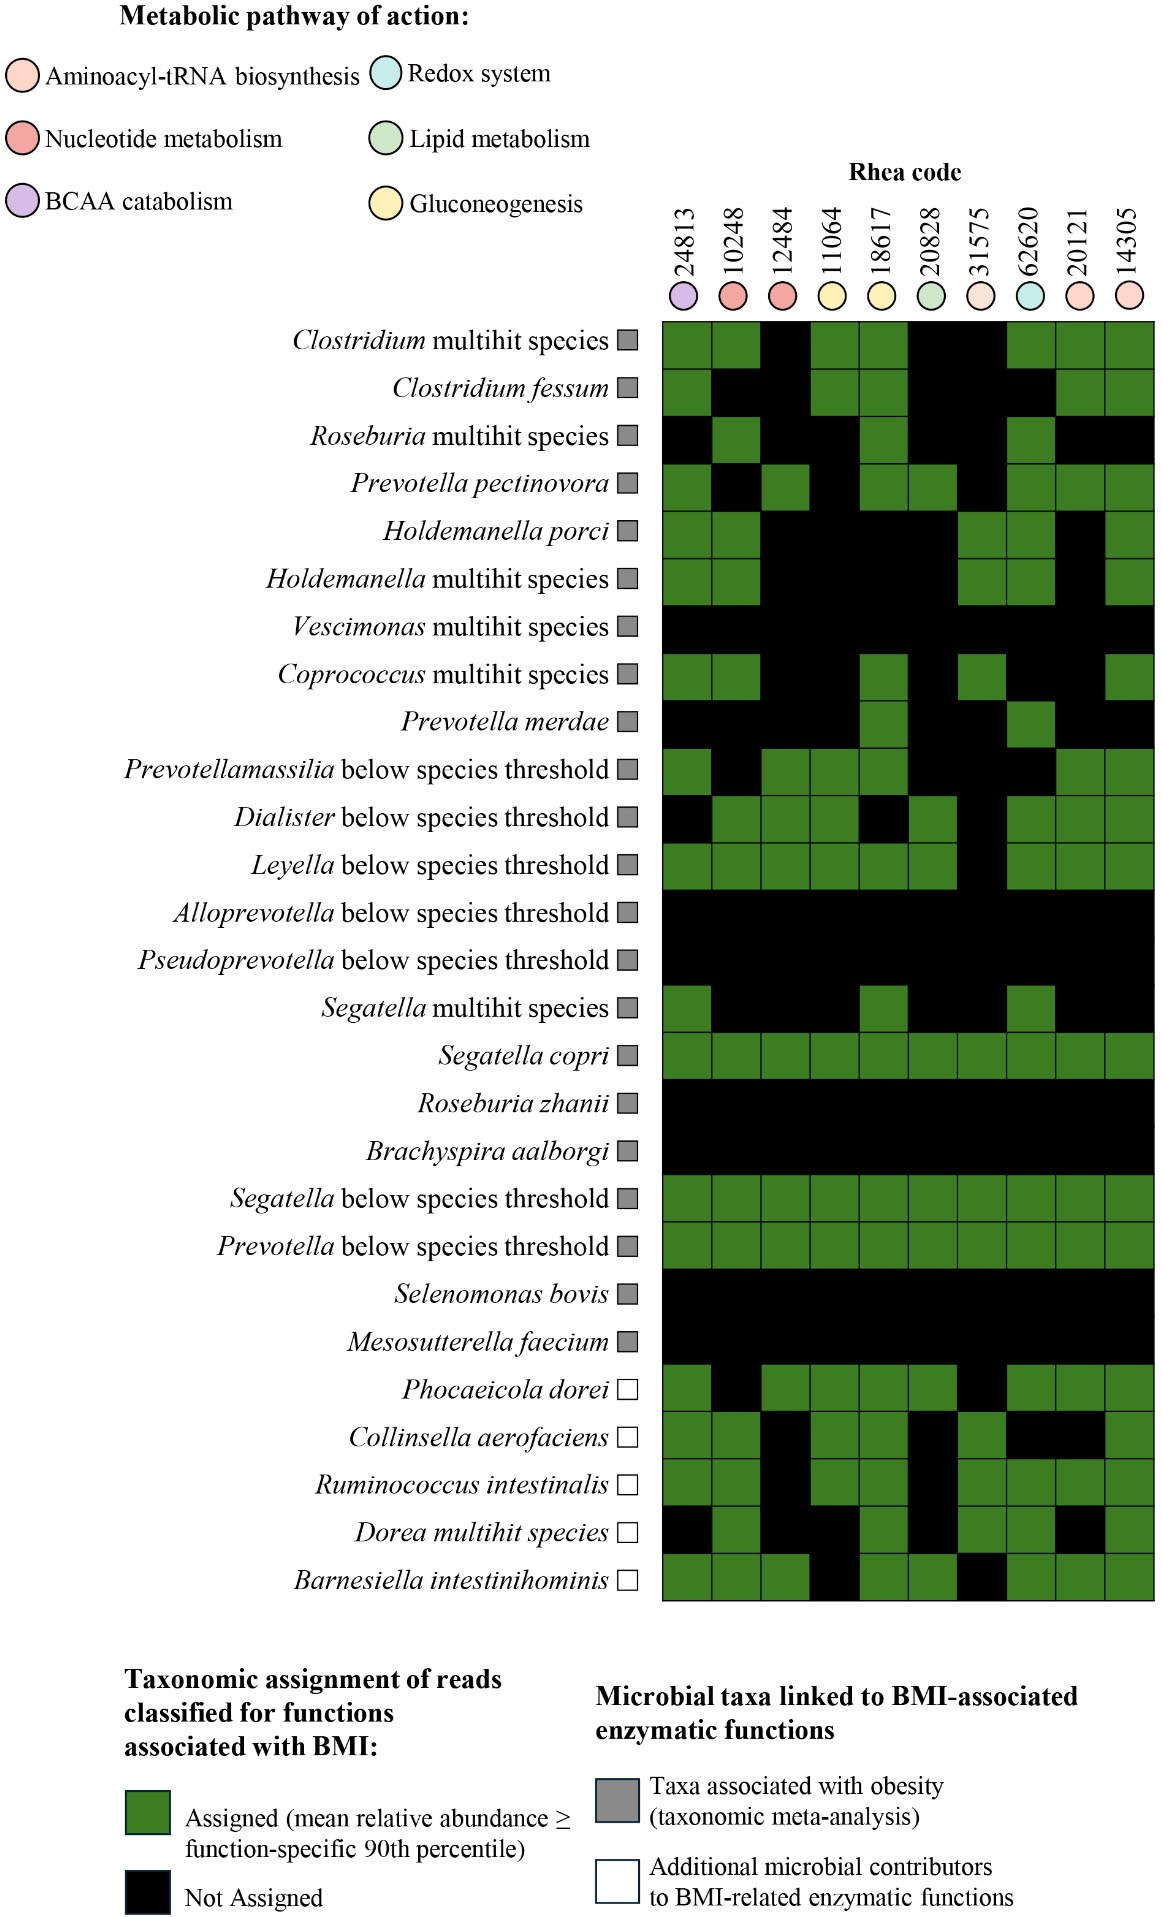
Figure 2. Assignment of microbial taxa to BMI-associated enzymatic functions. Heatmap showing the assignment of microbial taxa to 10 enzymatic functions previously identified as positively associated with BMI and enriched in obese individuals. Taxa include those identified in the taxonomic meta-analysis as BMI-associated, as well as additional contributors revealed by back-tracing analysis. Green cells indicate assigned taxa, defined as taxa whose mean relative abundance was equal to or greater than the 90th percentile of the corresponding function-specific back-tracing profile; black cells indicate taxa below this threshold. BCAA: Branched-chain amino acid; BMI: body mass index.
For each enzymatic function, we performed back-tracing to identify the microbial taxa responsible.
We first investigated the contribution of specific taxa linked above to obesogenic contexts by the overall taxonomic-based meta-analysis [Supplementary Table 8]. The back-tracing analysis revealed that Clostridium (including C. fessum), Prevotella (such as P. pectinovora, P. merdae), Prevotellamassilia and Segatella (such as S. copri) accounted for most of the reads associated with BMI-related enzymatic functions
In contrast, species of microbial genera such as Roseburia and Vescimonas, Alloprevotella, Pseudoprevotella, Brachyspira, Selenomonas, and Mesosutterella did not appear to contribute substantially to the functions under investigation despite being among those associated with BMI in terms of relative abundance in the whole microbiota [Supplementary Table 8 and Figure 2]. This does not imply that BMI-associated taxa not represented among carriers of these functions are functionally irrelevant in obesity. Rather, it suggests that these activities may be encoded only by specific strains within those microbial taxa, thereby weakening the correspondence between species abundance and function-associated microbial read abundance.
In addition to the latter microbial taxa, our back-tracing analysis revealed several additional microbial contributors to BMI-related enzymatic functions (average abundance ≥ 0.01) [Figure 2], which were not highlighted by the analysis of overall gut microbiota taxonomic profiles, thus not listed in Supplementary Table 8. Some of these taxa, such as Collinsella aerofaciens, Ruminococcus intestinalis, and Dorea, have been shown to participate in gluconeogenesis (Rhea code: 18617), nucleotide metabolism (Rhea code: 10248), and Aminoacyl-tRNA metabolism (Rhea code: 14305) [Figure 2] and have previously been reported to correlate with obesity or metabolic dysregulation, supporting their potential role in shaping gut functional profiles in obesogenic contexts[76].
Importantly, we also identified microbial taxa not yet extensively characterized in association with obesity, including Phocaeicola dorei and Barnesiella intestinihominis, which exhibited significant representation in key enzymatic functions such as BCAA catabolism (Rhea 24813), aminoacyl-tRNA biosynthesis (Rhea 20121, 14305), redox system (Rhea code: 62620), and gluconeogenesis (Rhea code: 18617) [Figure 2]. These findings suggest that the spectrum of microbial contributors to obesity-associated metabolic pathways may be broader than previously recognized, identifying candidates for future functional validation.
Intriguingly, these latter taxa did not appear to be present at differential relative abundance in whole microbiota profiles of low- and high-BMI individuals but conversely appear involved in encoding functions whose abundance differs.
Obesity-associated functional remodeling involves differences in strain-level enzyme sequence-cluster distribution and richness
Recent large-scale metagenomic studies have shown that genetic variation within microbial species can influence metabolic capacities and other biological properties, and that the distribution of such variation may be shaped by host- and environment-related selective pressures[77-79].
After identifying the microbial taxa contributing to obesity-associated functions, we investigated whether the limited concordance with bacterial taxa positively associated with BMI in the overall taxonomic analysis was accompanied by within-species enzyme sequence heterogeneity that was not captured by species-level abundance alone. To assess this, we selected three enzymatic activities positively associated with BMI for subsequent strain-level analysis: branched-chain amino acid transaminase (Rhea 24813), phosphatidylserine decarboxylase (Rhea 20828), and nucleotide diphosphatase (Rhea 10248) [Table 2 and Supplementary Table 23]. These enzymes were selected because they represent distinct and well-defined catalytic activities within metabolic processes of potential relevance to obesity-associated microbiome alterations, including branched-chain amino acid, phospholipid, and nucleotide metabolism, respectively. Sixteen candidate species, linked to all three functions through taxonomic back-tracing, were initially selected. This set included two microbial species previously identified as significantly associated with BMI in the overall taxonomic analysis, namely S. copri, which was positively associated with BMI, and Bacteroides intestinalis, which was negatively associated with BMI [Supplementary Table 8], together with highly prevalent species not significantly associated with BMI across the overall taxonomic analysis (prevalence > 50% across all BMI categories) [Supplementary Table 23]. The inclusion of both BMI-associated species and highly prevalent species not emerging from the overall taxonomic analysis was intended to examine whether enzyme sequence-cluster distributions could provide information not captured by species-level abundance differences alone.
To characterize strain-level enzyme sequence diversity, we analyzed all publicly available genomes for the selected species [Supplementary Table 23] and identified putative genes for each of the three enzymatic activities. Candidate genes were further filtered based on conserved protein domains and sequence similarity to reference enzymes. Only species harboring at least one high-confidence gene candidate with the expected conserved domains and a stringent alignment threshold (e-value ≤ 1 × 10-100) were retained for downstream analysis, resulting in a final set of eight species, including S. copri and seven highly prevalent taxa [Supplementary Table 24].
Identified genes were clustered at 80% amino acid identity and 80% coverage to define operational protein sequence clusters, yielding overall 17 clusters for nucleotide diphosphatase, 36 clusters for phosphatidylserine decarboxylase, and 12 clusters for branched-chain amino acid transaminase. The retained protein sequences were subsequently searched against the metagenomic datasets from normal-weight, overweight, and obese individuals, and sequence-level assignments were aggregated according to their corresponding operational protein sequence clusters. Clusters with a relative abundance greater than 0.001% in each sample were considered detected [Supplementary Table 25].
Notably, 34 of the 36 phosphatidylserine decarboxylase sequence clusters and most of the nucleotide diphosphatase sequence clusters were assigned to Bacteroides uniformis. This species was included because it was highly prevalent across BMI categories and was consistently identified by taxonomic back-tracing as a carrier of all three selected enzymatic functions, although its overall species-level abundance was not significantly associated with BMI. This pattern highlights the additional resolution provided by the sequence-cluster analysis, as within-species sequence distributions may differ across BMI categories even in the absence of marked changes in total species abundance. Accordingly, the results for these two enzymes mainly reflect sequence heterogeneity within B. uniformis and identify this species as a relevant model for future investigation of strain-level enzyme diversity.
The mean number of detected genetic variant clusters per sample differed significantly across BMI categories for all three enzymatic functions (Kruskal-Wallis P < 0.001 for phosphatidylserine decarboxylase and nucleotide diphosphatase; P = 0.0032 for branched-chain amino acid transaminase). Pairwise comparisons indicated lower cluster counts in obese individuals, particularly for phosphatidylserine decarboxylase, whereas the absolute differences were modest for the other functions [Figure 3 and Supplementary Table 26]. Beyond these differences in cluster counts, individual variants differed markedly in their genomic representation across species.
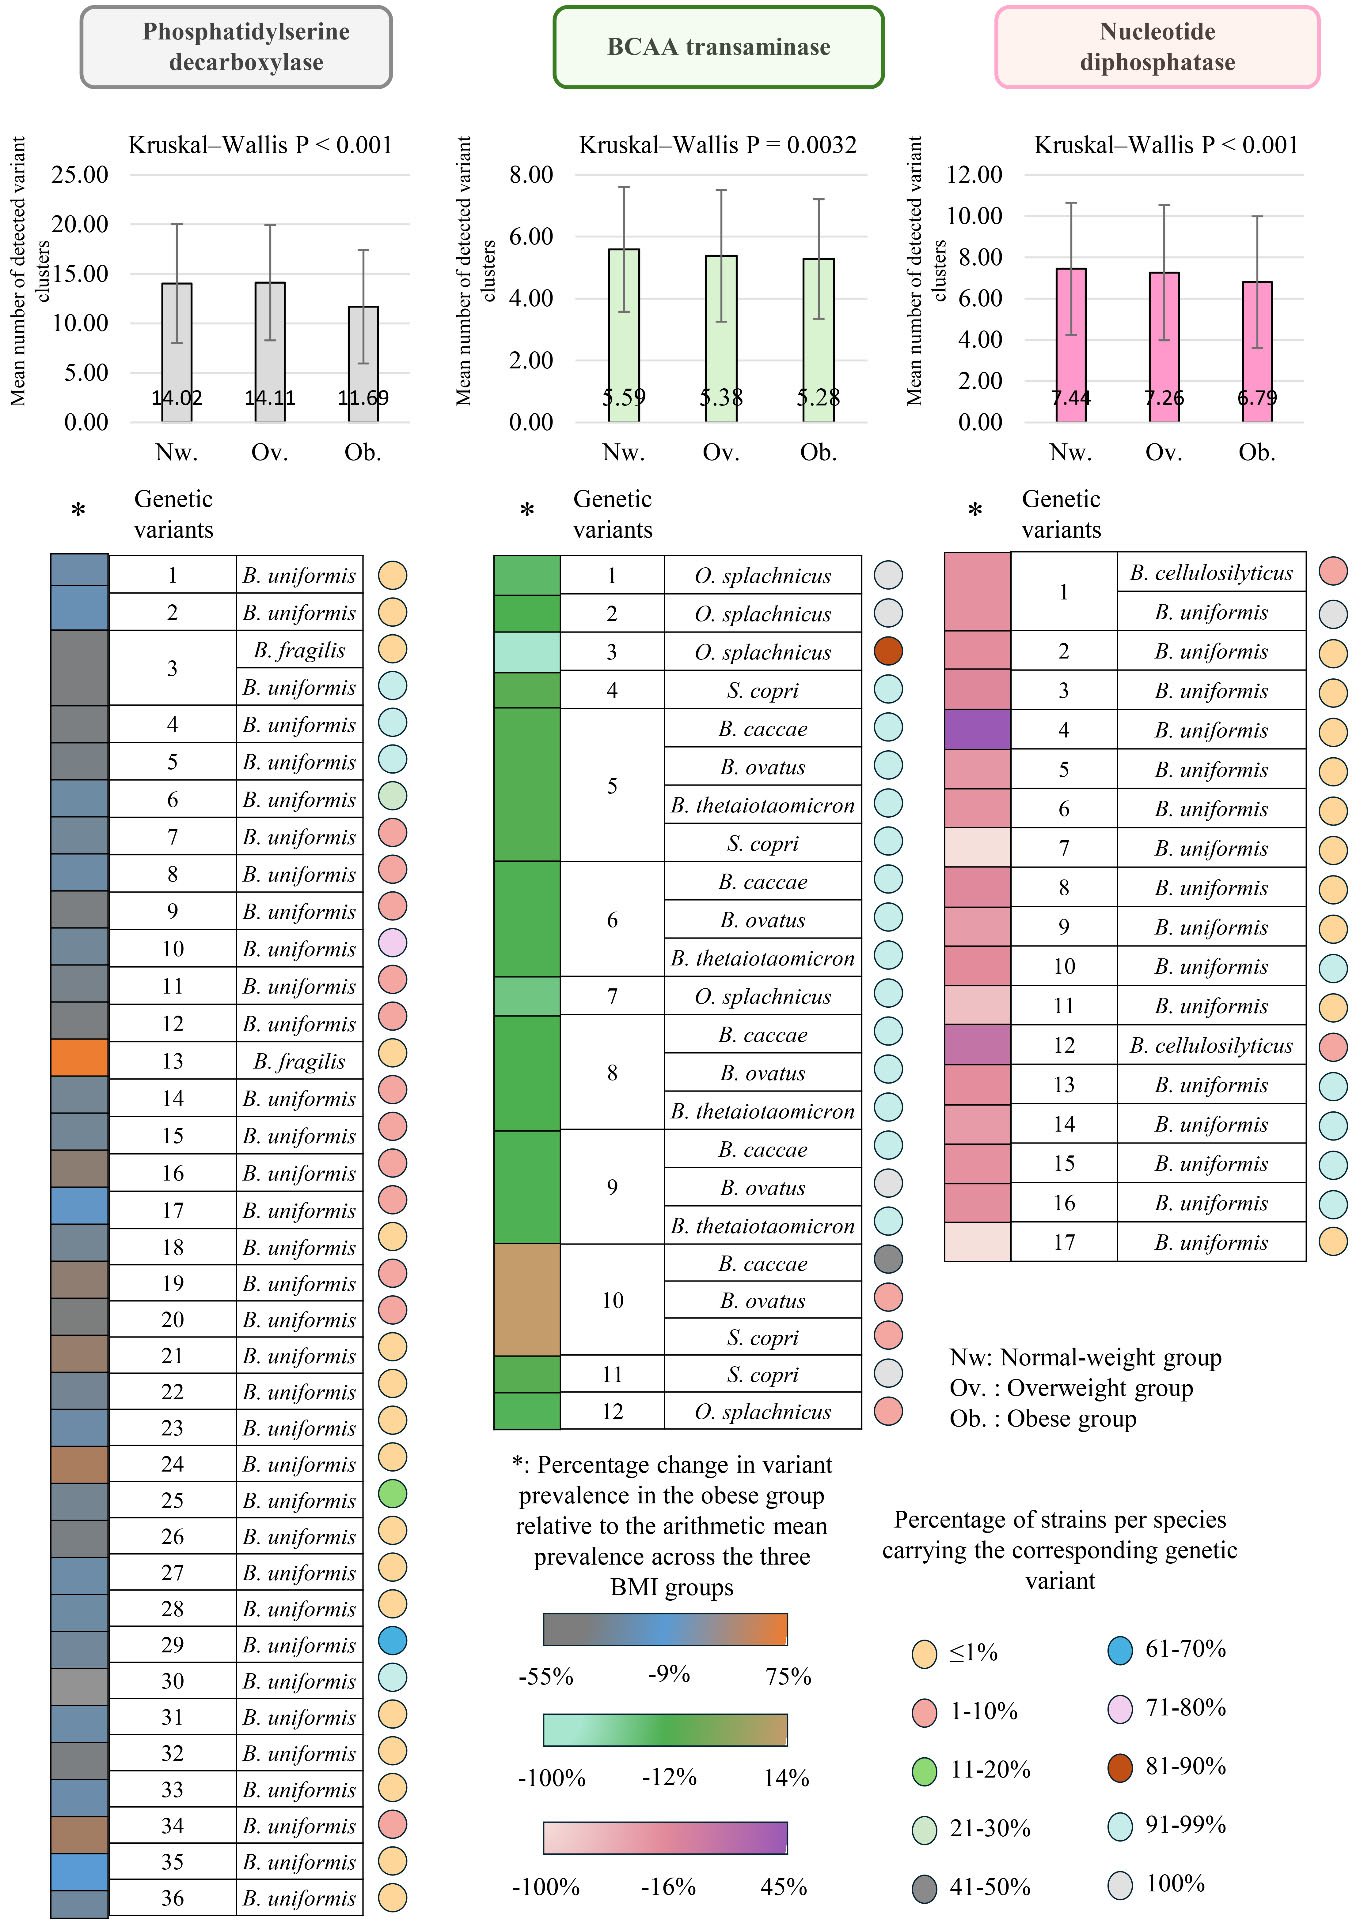
Figure 3. Obesity-associated functional remodeling involves differences in strain-level enzyme variant distribution and variant-cluster richness. Bar plots show the mean ± standard deviation of genetic variant clusters detected per sample for the three BMI-associated enzymatic functions. Kruskal-Wallis P values are reported above the plots. The accompanying tables indicate the species carrying each variant and the proportion of strains harboring it. The three heatmaps display the percentage change in the prevalence of each variant in the obese group relative to the arithmetic mean prevalence across the normal-weight, overweight, and obese groups. BCAA: Branched-chain amino acid; BMI: body mass index.
Accordingly, qualitative differences in variant detection (prevalence) across BMI categories emerged from metagenomic profiling [Figure 3 and Supplementary Table 26]. A limited number of low-prevalence variants for nucleotide diphosphatase (variants 7 and 17) and branched-chain amino acid transaminase (variant 3) were detected exclusively in normal-weight individuals. Although these variants were supported by a limited number of sequences and represented a small fraction of the total strain-level diversity, their restricted detection suggests that specific low-prevalence variants may be preferentially depleted along the BMI gradient. In contrast, most phosphatidylserine decarboxylase variants were shared across BMI categories, although the mean number of variant clusters detected per sample was lower in obese individuals [Figure 3 and Supplementary Table 26].
Comparison of prevalence among shared variants revealed that 10 of the 15 shared nucleotide diphosphatase variants and 29 of the 35 shared phosphatidylserine decarboxylase variants showed lower prevalence in obese individuals relative to the arithmetic mean prevalence across the three BMI groups. The corresponding percentage changes ranged from -60.8% to -1.8% for nucleotide diphosphatase and from -54.8% to -0.1% for phosphatidylserine decarboxylase [Figure 3 and Supplementary Table 26]. This coordinated pattern across variants associated with different species, including species showing comparable taxonomic abundance across BMI categories, is consistent with a redistribution of strain-level enzyme variant prevalence across BMI groups and supports their potential functional relevance to obesity.
In contrast, branched-chain amino acid transaminase exhibited a more heterogeneous pattern [Figure 3], with variants 4, 5, 10, and 11, associated with S. copri and Bacteroides species, showing higher prevalence in obese individuals relative to the arithmetic mean prevalence across the three BMI groups, with increases ranging from 1.1% to 14.0%.
Taken together, these results suggest that obesity-associated functional rearrangements of the gut microbiome include differences in variant-cluster richness as well as in the prevalence and distribution of individual strain-level enzyme variants. This identifies strain-level enzyme variant distribution as an additional dimension of obesity-associated microbiome variation and provides candidate variants for future functional and experimental investigation.
Study limitations
This study has some limitations that should be acknowledged. The integration of metagenomic datasets from 11 independent BioProjects increased the overall sample size and broadened the population coverage of the study, but also introduced heterogeneity related to cohort composition, sequencing platforms and depth, library preparation, and DNA extraction procedures. Reprocessing all datasets through the same quality-control and bioinformatic pipeline improved cross-study comparability, although residual technical and cohort-related effects could not be completely eliminated. Moreover, BMI categories were unevenly represented across BioProjects and geographic regions, while age and sex were available only for subsets of cohorts. Restricting the analysis to samples with complete metadata would have substantially reduced both sample size and study representation and could have introduced additional selection bias. A targeted sensitivity analysis excluding the largest BioProject showed that the small global association with BMI remained detectable, although concordance at the individual-feature level was only partial. Because the excluded BioProject contributed 290 of the 480 obese individuals, study-related effects could not be disentangled from the substantial reduction in sample size and the altered representation of the obese group.
Residual confounding related to study source, geographic origin, age, sex, diet, medication use, and other unmeasured host characteristics therefore cannot be totally excluded.
The use of BMI as the principal criterion for defining obesity warrants consideration in light of both its practical value and its intrinsic limitations. The cut-offs adopted in this study are based on internationally recognized BMI categories and have been widely applied in epidemiological and gut microbiome research, providing a standardized framework for comparing normal-weight, overweight, and obese populations across independent cohorts[31,80,81]. The use of these categories was therefore appropriate for harmonizing the heterogeneous publicly available datasets included in the present multi-cohort analysis. Nevertheless, BMI remains an indirect measure of adiposity and does not distinguish fat mass from lean mass or adequately capture visceral adiposity and body fat distribution. Moreover, the relationship between BMI, adiposity, and metabolic risk may differ across populations, while individuals within the same BMI category may display substantially different metabolic profiles, including metabolically healthy and metabolically unhealthy obesity phenotypes[82-85]. Thus, while BMI-based classification enabled consistent stratification across the included studies, it may have provided limited resolution for identifying microbiome associations more specifically related to body composition, adipose tissue distribution, or metabolic health.
The cross-sectional nature of the study limits the interpretation of temporal and causal relationships between microbiome features and obesity. Functional annotations provide information on microbial genetic potential rather than direct measurements of gene expression, enzymatic activity, or metabolite production. Similarly, the 80% amino acid identity and coverage thresholds used in the strain-level analysis define operational protein sequence clusters and do not demonstrate catalytic or functional divergence. Proteins assigned to different clusters may retain equivalent functions, whereas proteins grouped within the same cluster may still differ at functionally relevant residues. Structural prediction, active-site comparison, phylogenetic functional inference, and biochemical validation will therefore be required to establish whether the identified clusters encode proteins with distinct activities. The predominance of Bacteroides uniformis in two enzyme panels should also be considered when interpreting the broader applicability of these sequence-cluster patterns. Functional richness estimates may retain some sensitivity to sequencing depth despite standardized data processing. In addition, PLS, PLS-DA, and Random Forest were applied primarily as complementary exploratory approaches for feature prioritization rather than as independently validated predictive models. Overall, the present findings provide a foundation for future investigations integrating harmonized clinical metadata, body-composition and metabolic measurements, batch-aware statistical approaches, structural and functional characterization of the identified protein sequence clusters, and complementary multi-omic or experimental validation.
CONCLUSIONS
Using an integrated multivariate and machine learning-based statistical workflow, we examined the relationship between gut microbiome composition, functional potential, and obesity across a wide BMI spectrum represented by 1,543 individuals. Consistent with previous reports, obesity was not associated with major alterations in gut community structure or species richness. Instead, it was associated with gradual changes in the relative abundance of specific taxa, including increases in C. fessum, P. pectinovora, and S. copri, and decreases in E. citroniae and B. intestinalis. These findings suggest that compositional changes in obesity are often subtle, highlighting the importance of high-resolution methods for accurate analysis.
By integrating taxonomic profiling with systematic functional annotation, we identified consistent patterns of metabolic remodeling associated with higher BMI. In particular, obesity corresponded with enrichment of functions related to branched-chain amino acid metabolism, anabolic and biosynthetic processes, and nucleotide turnover, along with a reduction in pathways involved in short-chain fatty acid production, oxidative metabolism, and vitamin biosynthesis. The extensive multi-cohort nature of the dataset not only increased confidence in the observed functional associations but also allowed for a more comprehensive understanding of gut microbiome changes across diverse populations. Functional back-tracing further showed that only a limited subset of microbial species contributes to BMI-associated enzymatic activities, while other taxa with compositional variation contribute only marginally to these functional changes.
Through strain-resolved analyses based on comparative genomics and metagenomics, we went beyond classical analytical methods to examine how the distribution of genetic clusters across representative enzymes correlates with BMI. Our data indicate that obesity-associated functional remodeling is associated not only with species-level shifts but also with differences in strain-level enzyme protein-cluster richness, distribution, and prevalence across BMI groups. This strain-level enzyme cluster distribution provides a previously underexplored perspective on microbiome variability, providing additional resolution on metagenomic differences that are not captured by species-level abundance alone and helping to reconcile discrepancies from prior taxonomic studies.
Overall, our findings underscore the value of combining large-scale shotgun metagenomic data with integrated functional and strain-level comparative genomics analyses to improve understanding of host-microbiome interactions. Moreover, the discovery of metabolic pathways and strain-level genetic clusters linked to obesity offers a basis for future functional and experimental validation and could contribute to a deeper understanding of this complex condition.
DECLARATIONS
Author contributions
Data acquisition: Petraro S
Formal analysis: Petraro S
Writing - original draft: Petraro S
Data curation: Tarracchini C, Mancabelli L, Lugli GA
Supervision: Turroni F, Ventura M, Milani C
Conceptualization: Ventura M, Milani C
Writing - review & editing: Turroni F, Ventura M, Milani C
Availability of data and materials
The raw whole-genome shotgun metagenomic datasets analyzed in this study are publicly available through the NCBI Sequence Read Archive under the following BioProject accession numbers: PRJEB1220, PRJEB17632, PRJEB1786, PRJEB4336, PRJEB5224, PRJEB6070, PRJEB7774, PRJEB8347, PRJNA32089, PRJNA422434, and PRJNA48479. Sample-level metadata and information on the datasets included in the analyses are provided in the Supplementary Materials.
AI and AI-assisted tools statement
During the preparation of this manuscript, ChatGPT (GPT-5.4 Thinking, OpenAI; released 2026-03-05) was used for language editing. The tool did not influence the study design, data collection, analysis, interpretation, or the scientific content of the work. All authors take full responsibility for the accuracy, integrity, and final content of the manuscript.
Financial support and sponsorship
Turroni F is funded by Piano di Sviluppo e Coesione of the Italian Ministry of Health 2014-2020 (Grant Number T5-AN-11). We thank GenProbio Srl for the financial support of the Laboratory of Probiogenomics.
Conflicts of interest
Ventura M is the Editor-in-Chief of the journal Microbiome Research Reports; Turroni F is an Executive Editor of the journal Microbiome Research Reports; Mancabelli L, Lugli GA, Turroni F and Milani C are Senior Editors of the journal Microbiome Research Reports. Ventura M, Mancabelli L, Lugli GA, Turroni F and Milani C were not involved in any steps of editorial processing, notably including reviewers’ selection, manuscript handling, or decision-making. The other authors declare that there are no conflicts of interest.
Ethical approval and consent to participate
Not applicable.
Consent for publication
Not applicable.
Copyright
© The Author(s) 2026.
Supplementary Materials
REFERENCES
1. Ng M, Fleming T, Robinson M, et al. Global, regional, and national prevalence of overweight and obesity in children and adults during 1980-2013: a systematic analysis for the Global Burden of Disease Study 2013. Lancet. 2014;384:766-81.
2. Xue H, Zhang X, Li D, et al. Relevance of physical activities, sedentary behaviors, and genetic predisposition in body fatness: population-based study on Chinese adults. Obes Facts. 2021;14:346-56.
3. Thayer KA, Heindel JJ, Bucher JR, Gallo MA. Role of environmental chemicals in diabetes and obesity: a national toxicology program workshop review. Environ Health Perspect. 2012;120:779-89.
4. Kawai T, Autieri MV, Scalia R. Adipose tissue inflammation and metabolic dysfunction in obesity. Am J Physiol Cell Physiol. 2021;320:C375-91.
6. Hu X, Yu C, He Y, et al. Integrative metagenomic analysis reveals distinct gut microbial signatures related to obesity. BMC Microbiol. 2024;24:119.
7. Cuinat C, Pan J, Comelli EM. Host-dependent alteration of the gut microbiota: the role of luminal microRNAs. Microbiome Res Rep. 2025;4:15.
8. Spiljar M, Merkler D, Trajkovski M. The immune system bridges the gut microbiota with systemic energy homeostasis: focus on TLRs, mucosal barrier, and SCFAs. Front Immunol. 2017;8:1353.
9. Chanda D, De D. Meta-analysis reveals obesity associated gut microbial alteration patterns and reproducible contributors of functional shift. Gut Microbes. 2024;16:2304900.
10. Sun J, Germain A, Kaglan G, et al. The visceral adipose tissue bacterial microbiota provides a signature of obesity based on inferred metagenomic functions. Int J Obes (Lond). 2023;47:1008-22.
11. Hul M, Cani PD. The gut microbiota in obesity and weight management: microbes as friends or foe? Nat Rev Endocrinol. 2023;19:258-71.
12. Vos WM, Tilg H, Van Hul M, Cani PD. Gut microbiome and health: mechanistic insights. Gut. 2022;71:1020-32.
13. Li H, Zhang L, Li J, et al. Resistant starch intake facilitates weight loss in humans by reshaping the gut microbiota. Nat Metab. 2024;6:578-97.
14. Takeuchi T, Kubota T, Nakanishi Y, et al. Gut microbial carbohydrate metabolism contributes to insulin resistance. Nature. 2023;621:389-95.
15. Wu C, Yang F, Zhong H, et al. Obesity-enriched gut microbe degrades myo-inositol and promotes lipid absorption. Cell Host Microbe. 2024;32:1301-1314.e9.
16. Fan Y, Pedersen O. Gut microbiota in human metabolic health and disease. Nat Rev Microbiol. 2021;19:55-71.
17. Pedersen HK, Gudmundsdottir V, Nielsen HB, et al.; MetaHIT Consortium. Human gut microbes impact host serum metabolome and insulin sensitivity. Nature. 2016;535:376-81.
18. Ecklu-Mensah G, Choo-Kang C, Maseng MG, et al. Gut microbiota and fecal short chain fatty acids differ with adiposity and country of origin: the METS-microbiome study. Nat Commun. 2023;14:5160.
19. Pinart M, Dötsch A, Schlicht K, et al. Gut microbiome composition in obese and non-obese persons: a systematic review and meta-analysis. Nutrients. 2021;14:12.
20. Sze MA, Schloss PD. Looking for a signal in the noise: revisiting obesity and the microbiome. mBio. 2016;7:e01018-16.
21. Lin Y, Xu Z, Yeoh YK, et al. Combing fecal microbial community data to identify consistent obesity-specific microbial signatures and shared metabolic pathways. iScience. 2023;26:106476.
22. Meijnikman AS, Aydin O, Prodan A, et al. Distinct differences in gut microbial composition and functional potential from lean to morbidly obese subjects. J Intern Med. 2020;288:699-710.
23. Barone M, Garelli S, Rampelli S, et al. Multi-omics gut microbiome signatures in obese women: role of diet and uncontrolled eating behavior. BMC Med. 2022;20:500.
24. Louis S, Tappu RM, Damms-Machado A, Huson DH, Bischoff SC. Characterization of the gut microbial community of obese patients following a weight-loss intervention using whole metagenome shotgun sequencing. PLoS One. 2016;11:e0149564.
25. Viglioli M, Rizzo SM, Alessandri G, et al. Investigating drug-gut microbiota interactions: reductive and hydrolytic metabolism of oral glucocorticoids by in vitro artificial gut microbiota. Int J Pharm. 2024;665:124663.
26. Milani C, Lugli GA, Fontana F, et al. METAnnotatorX2: a comprehensive tool for deep and shallow metagenomic data set analyses. mSystems. 2021;6:10.1128/msystems.00583-21.
27. Bansal P, Morgat A, Axelsen KB, et al. Rhea, the reaction knowledgebase in 2022. Nucleic Acids Res. 2022;50:D693-700.
28. The UniProt Consortium. UniProt: the universal protein knowledgebase in 2025. Nucleic Acids Res. 2025;53:D609-17.
29. Quevillon E, Silventoinen V, Pillai S, et al. InterProScan: protein domains identifier. Nucleic Acids Res. 2005;33:W116-20.
30. Hauser M, Steinegger M, Söding J. MMseqs software suite for fast and deep clustering and searching of large protein sequence sets. Bioinformatics. 2016;32:1323-30.
32. Mancabelli L, Milani C, De Biase R, et al. Taxonomic and metabolic development of the human gut microbiome across life stages: a worldwide metagenomic investigation. mSystems. 2024;9:e0129423.
33. Tarracchini C, Alessandri G, Fontana F, et al. Genetic strategies for sex-biased persistence of gut microbes across human life. Nat Commun. 2023;14:4220.
34. de la Cuesta-Zuluaga J, Kelley ST, Chen Y, et al. Age- and sex-dependent patterns of gut microbial diversity in human adults. mSystems. 2019:4.
35. Gacesa R, Kurilshikov A, Vich Vila A, et al. Environmental factors shaping the gut microbiome in a Dutch population. Nature. 2022;604:732-9.
36. Palmas V, Pisanu S, Madau V, et al. Gut microbiota markers associated with obesity and overweight in Italian adults. Sci Rep. 2021;11:5532.
37. Woting A, Pfeiffer N, Loh G, Klaus S, Blaut M. Clostridium ramosum promotes high-fat diet-induced obesity in gnotobiotic mouse models. mBio. 2014;5:e01530-14.
38. Tett A, Pasolli E, Masetti G, Ercolini D, Segata N. Prevotella diversity, niches and interactions with the human host. Nat Rev Microbiol. 2021;19:585-99.
39. Al-Sulaiti H, Diboun I, Agha MV, et al. Metabolic signature of obesity-associated insulin resistance and type 2 diabetes. J Transl Med. 2019;17:348.
40. Grundy SM, Cleeman JI, Daniels SR, et al.; American Heart Association. Diagnosis and management of the metabolic syndrome: an american heart association/national heart, lung, and blood institute scientific statement. Circulation. 2005;112:2735-52.
41. Li TT, Chen X, Huo D, et al.; JRI Live Cell Bank Consortium. Microbiota metabolism of intestinal amino acids impacts host nutrient homeostasis and physiology. Cell Host Microbe. 2024;32:661-675.e10.
42. Choi BH, Hyun S, Koo SH. The role of BCAA metabolism in metabolic health and disease. Exp Mol Med. 2024;56:1552-9.
43. De Filippis F, Pellegrini N, Vannini L, et al. High-level adherence to a Mediterranean diet beneficially impacts the gut microbiota and associated metabolome. Gut. 2016;65:1812-21.
44. Blanco-Míguez A, Gálvez EJC, Pasolli E, et al. Extension of the Segatella copri complex to 13 species with distinct large extrachromosomal elements and associations with host conditions. Cell Host Microbe. 2023;31:1804-1819.e9.
45. Liu R, Hong J, Xu X, et al. Gut microbiome and serum metabolome alterations in obesity and after weight-loss intervention. Nat Med. 2017;23:859-68.
46. Verdam FJ, Fuentes S, de Jonge C, et al. Human intestinal microbiota composition is associated with local and systemic inflammation in obesity. Obesity (Silver Spring). 2013;21:E607-15.
47. Zhao X, Han Q, Liu Y, Sun C, Gang X, Wang G. The relationship between branched-chain amino acid related metabolomic signature and insulin resistance: a systematic review. J Diabetes Res. 2016;2016:2794591.
48. Samms RJ, Zhang G, He W, et al. Tirzepatide induces a thermogenic-like amino acid signature in brown adipose tissue. Mol Metab. 2022;64:101550.
49. Sinha R, Fisch G, Teague B, et al. Prevalence of impaired glucose tolerance among children and adolescents with marked obesity. N Engl J Med. 2002;346:802-10.
50. Meng F, Guo Z, Hu Y, et al. CD73-derived adenosine controls inflammation and neurodegeneration by modulating dopamine signalling. Brain. 2019;142:700-18.
51. Turnbaugh PJ, Ley RE, Mahowald MA, Magrini V, Mardis ER, Gordon JI. An obesity-associated gut microbiome with increased capacity for energy harvest. Nature. 2006;444:1027-31.
52. Robia J, Hammad A. The gut microbiome and its role in obesity and metabolic disease. InterConf+. 2025:151-9.
53. Nie X, Chen J, Ma X, et al. A metagenome-wide association study of gut microbiome and visceral fat accumulation. Comput Struct Biotechnol J. 2020;18:2596-609.
54. de la Cuesta-Zuluaga J, Huus KE, Youngblut ND, Escobar JS, Ley RE. Obesity is the main driver of altered gut microbiome functions in the metabolically unhealthy. Gut Microbes. 2023;15:2246634.
55. Marcus F, Gontero B, Harrsch PB, Rittenhouse J. Amino acid sequence homology among fructose-1,6-bisphosphatases. Biochem Biophys Res Commun. 1986;135:374-81.
56. Sokaribo A, Novakovski BAA, Cotelesage J, White AP, Sanders D, Goldie H. Kinetic and structural analysis of Escherichia coli phosphoenolpyruvate carboxykinase mutants. Biochim Biophys Acta Gen Subj. 2020;1864:129517.
57. Brown EM, Clardy J, Xavier RJ. Gut microbiome lipid metabolism and its impact on host physiology. Cell Host Microbe. 2023;31:173-86.
58. Vincent HK, Taylor AG. Biomarkers and potential mechanisms of obesity-induced oxidant stress in humans. Int J Obes (Lond). 2006;30:400-18.
59. Rhee SG, Woo HA, Kil IS, Bae SH. Peroxiredoxin functions as a peroxidase and a regulator and sensor of local peroxides. J Biol Chem. 2012;287:4403-10.
61. Pena N, Dranow DM, Hu Y, Escamilla Y, Bullard JM. Characterization and structure determination of prolyl-tRNA synthetase from Pseudomonas aeruginosa and development as a screening platform. Protein Sci. 2019;28:727-37.
62. Salvi PS, Cowles RA. Butyrate and the intestinal epithelium: modulation of proliferation and inflammation in homeostasis and disease. Cells. 2021;10:1775.
63. Canfora EE, Meex RCR, Venema K, Blaak EE. Gut microbial metabolites in obesity, NAFLD and T2DM. Nat Rev Endocrinol. 2019;15:261-73.
64. Kosaka T, Tsushima Y, Shiota Y, et al. Membrane potential-requiring succinate dehydrogenase constitutes the key to propionate oxidation and is unique to syntrophic propionate-oxidizing bacteria. Microbes Environ. 2023:38.
66. Imber M, Loi VV, Reznikov S, et al. The aldehyde dehydrogenase AldA contributes to the hypochlorite defense and is redox-controlled by protein S-bacillithiolation in Staphylococcus aureus. Redox Biol. 2018;15:557-68.
67. Volodina E, Steinbüchel A. (S)-3-hydroxyacyl-CoA dehydrogenase/enoyl-CoA hydratase (FadB') from fatty acid degradation operon of Ralstonia eutropha H16. AMB Express. 2014;4:69.
68. Xia Y, Lu L, Wang L, Qiu Y, Liu X, Ge W. Multi-omics analyses reveal altered gut microbial thiamine production in obesity. Front Microbiol. 2025;16:1516393.
69. Thamm AM, Li G, Taja-Moreno M, et al. A strictly monofunctional bacterial hydroxymethylpyrimidine phosphate kinase precludes damaging errors in thiamin biosynthesis. Biochem J. 2017;474:2887-95.
70. Mann ER, Lam YK, Uhlig HH. Short-chain fatty acids: linking diet, the microbiome and immunity. Nat Rev Immunol. 2024;24:577-95.
71. Pham NHT, Joglekar MV, Wong WKM, Nassif NT, Simpson AM, Hardikar AA. Short-chain fatty acids and insulin sensitivity: a systematic review and meta-analysis. Nutr Rev. 2024;82:193-209.
72. Liu P, Wang Y, Yang G, et al. The role of short-chain fatty acids in intestinal barrier function, inflammation, oxidative stress, and colonic carcinogenesis. Pharmacol Res. 2021;165:105420.
73. Peng L, Li ZR, Green RS, Holzman IR, Lin J. Butyrate enhances the intestinal barrier by facilitating tight junction assembly via activation of AMP-activated protein kinase in Caco-2 cell monolayers. J Nutr. 2009;139:1619-25.
74. Cani PD, Amar J, Iglesias MA, et al. Metabolic endotoxemia initiates obesity and insulin resistance. Diabetes. 2007;56:1761-72.
75. Cox AJ, West NP, Cripps AW. Obesity, inflammation, and the gut microbiota. Lancet Diabetes Endocrinol. 2015;3:207-15.
76. Companys J, Gosalbes MJ, Pla-Pagà L, et al. Gut microbiota profile and its association with clinical variables and dietary intake in overweight/obese and lean subjects: a cross-sectional study. Nutrients. 2021;13:2032.
77. Zhernakova DV, Wang D, Liu L, et al.; Lifelines Cohort Study. Host genetic regulation of human gut microbial structural variation. Nature. 2024;625:813-21.
78. Andreu-Sánchez S, Blanco-Míguez A, Wang D, et al. Global genetic diversity of human gut microbiome species is related to geographic location and host health. Cell. 2025;188:3942-3959.e9.
79. Huang KD, Müller M, Sivapornnukul P, et al. Dietary selective effects manifest in the human gut microbiota from species composition to strain genetic makeup. Cell Rep. 2024;43:115067.
80. Peters BA, Shapiro JA, Church TR, et al. A taxonomic signature of obesity in a large study of American adults. Sci Rep. 2018;8:9749.
81. Asnicar F, Manghi P, Fackelmann G, et al. Gut micro-organisms associated with health, nutrition and dietary interventions. Nature. 2026;650:450-8.
82. Sweatt K, Garvey WT, Martins C. Strengths and limitations of BMI in the diagnosis of obesity: what is the path forward? Curr Obes Rep. 2024;13:584-95.
83. Rubino F, Cummings DE, Eckel RH, et al. Definition and diagnostic criteria of clinical obesity. Lancet Diabetes Endocrinol. 2025;13:221-62.
Cite This Article
 Open Access
How to Cite
Petraro S, Tarracchini C, Mancabelli L, Lugli GA, Turroni F, Ventura M, Milani C. Sequence diversity of gut microbial enzymes reveals strain-level associations with obesity. Microbiome Res Rep. 2026;5:27. https://dx.doi.org/10.20517/mrr.2026.27
Download Citation
If you have the appropriate software installed, you can download article citation data to the citation manager of your choice. Simply select your manager software from the list below and click on download.
Export Citation File
Type of Import
Tips on Downloading Citation
Citation Manager File Format
Type of Import
Direct Import: When the Direct Import option is selected (the default state), a dialogue box will give you the option to Save or Open the downloaded citation data. Choosing Open will either launch your citation manager or give you a choice of applications with which to use the metadata. The Save option saves the file locally for later use.
Indirect Import: When the Indirect Import option is selected, the metadata is displayed and may be copied and pasted as needed.
About This Article
Special Topic
Copyright

Data & Comments
Data
0










Comments
Comments must be written in English. Spam, offensive content, impersonation, and private information will not be permitted. If any comment is reported and identified as inappropriate content by OAE staff, the comment will be removed without notice. If you have any queries or need any help, please contact us at [email protected].