




Residual stress mapping of additively manufactured Inconel 718 via synchrotron X-ray diffraction
 0
0 
Abstract
Laser Powder Bed Fusion (LPBF) of Inconel 718 induces complex residual stresses that can lead to premature failure. This study investigates the residual stress field of an as-built plate using high-energy synchrotron X-ray diffraction. Cross-verification of peak-fitting algorithms demonstrated that the Pseudo-Voigt function was marginally more accurate, with peak-fitting-related uncertainties in stress calculation remaining below 15.3 MPa. The reconstructed field reveals an anisotropic “core compression, edge tension” pattern, dominated by longitudinal stresses. This pattern is fundamentally driven by the temperature gradient mechanism: constrained thermal expansion during heating induces compressive plastic deformation, which reverses to severe tension during constrained cooling shrinkage. This cycle imparts alternating downward ‘push’ and upward ‘pull’ bending moments at the edges. Ultimately, critical tensile stresses concentrate at lateral edges (reaching 791 MPa), resulting in macroscopic self-equilibration with a compressive core (-355 MPa). These insights can guide the optimization of scanning strategies to mitigate residual-stress-induced failures in additively manufactured components.
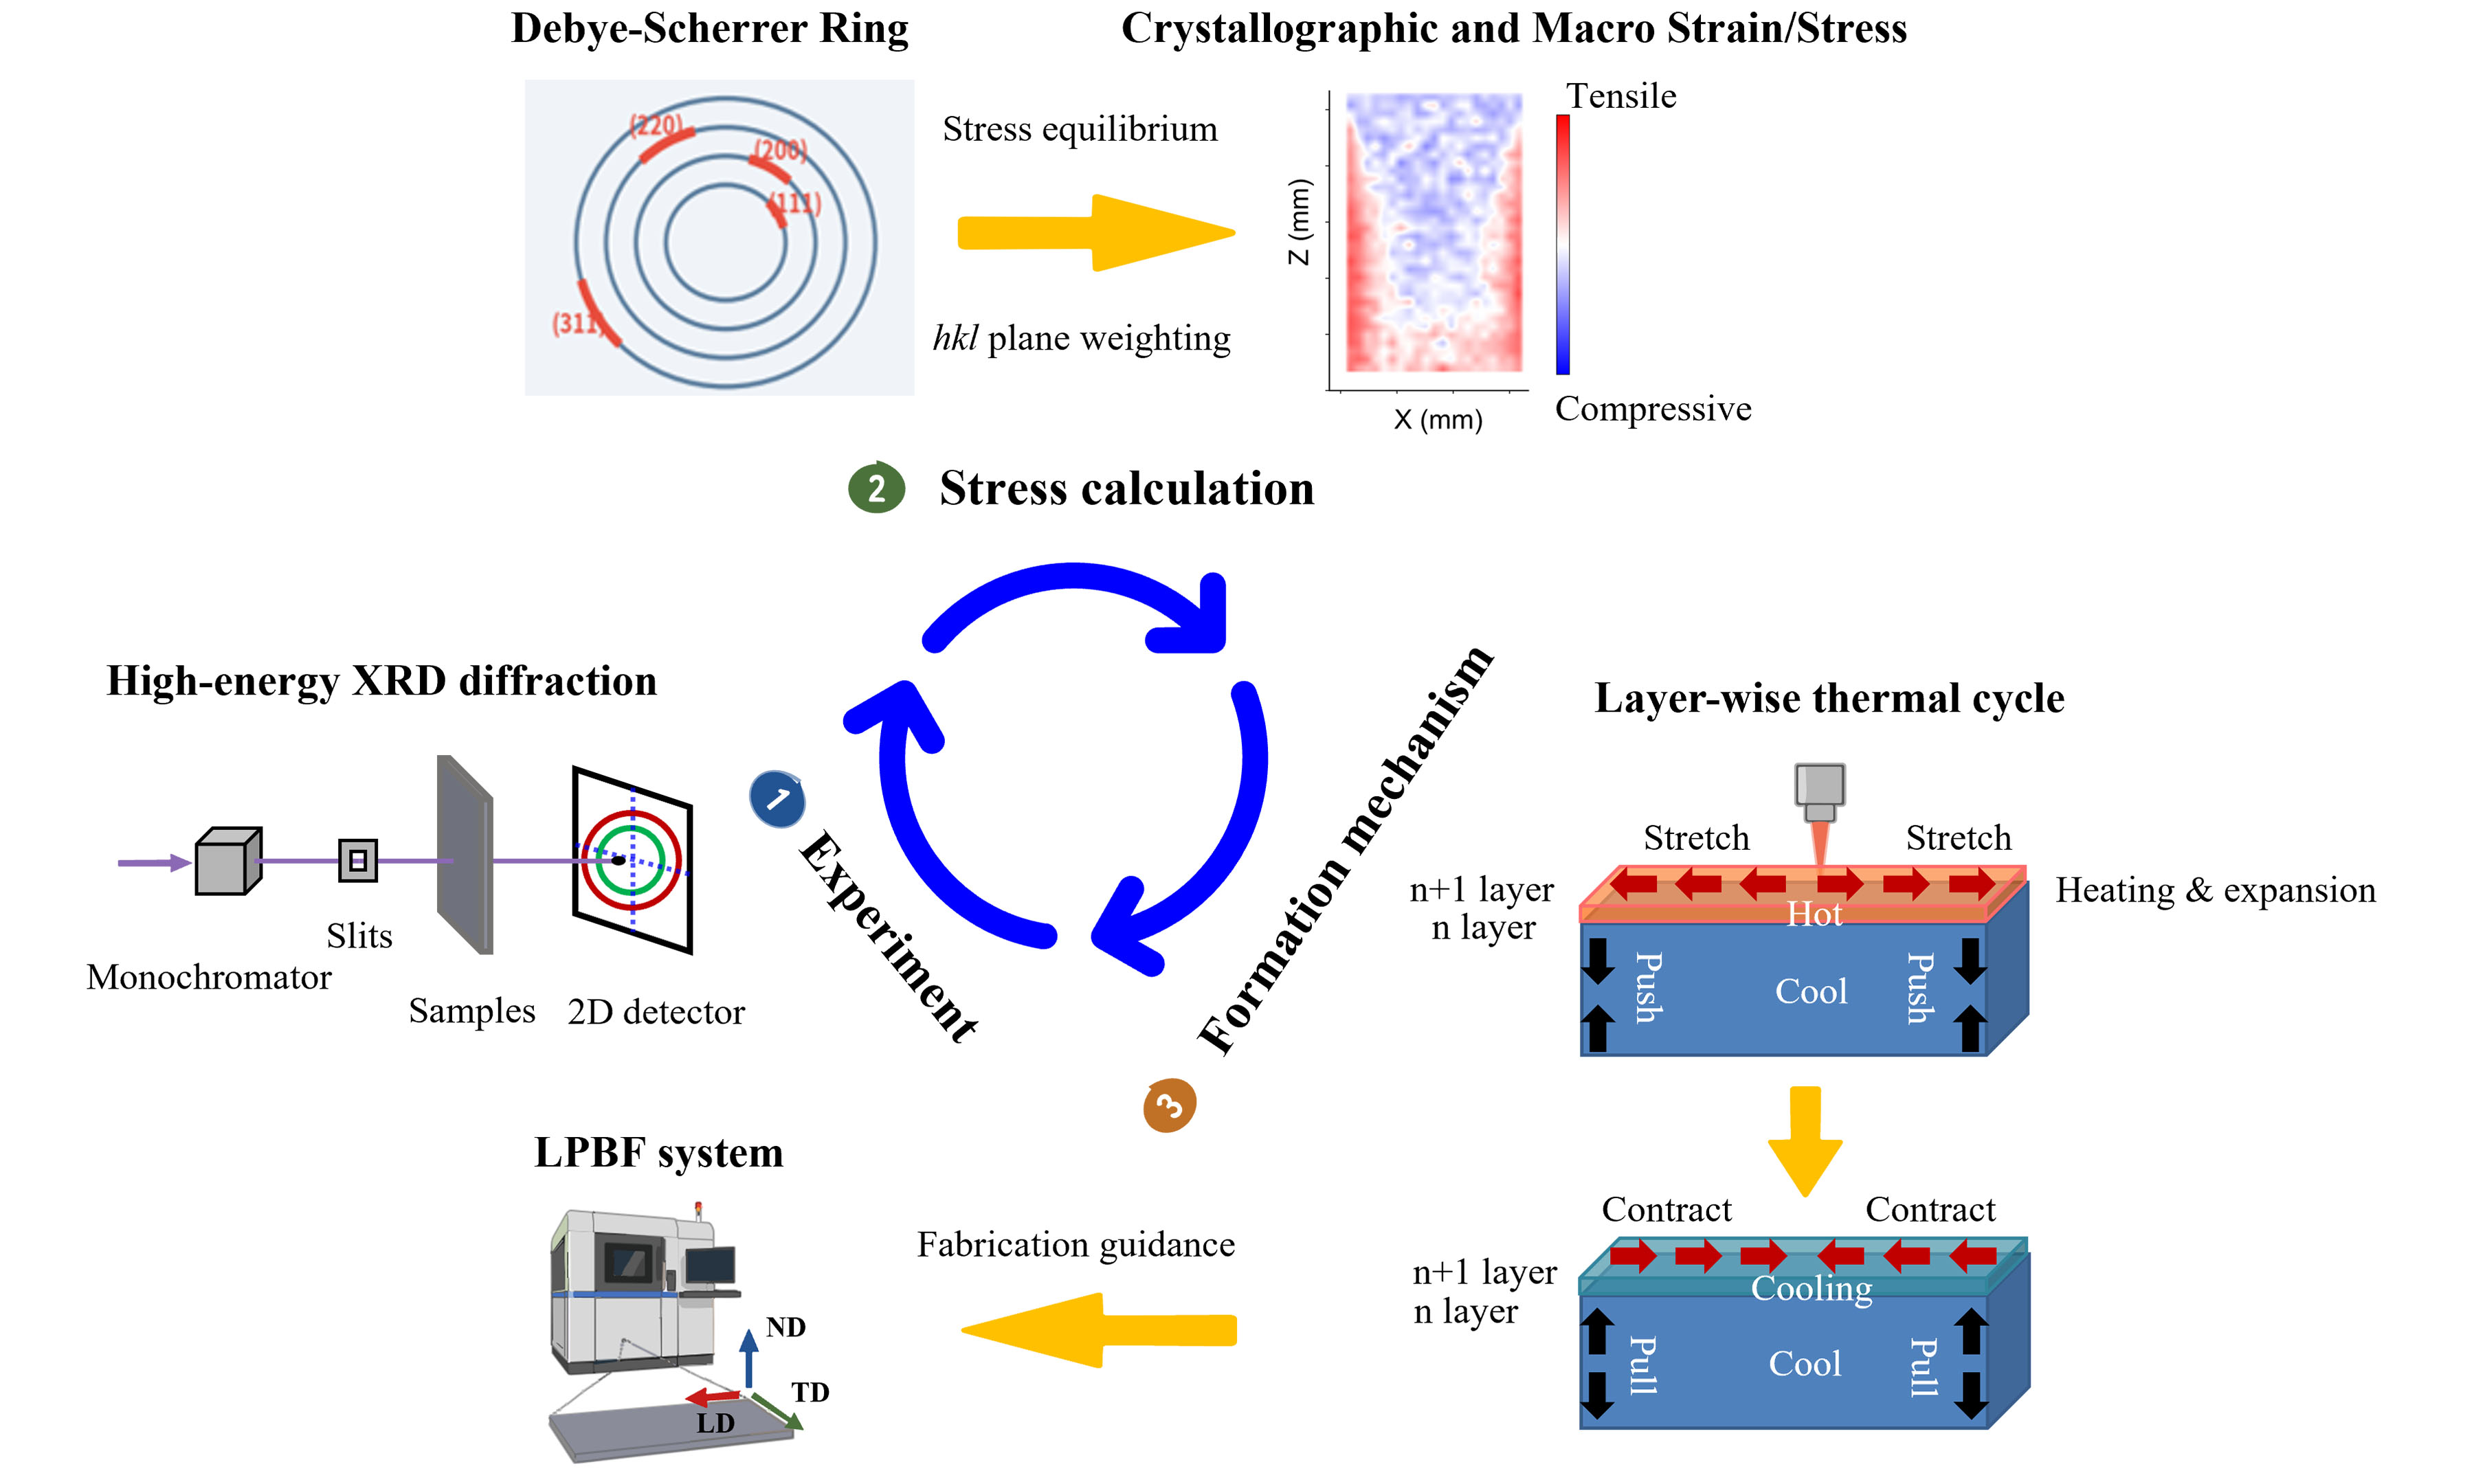
Keywords
INTRODUCTION
Nickel-based superalloys are indispensable materials for high-temperature and high-stress applications, such as aerospace engines, power-generation turbines, and chemical-processing equipment, due to their exceptional mechanical strength, creep resistance, and oxidation tolerance[1,2]. In recent years, additive manufacturing (AM), particularly Laser Powder Bed Fusion (LPBF), has emerged as a transformative technology for fabricating complex, lightweight, and high-performance parts with reduced material waste and shorter production cycles[3-6]. LPBF enables the layer-by-layer construction of components by selectively melting metal powder with a high-energy laser beam, offering unparalleled design flexibility[7,8].
However, residual stress accumulation remains a critical challenge in LPBF-processed nickel-based superalloys[9-12]. The rapid heating and cooling cycles inherent to the process create steep thermal gradients. As the molten metal solidifies and contracts, it is constrained by the cooler surrounding material, leading to the accumulation of severe stresses[13-15]. Residual stress can cause part distortion, premature cracking, and reduced fatigue life[11,16,17], thereby compromising the reliability and performance of AM components. Therefore, accurate experimental characterization of residual stresses is crucial for understanding and mitigating these negative effects.
To address these challenges, non-destructive techniques such as neutron diffraction and high-energy synchrotron X-ray diffraction (HEXRD) have become powerful tools for mapping internal stresses[18-20]. HEXRD, which utilizes high-energy photons, offers superior penetration depth and spatial resolution, making it well-suited for dense materials[21]. However, the analysis of HEXRD data from AM materials is complicated by crystallographic textures and microstructural heterogeneity, which often lead to asymmetric or broadened diffraction peaks[22-24]. Standard data analysis often relies on simplified assumptions regarding peak shapes, which may introduce systematic errors. Although previous studies have used synchrotron diffraction to link scan strategies to stress fields[22], a systematic evaluation of data-analysis approaches, such as the influence of peak-fitting models on the accuracy of stress reconstruction in textured AM materials, is lacking.
While numerical simulations offer qualitative insights into residual stress development, their predictive accuracy is often limited by simplifying assumptions about boundary conditions, thermal histories, and the uniformity of the solid-state material[24-32]. Because computational models cannot yet fully capture the intricate microstructural evolution inherent in AM[12,25,34], high-fidelity experimental measurements are indispensable. Ensuring experimental robustness through rigorous spatial strain mapping is thus critical for computational model calibration and validation.
In addition, the accurate interpretation of diffraction data from AM materials remains methodologically challenging. Standard characterization methods often overlook the systematic bias introduced by simplified symmetrical peak shapes when analyzing materials with complex crystallographic textures and dislocation entanglements generated by AM thermal cycling. Furthermore, the arbitrary determination of stress-free lattice parameters d0 without rigorous algorithmic optimization can introduce significant fundamental errors[22,23,33]. Therefore, a systematic investigation of peak-fitting profiles and standardized cross-validation protocols is required to bridge these methodological gaps and improve the accuracy of residual stress characterization in complex AM components[23,28,34,35].
This study aims to quantify the internal residual stress distribution in an as-built LPBF Inconel 718 (IN718) plate and elucidate the mechanisms governing its formation. The plate was analyzed to capture the stress gradients. HEXRD was employed to map the residual stress field. A key objective is to evaluate whether the choice of peak-profile function introduces systematic bias, given the anisotropic nature of the material. To ensure robust results, different d0 determination methods were compared, and three peak-fitting models (Gaussian, Pseudo-Voigt, and Pearson VII) were used to cross-check potential systematic errors and validate the final residual stress maps. The resulting maps reveal the magnitude and anisotropy of the residual stress field, and the physical origins of the extreme stress concentrations observed at the component edges are discussed. This study provides insights into the reliability of synchrotron-based residual stress measurement and contributes to a broader understanding of residual stress development and mitigation in nickel-based superalloys.
MATERIALS AND METHODS
Materials and sample preparation
A gas-atomized nickel-based superalloy powder was selected for use in an LPBF system. The powder exhibited a nominal particle size range of 15-53 µm. Its chemical composition is detailed in Table 1 and includes essential elements such as Ni, Cr, Nb, Mo, Ti, and Al, with Fe as the balance, in proportions designed to promote phase stability and high-temperature creep resistance.
Chemical composition of IN718 powder used for printing (wt.%)
| C | Si | P | N | O | Cr | Ni | Mo | Ti | Nb | Al | Co | Fe |
| 0.04 | 0.01 | 0.01 | 0.01 | 0.02 | 19.39 | 52.32 | 3.01 | 0.99 | 5.12 | 0.45 | 0.14 | Bal. |
During the build process using an FS301M LPBF system (Farsoon Technologies, Changsha, China), each powder layer was approximately 40 µm thick, with a hatch spacing of 100 µm, a laser scanning speed of 1,000 mm/s, a laser power of 270 W, and an effective laser spot size of approximately 70 µm. The stripe-pattern scanning strategy was employed with a stripe width of 10 mm, a bidirectional scan order, a zero-contour scanning strategy, and an interlayer rotation of 67°. The build platform, consisting of a 316L stainless steel substrate (301 × 301 × 40 mm3), was preheated to 200 °C, and the ambient environment was maintained under argon with an oxygen concentration below 0.1%. A rectangular plate measuring 45 × 80 × 3 mm3 was printed with a vertical build orientation parallel to the Z-axis. The plate was removed from the substrate upon completion, without any subsequent stress-relief heat treatment, leaving it in an “as-built” condition for analysis.
The experimental geometry and sample coordinates are illustrated in Figure 1. Macroscopic uniaxial tensile testing was performed at room temperature using an MTS Landmark servohydraulic test system (MTS Systems Corporation, Eden Prairie, MN, USA). A dog-bone specimen was machined from the LPBF IN718 with its loading axis parallel to the build direction. A strain rate of 0.00025 s-1 was applied in the elastic-yield stage, followed by a displacement rate of 0.0067 mm/s after yielding. The Young’s modulus was experimentally determined to be 189.5 GPa. Notably, the yield strength of the as-built IN718 part was 646 MPa from the tensile experiment, whereas the measured macroscopic residual stress reached a maximum of 791 MPa, which will be discussed in the RESULTS AND DISCUSSION section in detail.
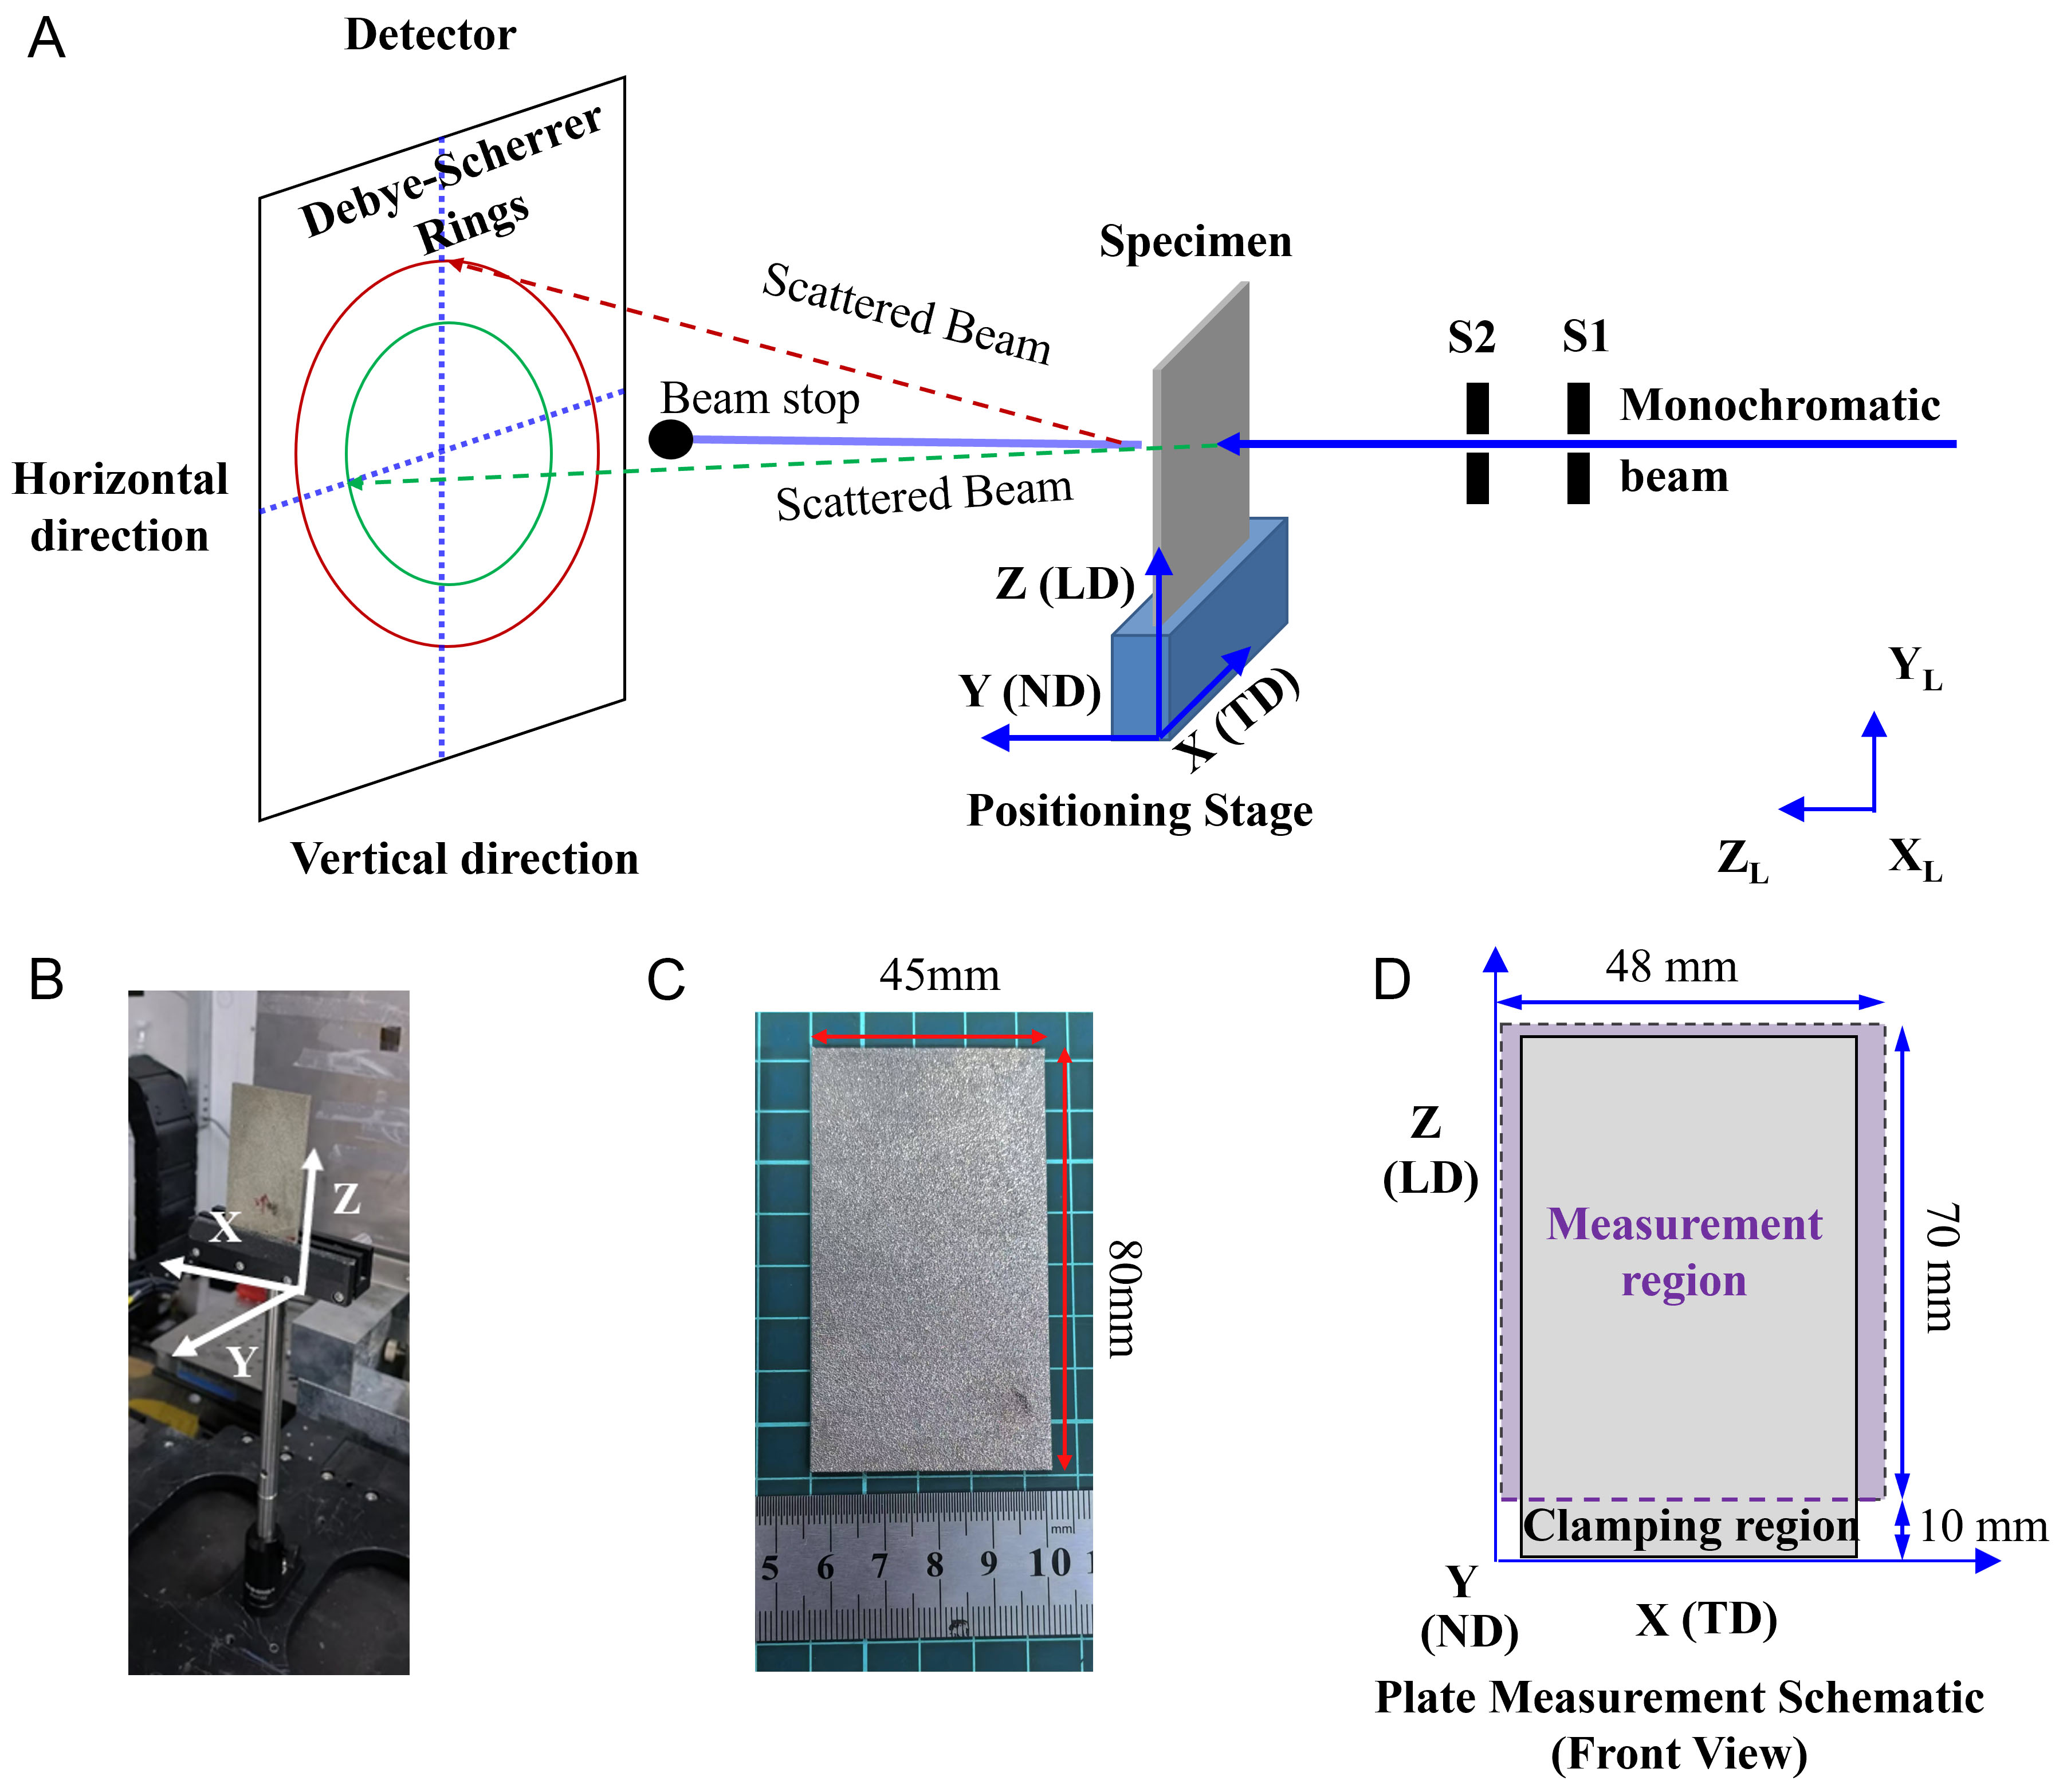
Figure 1. Schematic diagrams and experimental setup of residual stress measurement using synchrotron X-ray diffraction. (A) Schematic of the synchrotron experimental setup, showing the (X, Y, Z) and (XL, YL, ZL) coordinate systems used to define sample measurement and beamline locations, respectively; (B) photograph of the sample stage at the beamline, showing the sample mounted on the translation stage; (C) photograph of the as-built sample, indicating sample dimensions; (D) schematic diagram of the sample measurement, showing the sample coordinate directions and indicating the measurement and clamping regions. LD: Loading direction; TD: transverse direction; ND: normal direction.
Synchrotron X-ray diffraction experiments
HEXRD experiments were performed at the 3W1 beamline of the Beijing Synchrotron Radiation Facility (BSRF). The incident monochromatic X-ray energy was 60.12861 keV (λ = 0.02062 nm). The beam size was defined using slits as 380 × 380 µm2. A two-dimensional flat-panel detector (Mercu 4343, iRay Technology, Shanghai, China) with a resolution of 3,072 × 3,060 pixels was positioned 945.885 mm from the sample to record Debye-Scherrer diffraction rings. The transmission geometry was used to map the sample cross-section. The sample was mounted on a high-precision translation stage (TSA series, Beijing Zolix Instruments Co., Ltd., Beijing, China) [Figure 1B]. The loading direction (LD), transverse direction (TD), and normal direction (ND) were defined relative to the sample geometry. Diffraction patterns were collected point-by-point along the transverse direction (X-axis) and build direction (Z-axis). The exposure time was set to 5 s per frame to optimize the signal-to-noise ratio.
To achieve a high-resolution map of the macroscopic residual stress while managing the immense volume of raw scattering data, an equally spaced measurement grid of 35 rows × 24 columns was applied over the 48 mm × 70 mm region of interest, yielding 840 spatial points. This grid resolution provides sufficient spatial density to accurately capture the steep macroscopic stress gradients concentrated along the lateral edges of the sample while remaining within the strict beamline accessibility time constraints. At each point, four crystallographic planes [(111), (200), (220), and (311)] were analyzed along four azimuthal directions (LD-left, LD-right, TD-left, and TD-right) from the Debye-Scherrer ring. Consequently, over 13,000 individual diffraction peaks were separated and fitted to obtain residual stress information, and peaks with R2 < 0.96 were tagged as low-quality outliers and discarded. This extensive data-processing workload ensures the high spatial fidelity and statistical robustness of the reported stress distribution.
Diffraction signal extraction and peak fitting
Two-dimensional diffraction images were caked into segments at azimuthal angles corresponding to the LD (0°/180°) and TD (90°/270°), with an integration range of ±5°[29,36]. Reflections from planes such as (111), (200), (220), and (311) were identified for strain measurement.
Three different functions - Gaussian, Pseudo-Voigt, and Pearson VII - were used for peak-fitting and comparison. The Gaussian function is often used for its simplicity, but can be insufficient if tails are pronounced. The Pearson VII introduces an additional shape parameter that can further refine the representation of elongated tails, potentially capturing distortions that simpler functions might miss. The Pseudo-Voigt function is a linear combination of Gaussian and Lorentzian components, and is widely used for its computational efficiency and its ability to model peak tails.
The Gaussian function has the form:
where I0 is the peak height, θ0 is the peak center, and σ is a width parameter[37]. The Pseudo-Voigt is an amalgam of Gaussian and Lorentzian components:
where η is the Gaussian-Lorentzian mixing parameter, IG represents the Gaussian component, and IL represents the Lorentzian component[37]. The inclusion of a Lorentzian component improves the accuracy for broadened peaks. The Pseudo-Voigt function is a common choice for fitting diffraction peaks due to its flexibility and efficiency. The Pearson VII is defined by:
where K defines the profile width, and the shape parameter M refines the rate of the peak tails [37].
Strain and stress calculation
Once the peak centers were extracted, the interplanar spacing d was determined using Bragg’s law:
where superscript hkl denotes the specific crystal plane, λ is the X-ray wavelength, and θ is the Bragg angle[29]. Deviations from a stress-free reference spacing d0 allowed for the calculation of residual strain ε[29]:
The residual stress was then computed by applying generalized Hooke’s law. The specific X-ray elastic constants (XEC) for individual crystallographic planes used in the stress calculations are listed in Table 2 [38]. The three principal directions - LD, TD, and ND - were defined relative to the geometry of the plate indicated in Figure 1. The residual stresses in LD, TD, and ND are as follows:
E, v, and multiplicity m for the selected hkl crystal planes in LPBF IN718; 95% confidence intervals are shown in parentheses[38]
| 111 | 200 | 220 | 311 | |
| E (GPa) | 197.00 (3.94) | 160.00 (3.20) | 226.00 (4.52) | 200 (4.00) |
| v | 0.30 (0.02) | 0.30 (0.02) | 0.30 (0.02) | 0.32 (0.02) |
| m | 8 | 6 | 12 | 24 |
where the superscript hkl represents a specific crystal plane. Here,
Thus, the residual stress in the LD and TD can be calculated using[29]:
Uncertainty analysis followed standard propagation of errors from the fitted peak centers. The covariance matrix from the least-squares fitting procedure provided the variance in θ0, denoted δθ0. This variance influences the final strain uncertainty uϵ, and consequently the stress uncertainty uσ.
The residual strain measurement uncertainty can be given as:
where δθ0 and δθ are the fitting uncertainties associated with θ0 and θ, respectively[29]. Thus, according to Equation (12), the residual strain uncertainty for LD, TD, and ND can be calculated as
The three peak-fitting models were used to investigate differences among reconstruction methods in the resultant residual strain and stress field.
Stress-free d0 determination methods
This study used two methods to obtain the stress-free d0. The first method calculates the average diffraction plane spacing across the entire plate region:
where di is the plane spacing at ith measured position and N is the number of measured points. The d0 error is derived from the individual di errors via error propagation.
Given that the total stress across the entire sample is nearly zero in both the LD and TD directions, in the second method, d0 is calculated by optimizing its value to minimize the integrated residual stress in both the LD and TD directions, as follows:
where f(d0) is the optimization objective function, and the objective is to minimize the integrated residual stress in both LD and TD. The d0 that minimizes the overall net residual stress is believed to correspond to the stress-free spacing criterion. This d0 is optimized by a selective stochastic iteration algorithm[39]. The algorithm first starts from the initial point d0, and this point is then stochastically shifted to another value:
where k+1 denotes the next iteration point. The Δd0 is the step length, and Δd0 ~ N(μd; σd). The trial value
Weighting measured lattice strains
Lattice strain measurements obtained through X-ray diffraction generally contain contributions from macro, intergranular, and intragranular stresses (i.e., type I as well as type II/III stresses). However, the macro stress, as the main focus of this work, was calculated by weighting the multiple reflections with proper factors[40]:
where αhkl is the weighting factor for the corresponding crystal plane hkl, calculated as follows[40]:
where Thkl is the texture index, taken as 1 because the entire diffraction rings were observed[22], m is the multiplicity of the reflection plane, Ehkl is the diffraction elastic modulus (DEM), and E is the macroscopic Young’s modulus of IN718[40]. The E value is 189.5 GPa, as determined from a macroscopic tensile experiment.
Microstructural characterization
To elucidate the local microstructural features and provide physical evidence of crystallographic anisotropy, scanning electron microscopy (SEM), energy-dispersive spectroscopy (EDS), and electron backscatter diffraction (EBSD) analyses were conducted on the YZ cross-section of the as-built LPBF IN718 sample, parallel to the build direction. For SEM observation, the sample surface was ground and polished using standard metallographic procedures, and then etched with Kalling’s reagent. The surface morphology was characterized using a scanning electron microscope (AMBER GMH, TESCAN Co., Ltd., Brno, Czech Republic) equipped with a C-Swift EBSD detector (Oxford Instruments, High Wycombe, UK). The elemental distribution was analyzed using an Aztec EDS system (Oxford Instruments, High Wycombe, UK). Both SEM and EDS analyses were performed at an acceleration voltage of 15 kV and an emission current of 3 nA. For EBSD characterization, the mechanically polished samples were further electropolished in a methanol-sulfuric acid solution to remove residual surface deformation. EBSD mapping was performed using the same TESCAN SEM platform at an accelerating voltage of 15 kV and an emission current of 3 nA. During the EBSD data acquisition, the sample was tilted at 70°, and the working distance was maintained between 13 and 15 mm.
RESULTS AND DISCUSSION
Microstructural characterization results
The microstructural morphology and crystallographic orientation of the YZ cross-section were systematically characterized. Figure 2A shows the typical SEM microstructural features of the as-built IN718. Due to the extremely rapid cooling conditions inherent in the LPBF process, substantial thermal undercooling is induced. Together with constitutional supercooling caused by solute redistribution during solidification, this thermal undercooling collectively breaks the stable equilibrium of the solid-liquid interface. Driven by directional heat flow, dynamic melt-pool behavior, and layer-by-layer thermal cycling, crystals preferentially grow epitaxially in the direction opposite to the heat flux, ultimately forming a highly directional dendritic structure. As evidenced by the localized EDS elemental mapping in Figure 2B, pronounced dendritic segregation occurs, with Nb enrichment in the interdendritic regions.
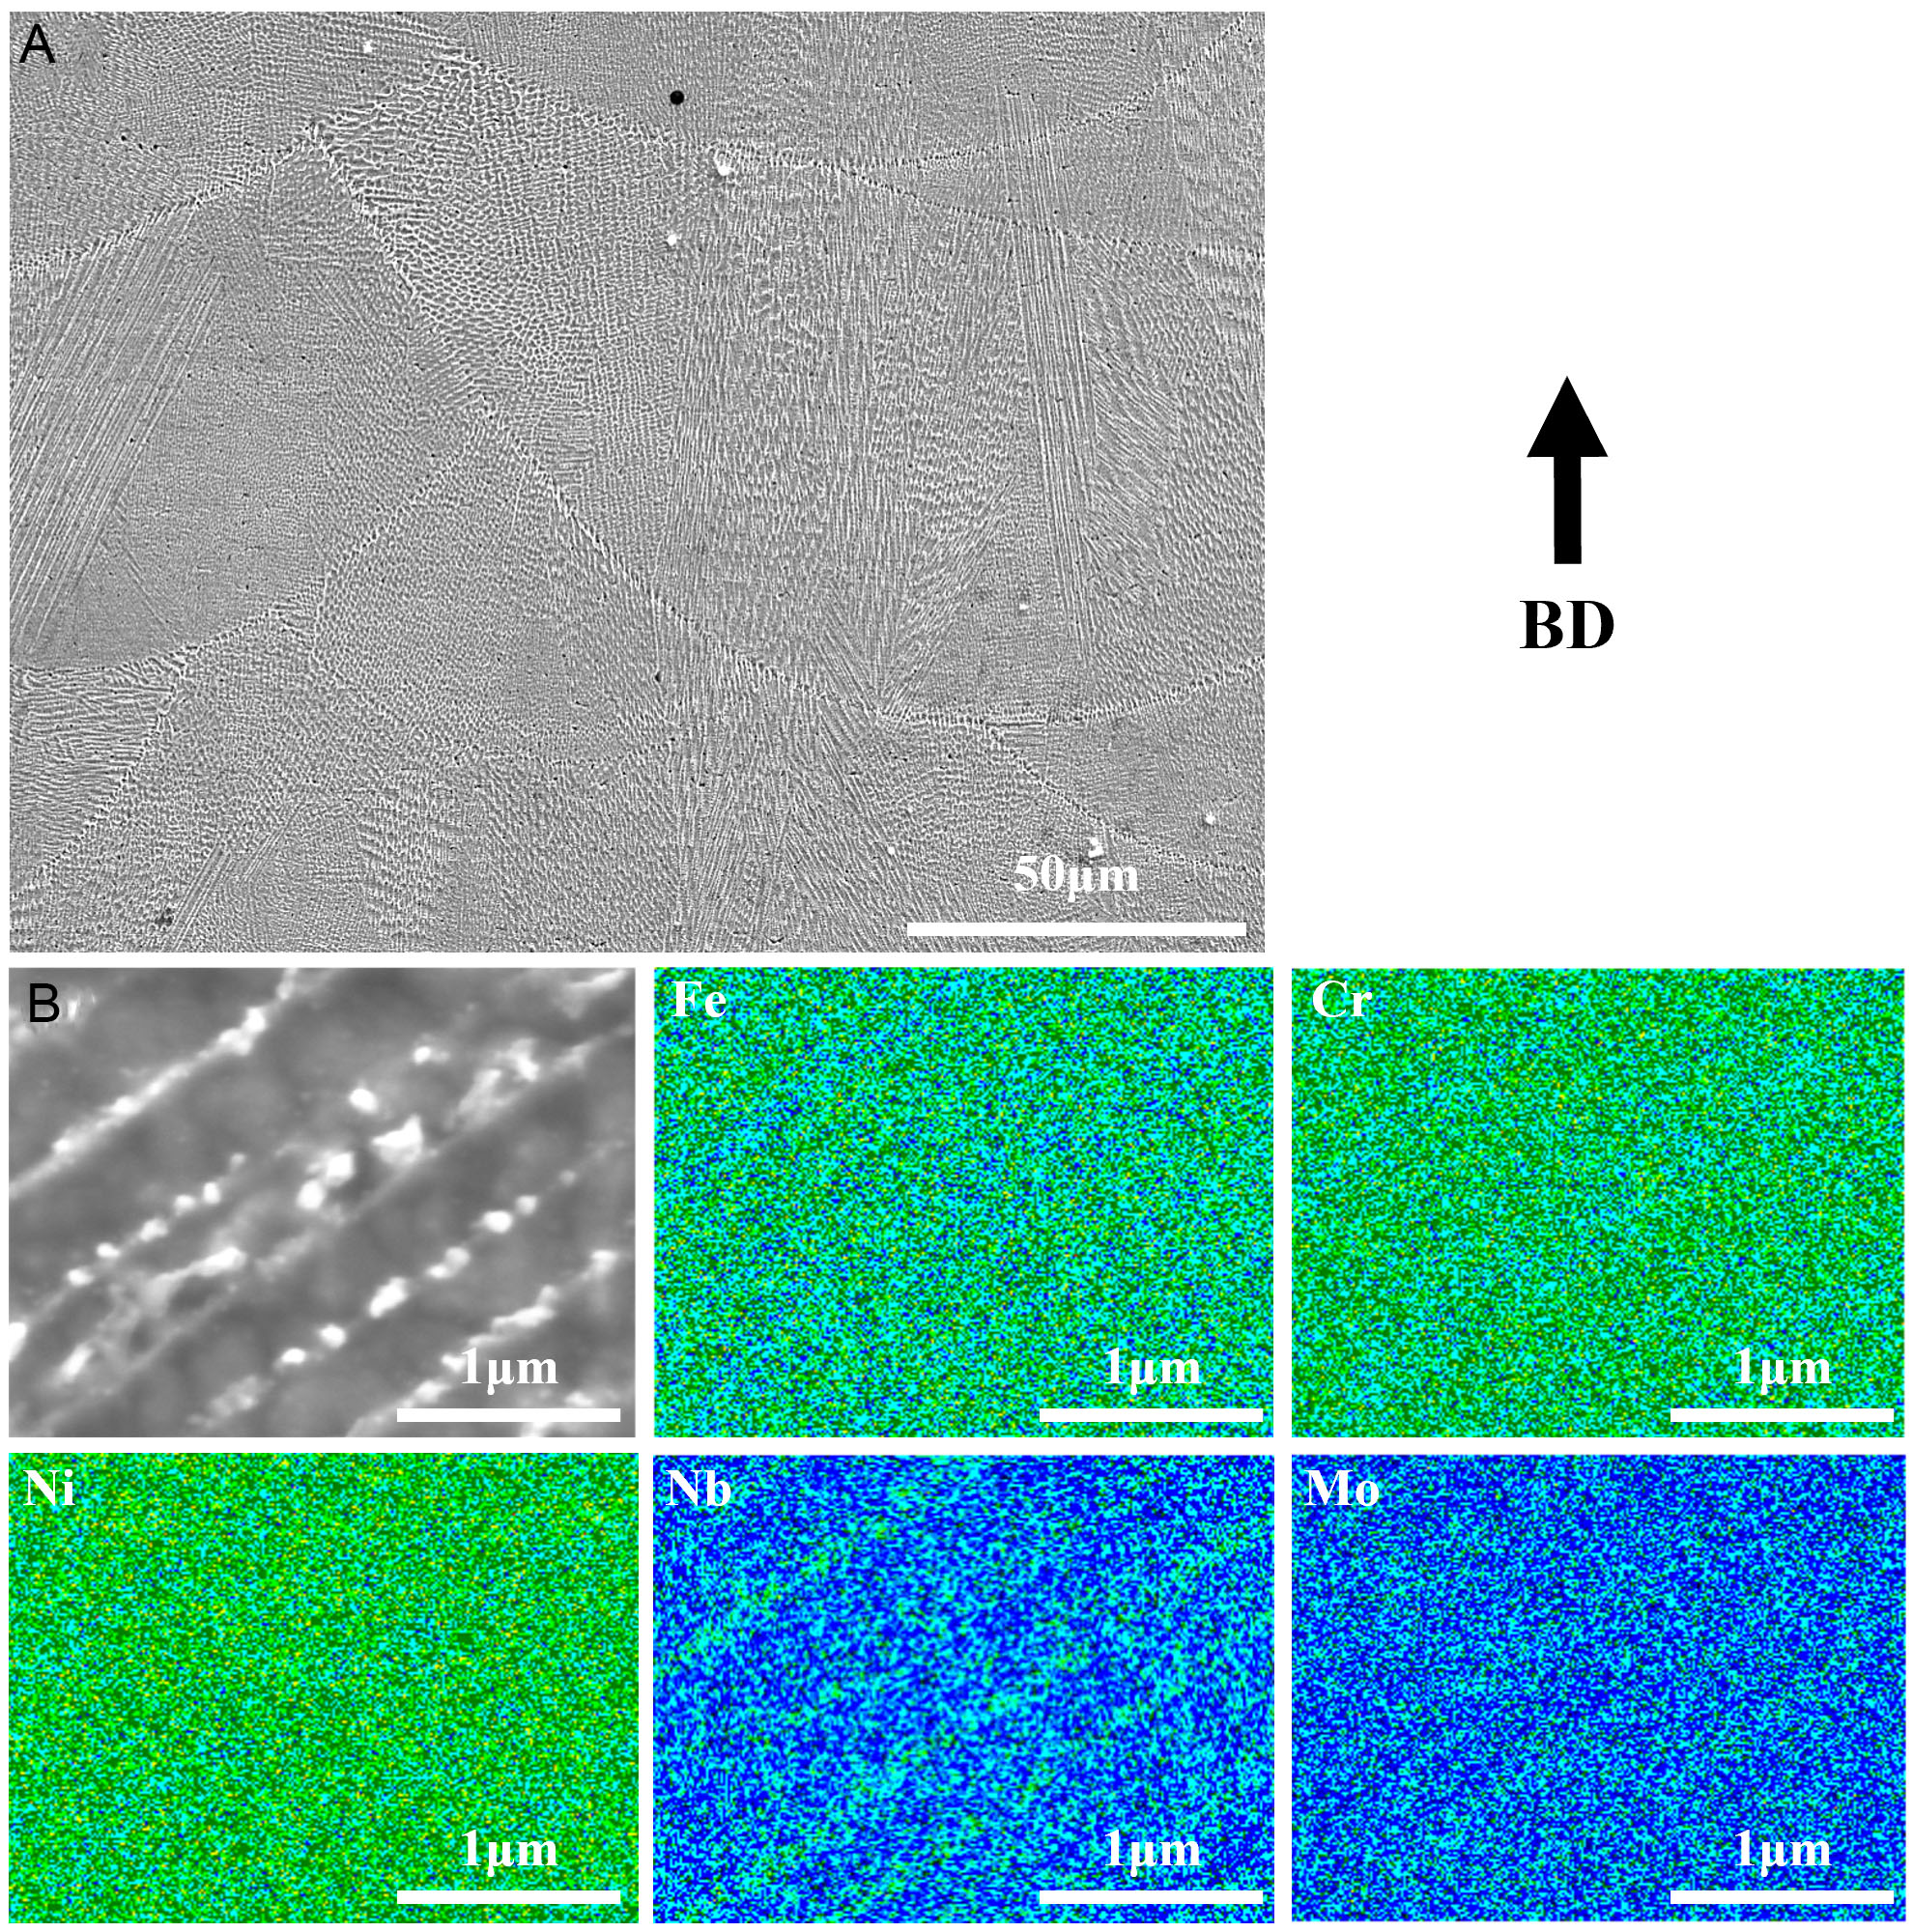
Figure 2. SEM microstructures: (A) the melt pool microstructure of the LPBF IN718, and (B) the EDS elemental maps along the dendrite faces in a local region. BD: Build direction; SEM: scanning electron microscopy; LPBF: Laser Powder Bed Fusion; IN718: Inconel 718; EDS: energy-dispersive spectroscopy.
To further evaluate the crystallographic texture and grain boundary characteristics, EBSD analysis was performed over a 1,000 × 812 μm2 area with a step size of 0.8 μm. Figure 3 presents the inverse pole figure (IPF) orientation and grain-boundary (GB) maps for the YZ cross-section. As shown in Figure 3A, the grain morphology of the as-built plate is predominantly characterized by the epitaxial growth of elongated columnar grains aligned parallel to the build direction (Z-axis). The GBs map [Figure 3B] quantitatively reveals that high-angle grain boundaries (HAGBs, > 15°) account for 79.7%, while low-angle grain boundaries (LAGBs, 5-15°) account for 20.3%. The abundant LAGBs represent typical sub-grain structures and dislocation tangles induced by the repeated thermal cycling and intense thermal gradients inherent to the LPBF process, while the HAGBs outline the distinct boundaries of the columnar grains[2]. Together, columnar grain structures and the complex boundary network provide microstructural evidence of crystallographic anisotropy and may contribute to the asymmetric diffraction peak profiles discussed below.
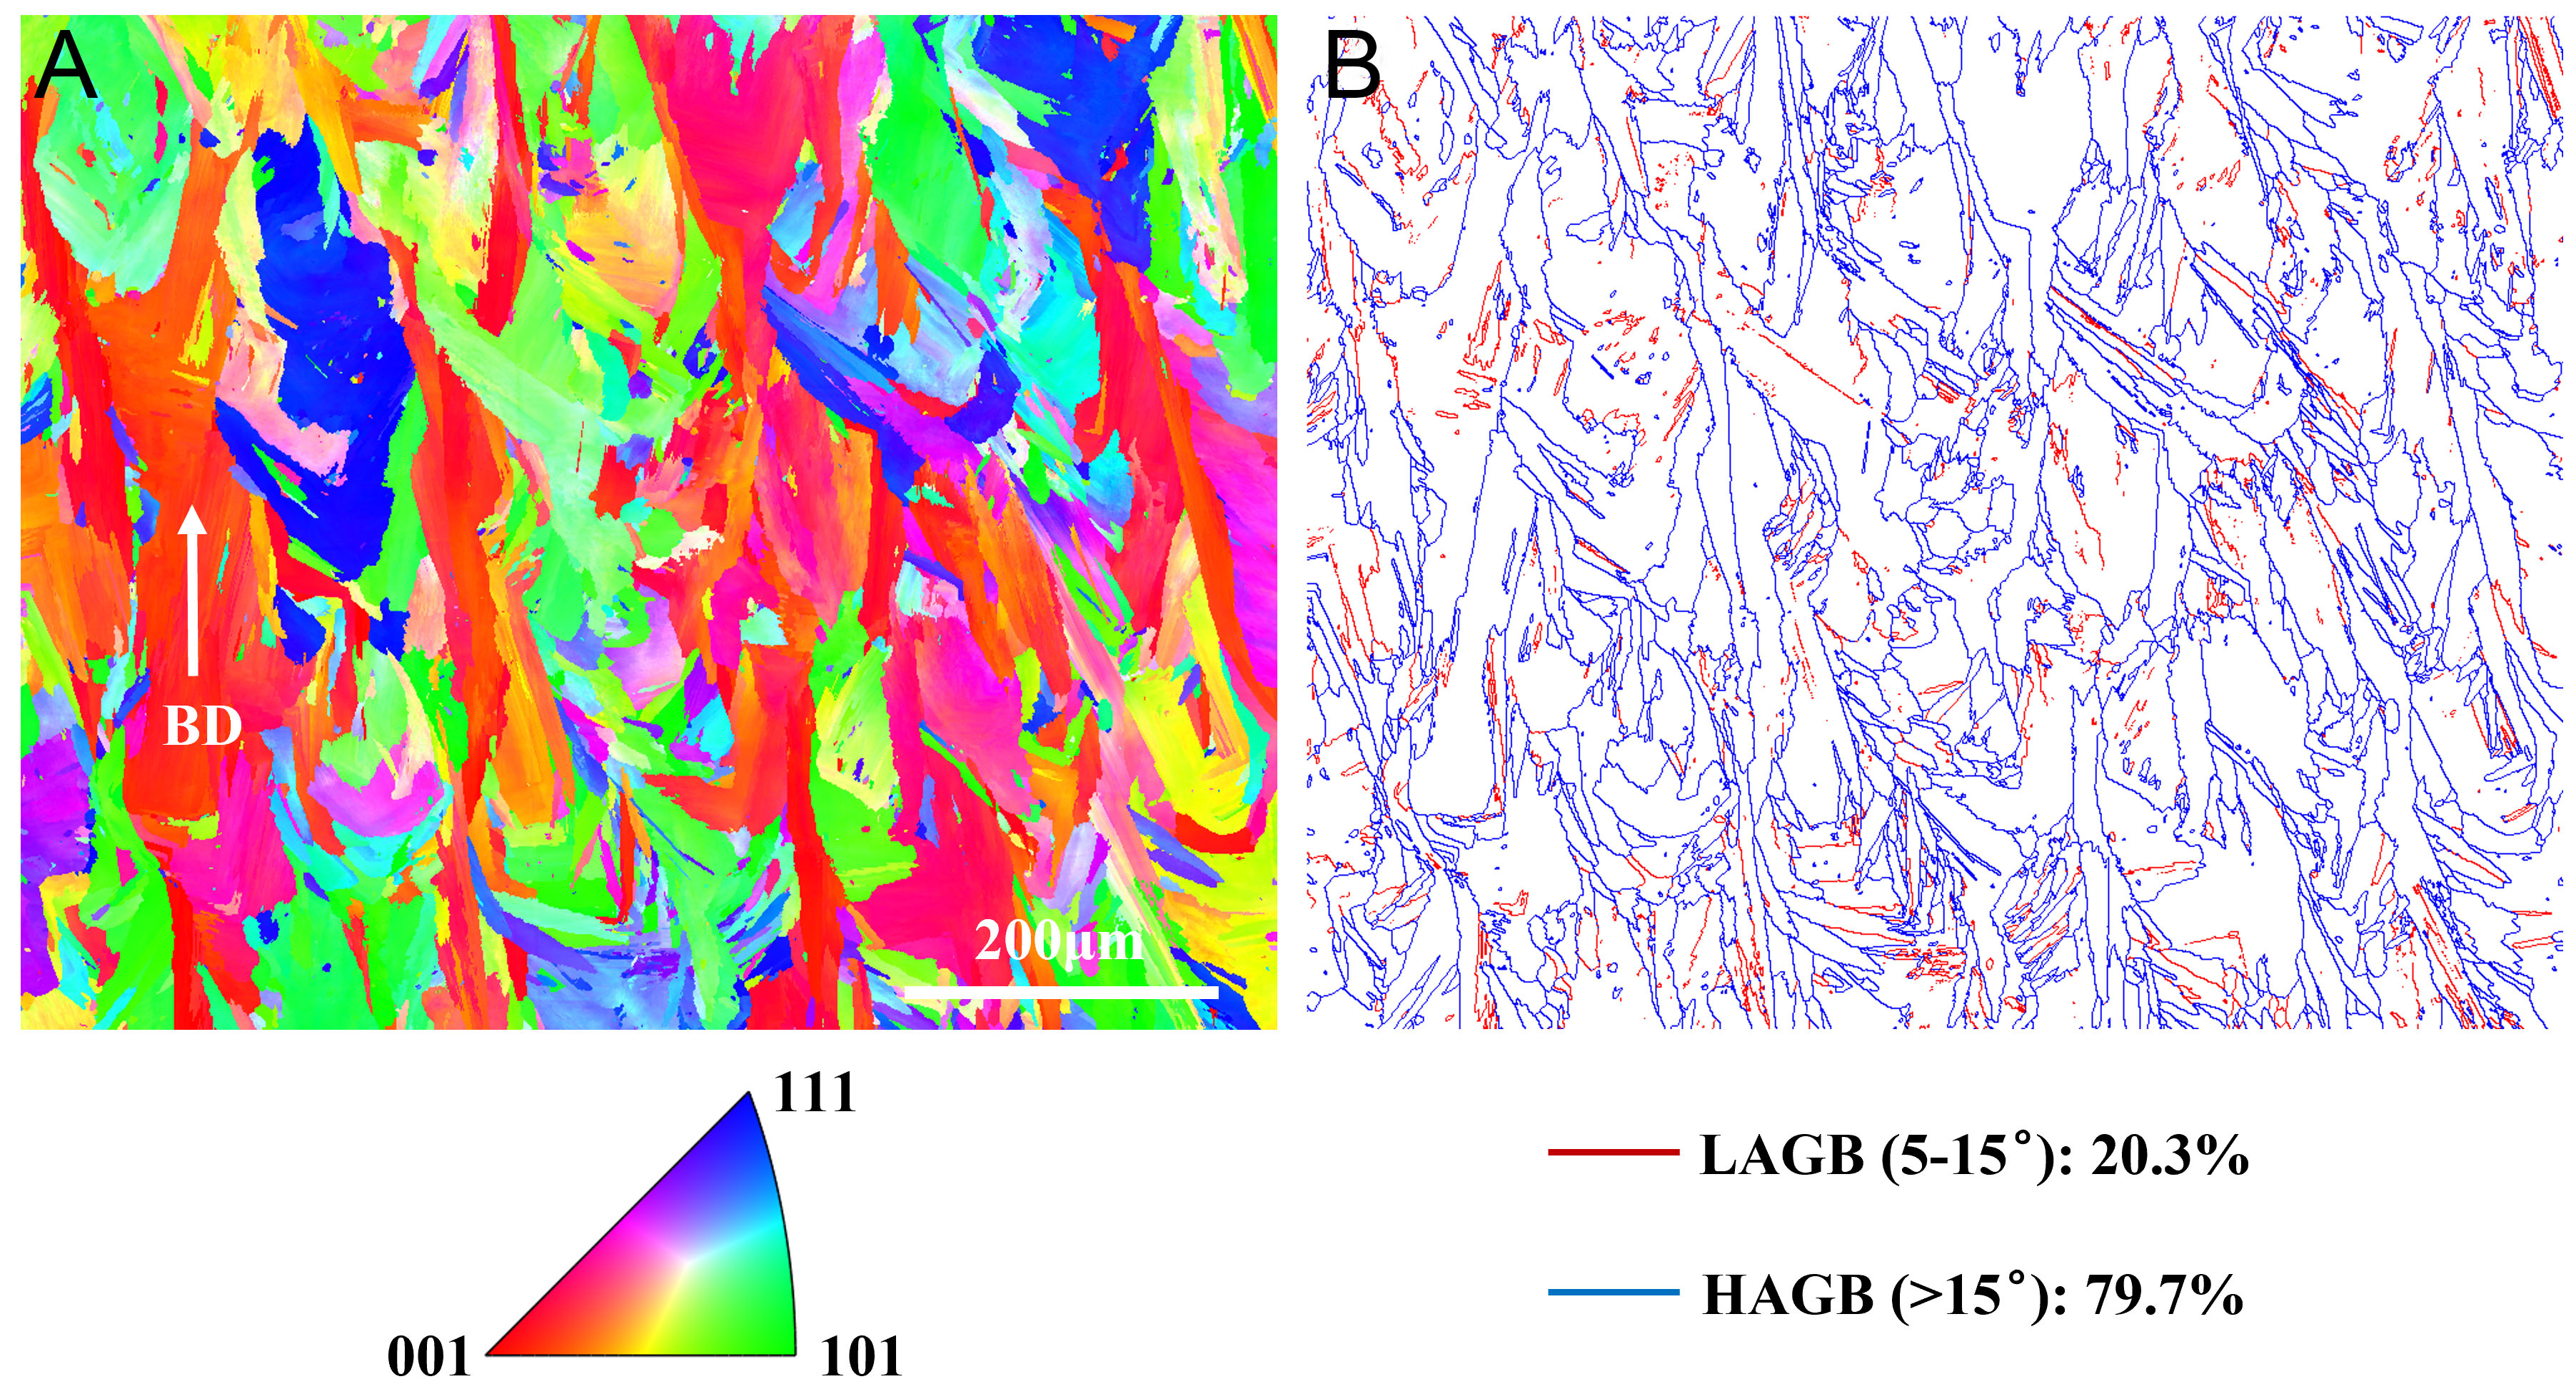
Figure 3. EBSD microstructures: (A) inverse pole figure orientation map and (B) grain boundaries map for the LPBF IN718 alloy. BD: Build direction; LAGB: low-angle grain boundary; HAGB: high-angle grain boundary; EBSD: electron backscatter diffraction; LPBF: Laser Powder Bed Fusion; IN718: Inconel 718.
Diffraction characteristics and 2θ distribution
The reliability of residual stress mapping relies heavily on the quality of peak profile analysis. Figure 4 provides a comprehensive evaluation of the signal and fitting performance. Figure 4A shows that the Debye-Scherrer rings are continuous, indicating good grain statistics. Figure 4B shows the corresponding integrated diffraction profile. Interestingly, the diffraction peaks exhibit slight asymmetry. The asymmetry observed in the diffraction peaks is a direct consequence of the complex thermomechanical history during AM, which leads to variations in elemental distribution, phase formation, dendritic and columnar segregation[9], and internal stresses within the material, as discussed in[9,15]. Figure 4C explicitly compares the fitting results for a (111) peak. The experimental data (black dots) exhibit a distinct asymmetry and heavy tail. The Gaussian fit (green) fails to capture this tail. In contrast, both the Pseudo-Voigt (blue) and Pearson VII (red) functions provide better agreement with the experimental data. Figure 4D further confirms this trend visually through a heatmap, where the red blocks indicate that the Pseudo-Voigt function consistently achieves higher goodness-of-fit (R2) than Gaussian and Pearson VII across the dataset.
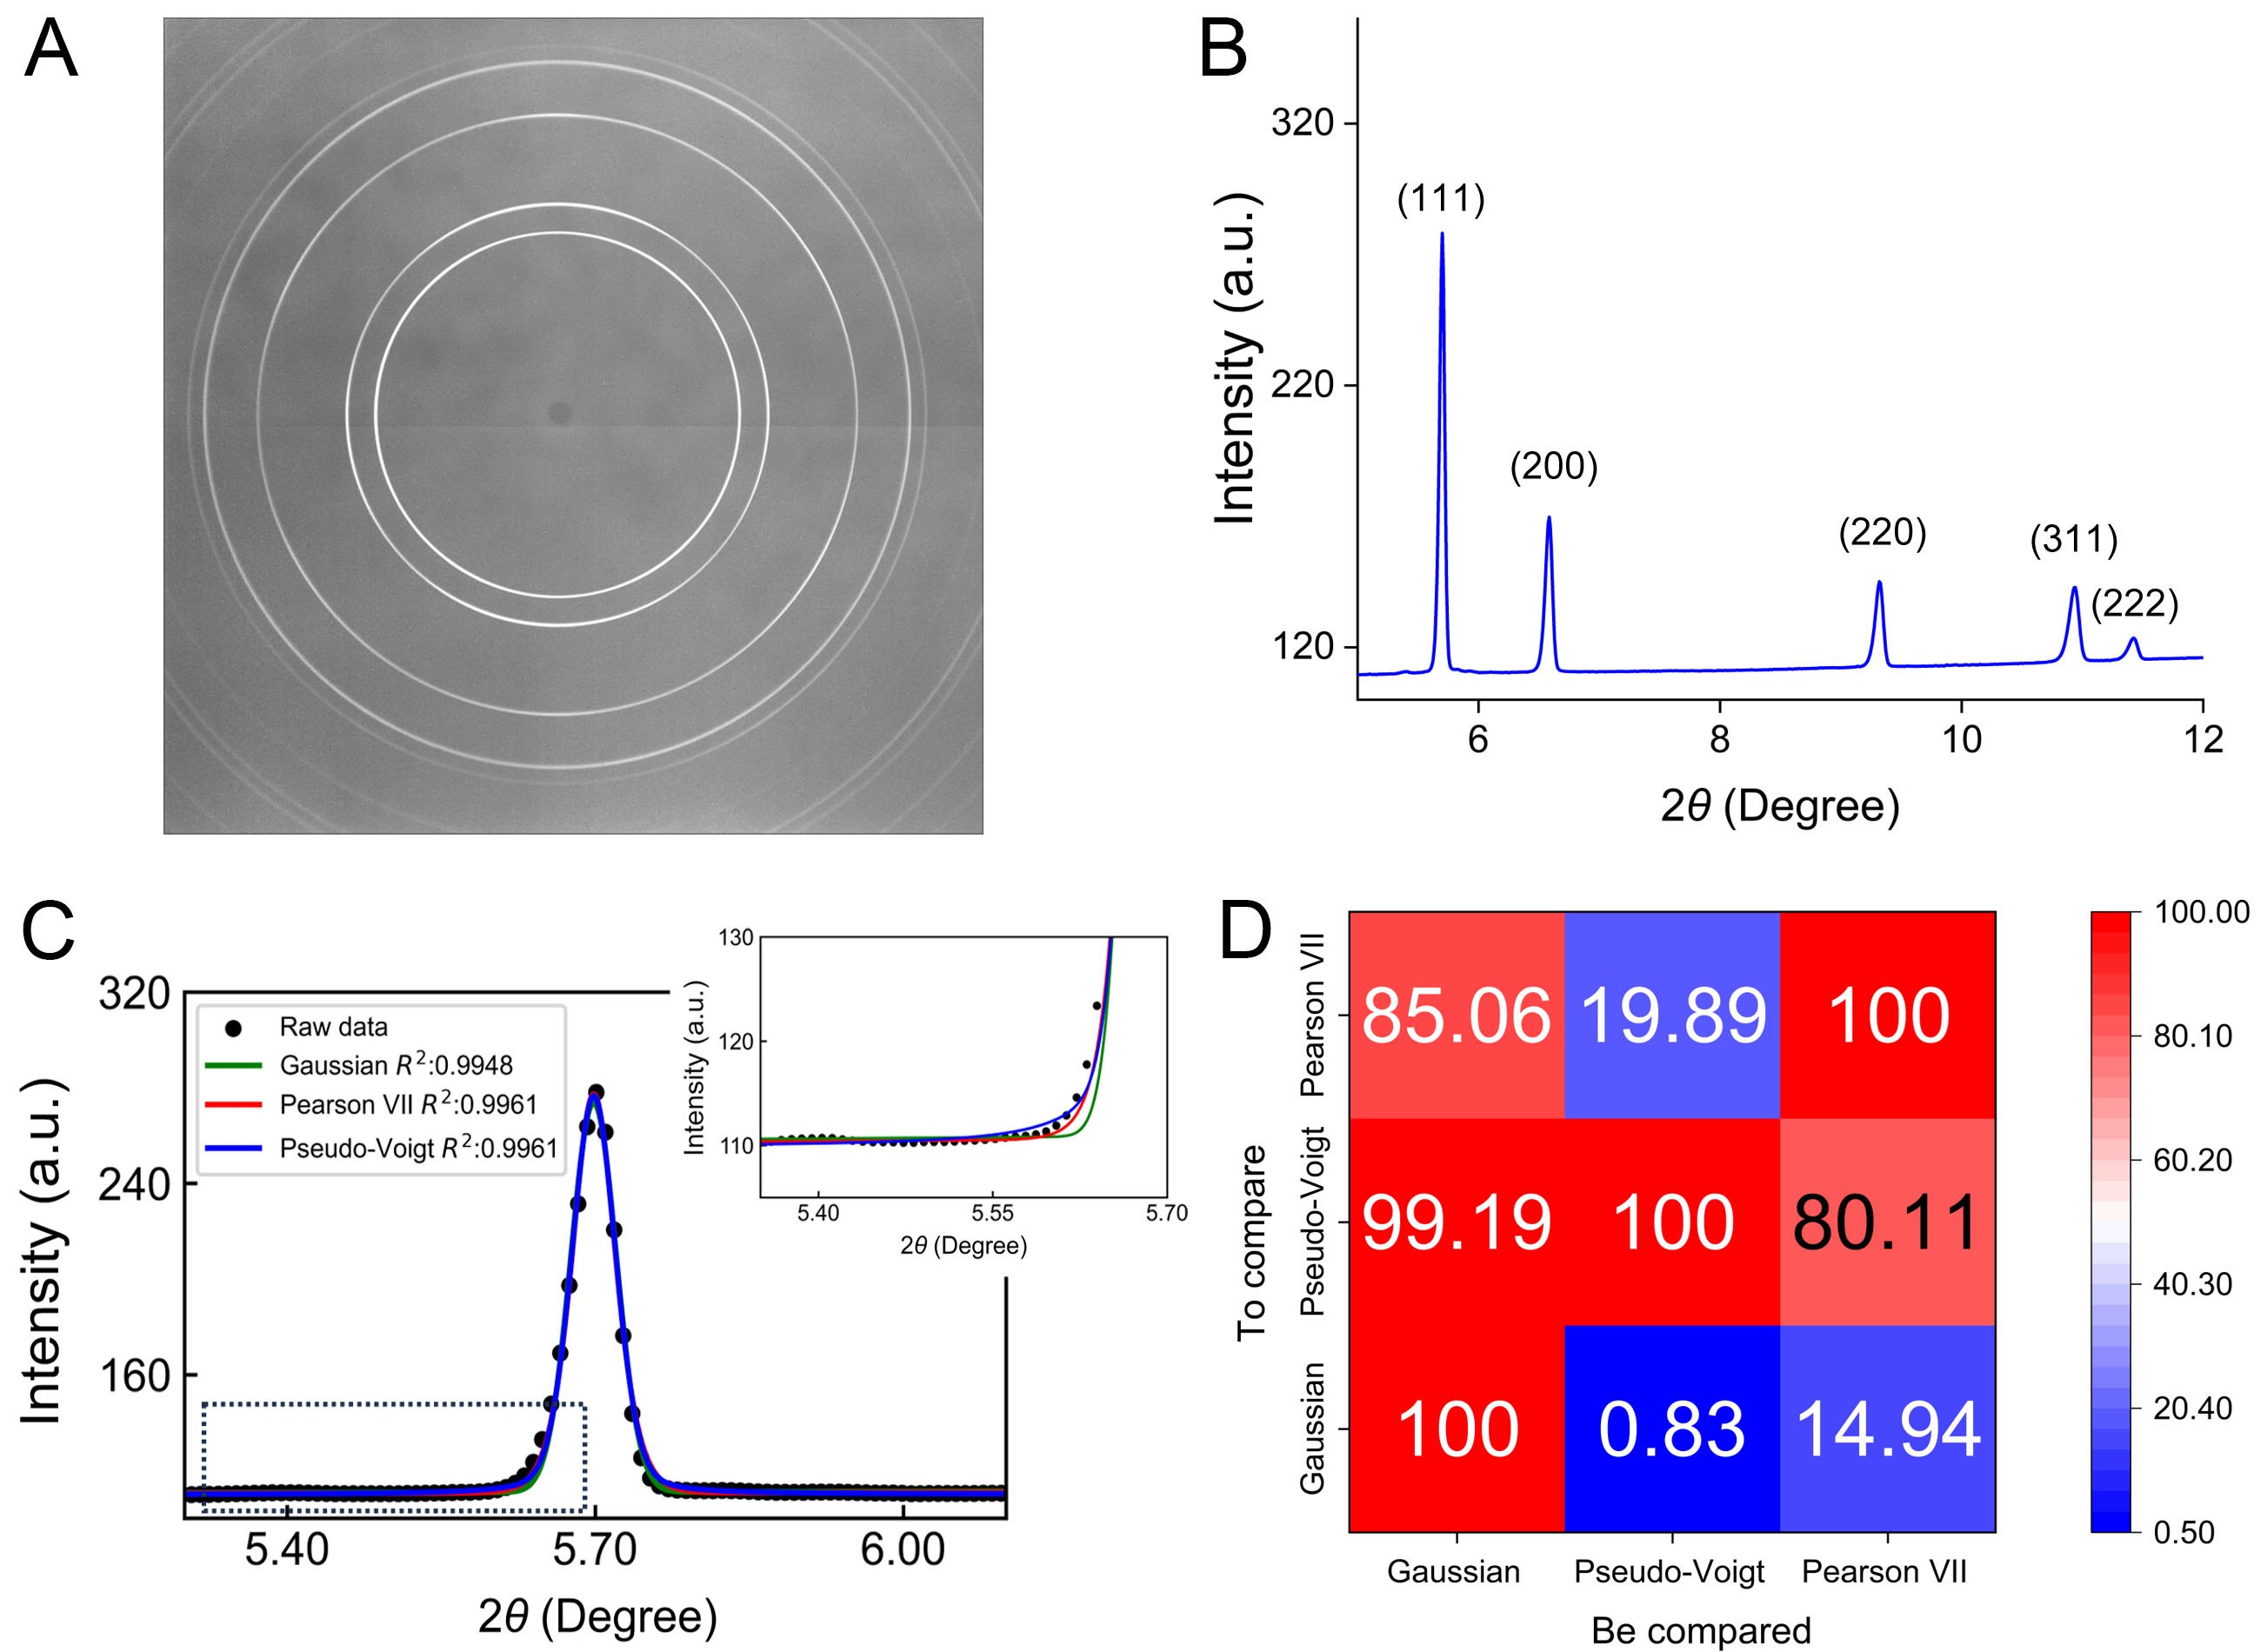
Figure 4. Raw X-ray diffraction data and peak fits obtained using Pearson VII, Gaussian, and Pseudo-Voigt profiles. (A) Composite diffraction images over the entire sample, (B) integrated diffraction profile over an azimuthal range of ±5°, (C) fitting results for (111) reflection with three types of peak functions, and zoomed-in detail of peak bottom fitting; (D) R2 performance comparison heatmaps showing percentage of cases where the “To compare” function outperforms the “Be compared” function.
The spatial distribution of the raw diffraction angle 2θ provides fundamental insight into the state of the material lattice. Figure 5 maps the variation in the diffraction angle 2θ across the sample dimensions. Since
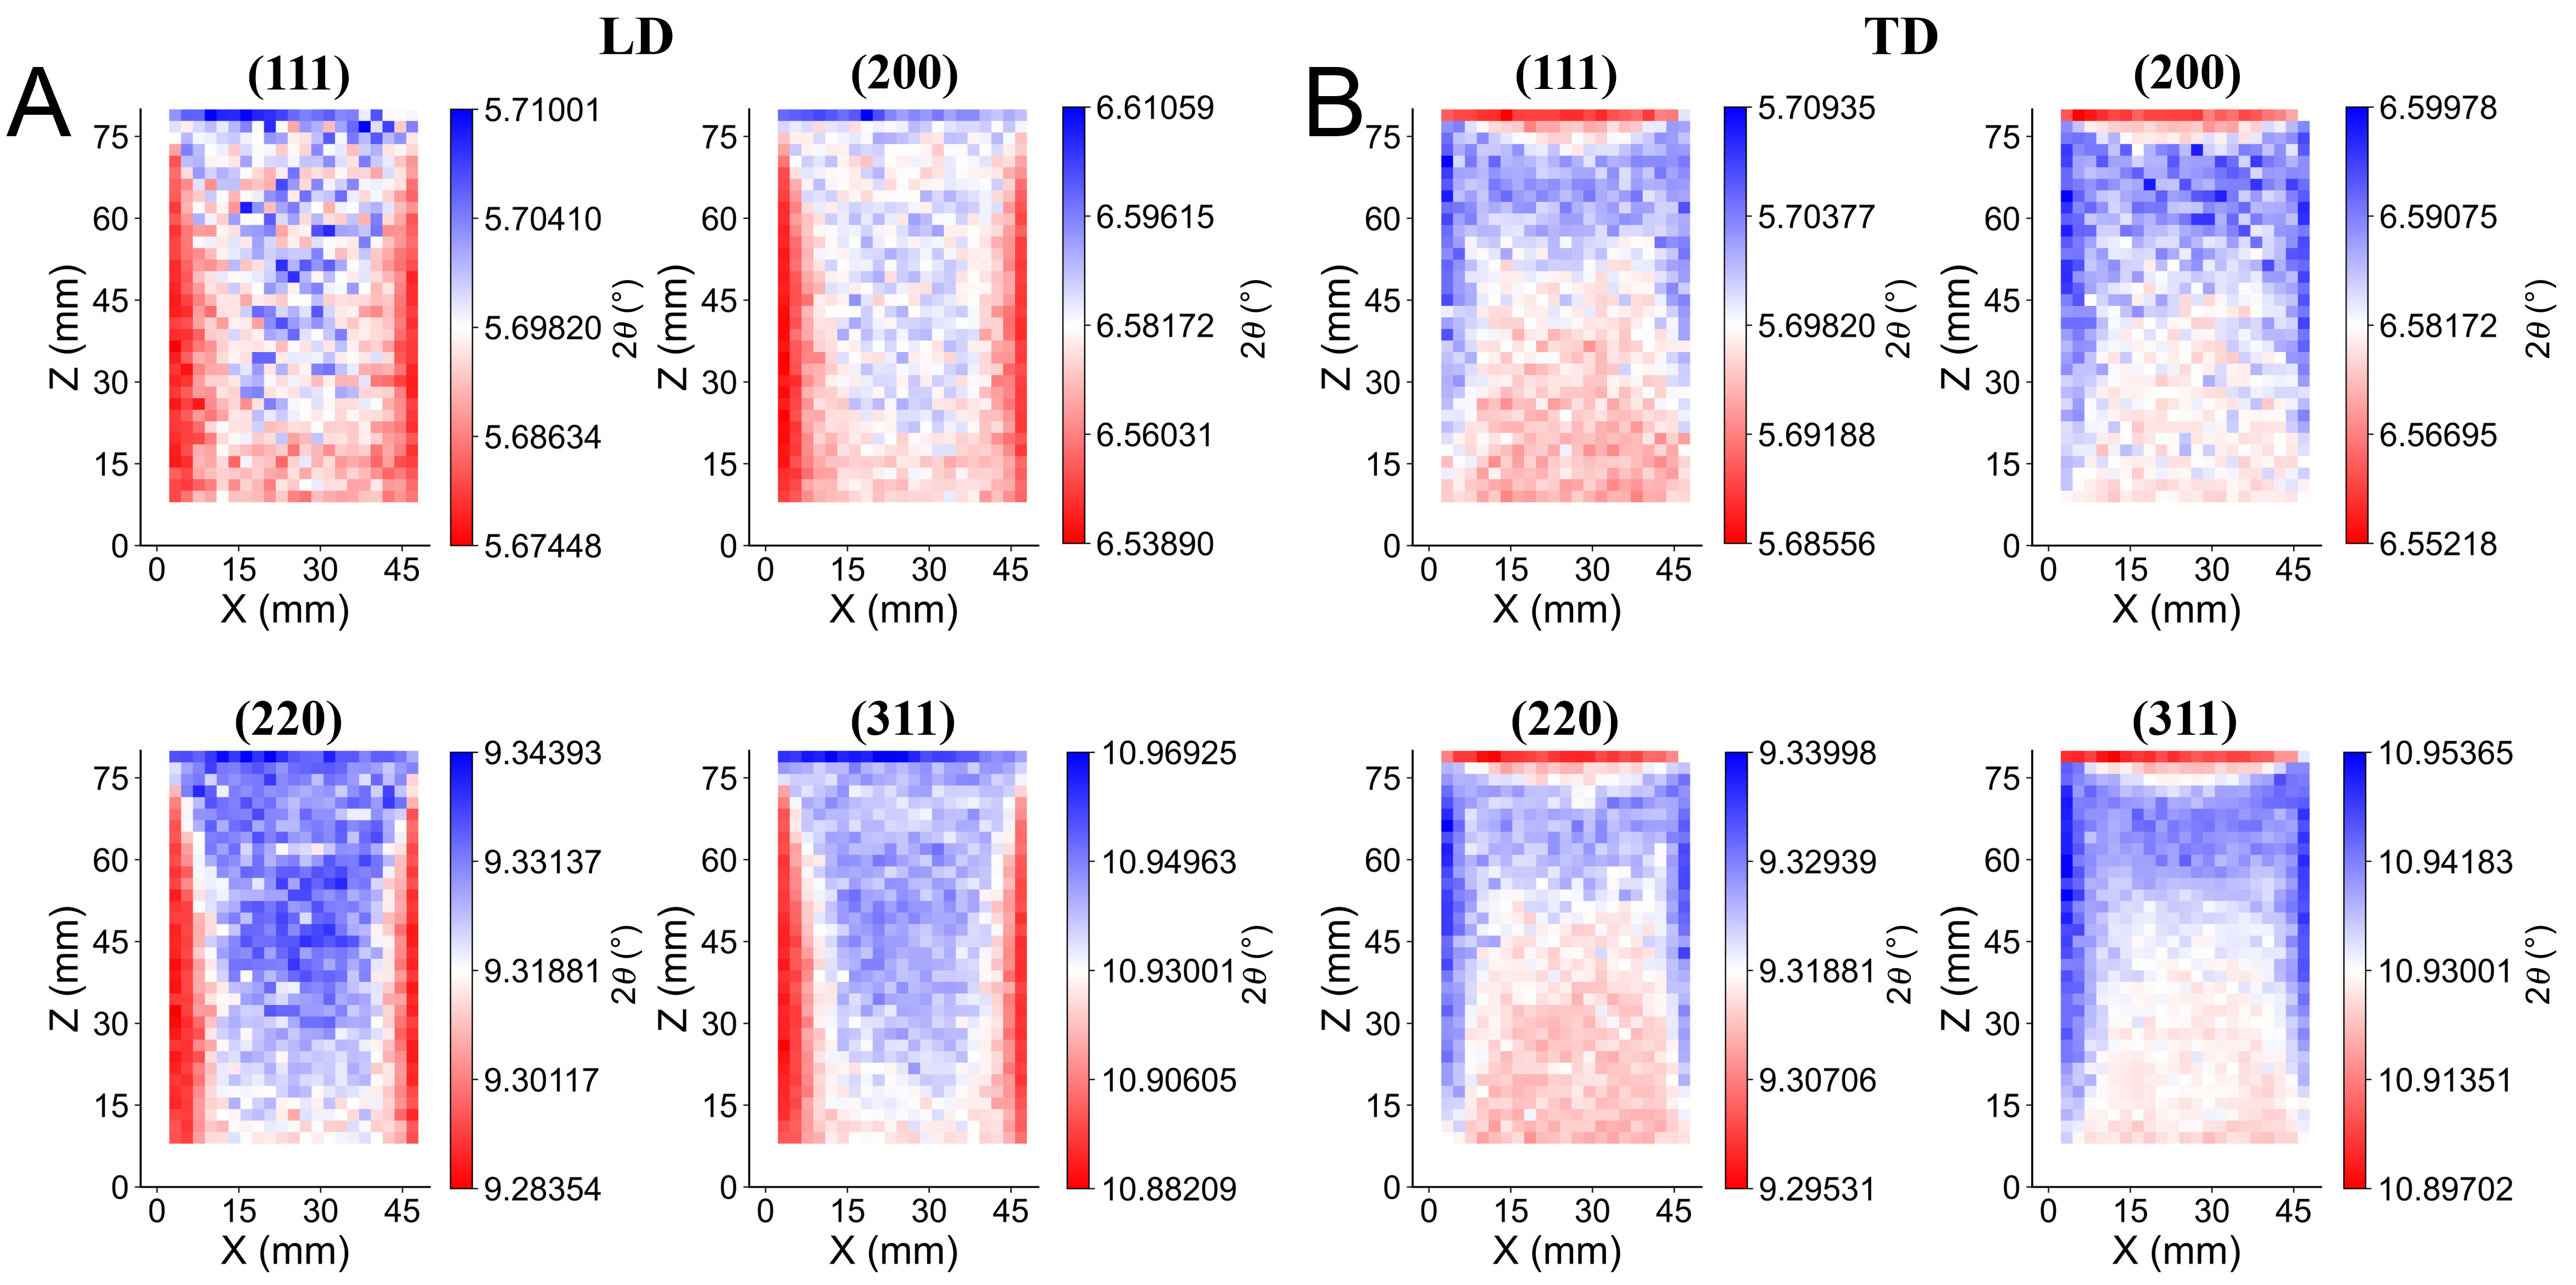
Figure 5. Spatial distribution of diffraction angles 2θ (°) for the (111), (200), (220), and (311) crystallographic planes. The maps illustrate the raw angular shifts across the plate cross-section in the (A) LD and (B) TD directions, which directly correspond to variations in interplanar spacing d prior to strain calculation. LD: Loading direction; TD: transverse direction.
Robustness validation of analysis algorithms
To quantify the impact of fitting function, we examine the specific error values. Table 3 presents the average and maximum residual strain errors. The three fitting functions show similar values for both the average and maximum errors. The maximum residual strain error is below 82.6 με. The residual stress error values in Table 4 are similar. The maximum residual stress error is below 15.3 MPa. These results indicate that statistical uncertainty in determining the peak center is very low.
Average and maximum residual strain uncertainties for different fitting functions and reflection planes
| (111) | (200) | (220) | (311) | |||||||||||||||||||||
| LD | TD | ND | LD | TD | ND | LD | TD | ND | LD | TD | ND | |||||||||||||
| Avg. | Max. | Avg. | Max. | Avg. | Max. | Avg. | Max. | Avg. | Max. | Avg. | Max. | Avg. | Max. | Avg. | Max. | Avg. | Max. | Avg. | Max. | Avg. | Max. | Avg. | Max. | |
| Gaussian | 29.2 | 44.0 | 33.8 | 51.8 | 13.7 | 18.9 | 27.3 | 54.3 | 36.0 | 53.1 | 22.9 | 31.6 | 32.3 | 46.1 | 45.0 | 82.6 | 20.9 | 34.1 | 42.5 | 58.4 | 45.3 | 55.3 | 33.9 | 42.3 |
| Pseudo-Voigt | 28.2 | 43.7 | 31.1 | 49.9 | 12.9 | 18.3 | 26.0 | 54.2 | 32.6 | 50.9 | 21.2 | 30.7 | 31.5 | 44.6 | 43.4 | 81.8 | 20.3 | 33.8 | 41.4 | 58.6 | 40.8 | 50.3 | 31.8 | 41.0 |
| Pearson VII | 28.4 | 43.8 | 31.2 | 50.1 | 12.9 | 18.5 | 26.2 | 54.3 | 32.5 | 50.4 | 21.2 | 30.7 | 31.7 | 44.8 | 43.6 | 81.9 | 20.4 | 33.8 | 41.7 | 58.7 | 41.3 | 51.0 | 32.1 | 41.2 |
Average and maximum residual stress uncertainties for different fitting functions and reflection planes
| (111) | (200) | (220) | (311) | |||||||||||||
| LD | TD | LD | TD | LD | TD | LD | TD | |||||||||
| Avg. | Max. | Avg. | Max. | Avg. | Max. | Avg. | Max. | Avg. | Max. | Avg. | Max. | Avg. | Max. | Avg. | Max. | |
| Gaussian | 6.4 | 9.7 | 7.5 | 11.4 | 3.7 | 7.4 | 4.9 | 7.2 | 6.0 | 8.5 | 8.3 | 15.3 | 7.1 | 9.8 | 7.6 | 9.3 |
| Pseudo-Voigt | 6.2 | 9.6 | 6.9 | 11.0 | 3.5 | 7.4 | 4.4 | 6.9 | 5.8 | 8.2 | 8.0 | 15.1 | 6.9 | 9.8 | 6.8 | 8.4 |
| Pearson VII | 6.3 | 9.7 | 6.9 | 11.0 | 3.6 | 7.4 | 4.4 | 6.9 | 5.9 | 8.3 | 8.0 | 15.1 | 7.0 | 9.9 | 6.9 | 8.6 |
Tables 5 and 6 summarize the average and maximum absolute differences of residual strain and stress, respectively. Compared with the measurement errors in residual strain and stress, these differences among fitting functions are typically smaller. Given that the total stress range is on the order of hundreds of MPa, the differences among the fitting functions are considered negligible. Difference maps obtained using the various fitting functions are also shown in Figures 6-9. A random “salt-and-pepper” noise pattern is observed, confirming that the choice of fitting function does not introduce artificial stress concentrations.
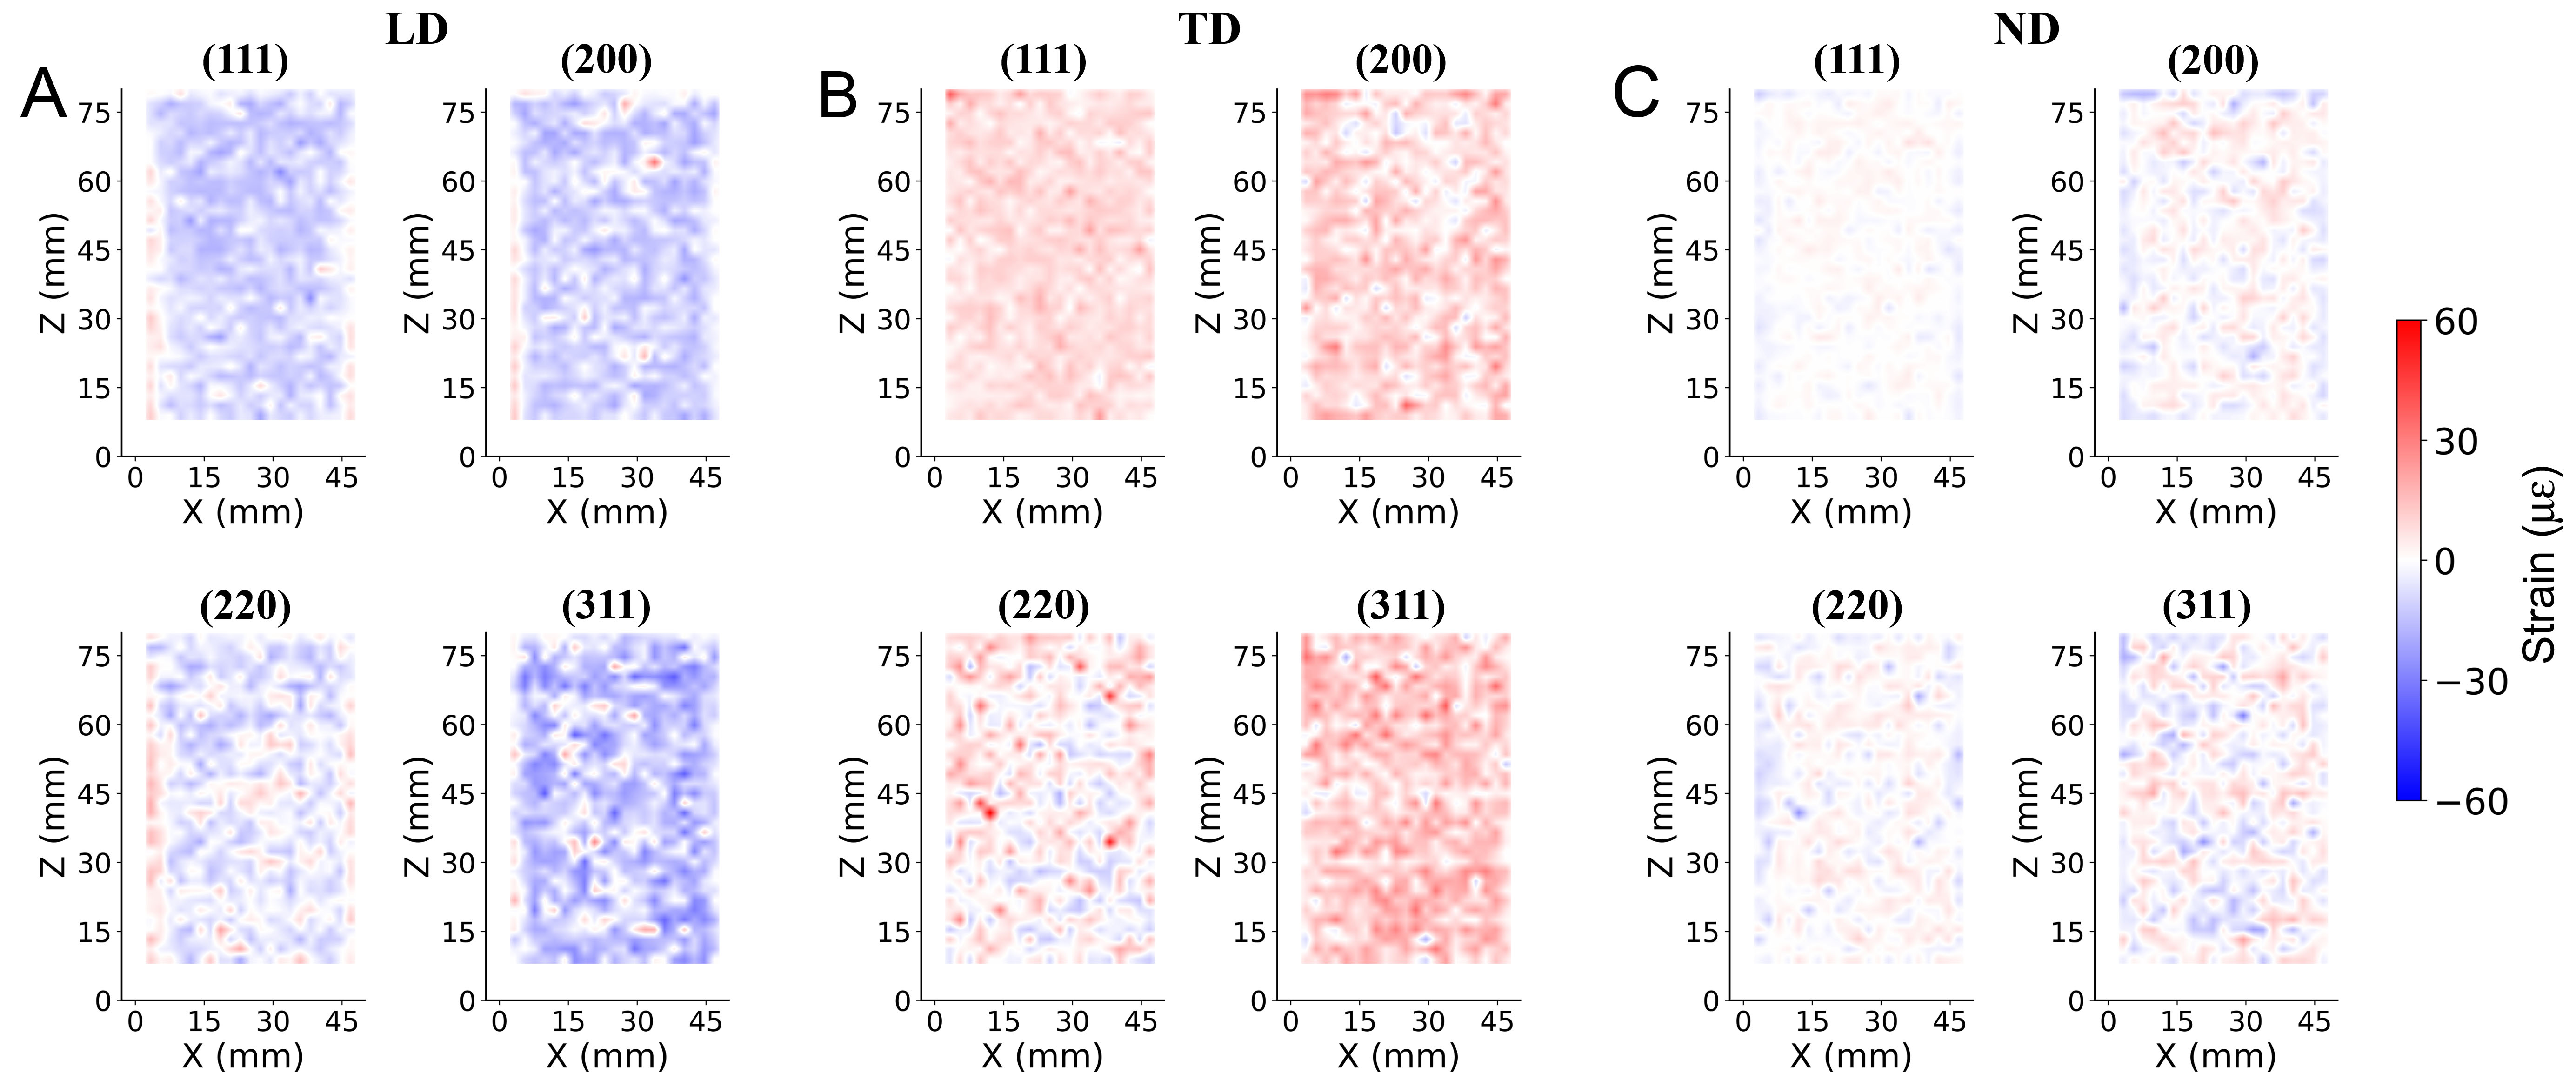
Figure 6. Maps showing the difference in measured residual strain between fits using a Pseudo-Voigt and a Gaussian profile for X-ray diffraction data from the additively manufactured IN718 sample. Results are shown for the (A) LD, (B) TD, and (C) ND, respectively. The color scale indicates the strain difference (με), with positive values indicating that the Pseudo-Voigt fit resulted in a larger strain magnitude and negative values indicating a smaller strain magnitude than the Gaussian fit. Each map corresponds to a different crystallographic plane (hkl), as indicated above each panel. LD: Loading direction; TD: transverse direction; ND: normal direction; IN718: Inconel 718.
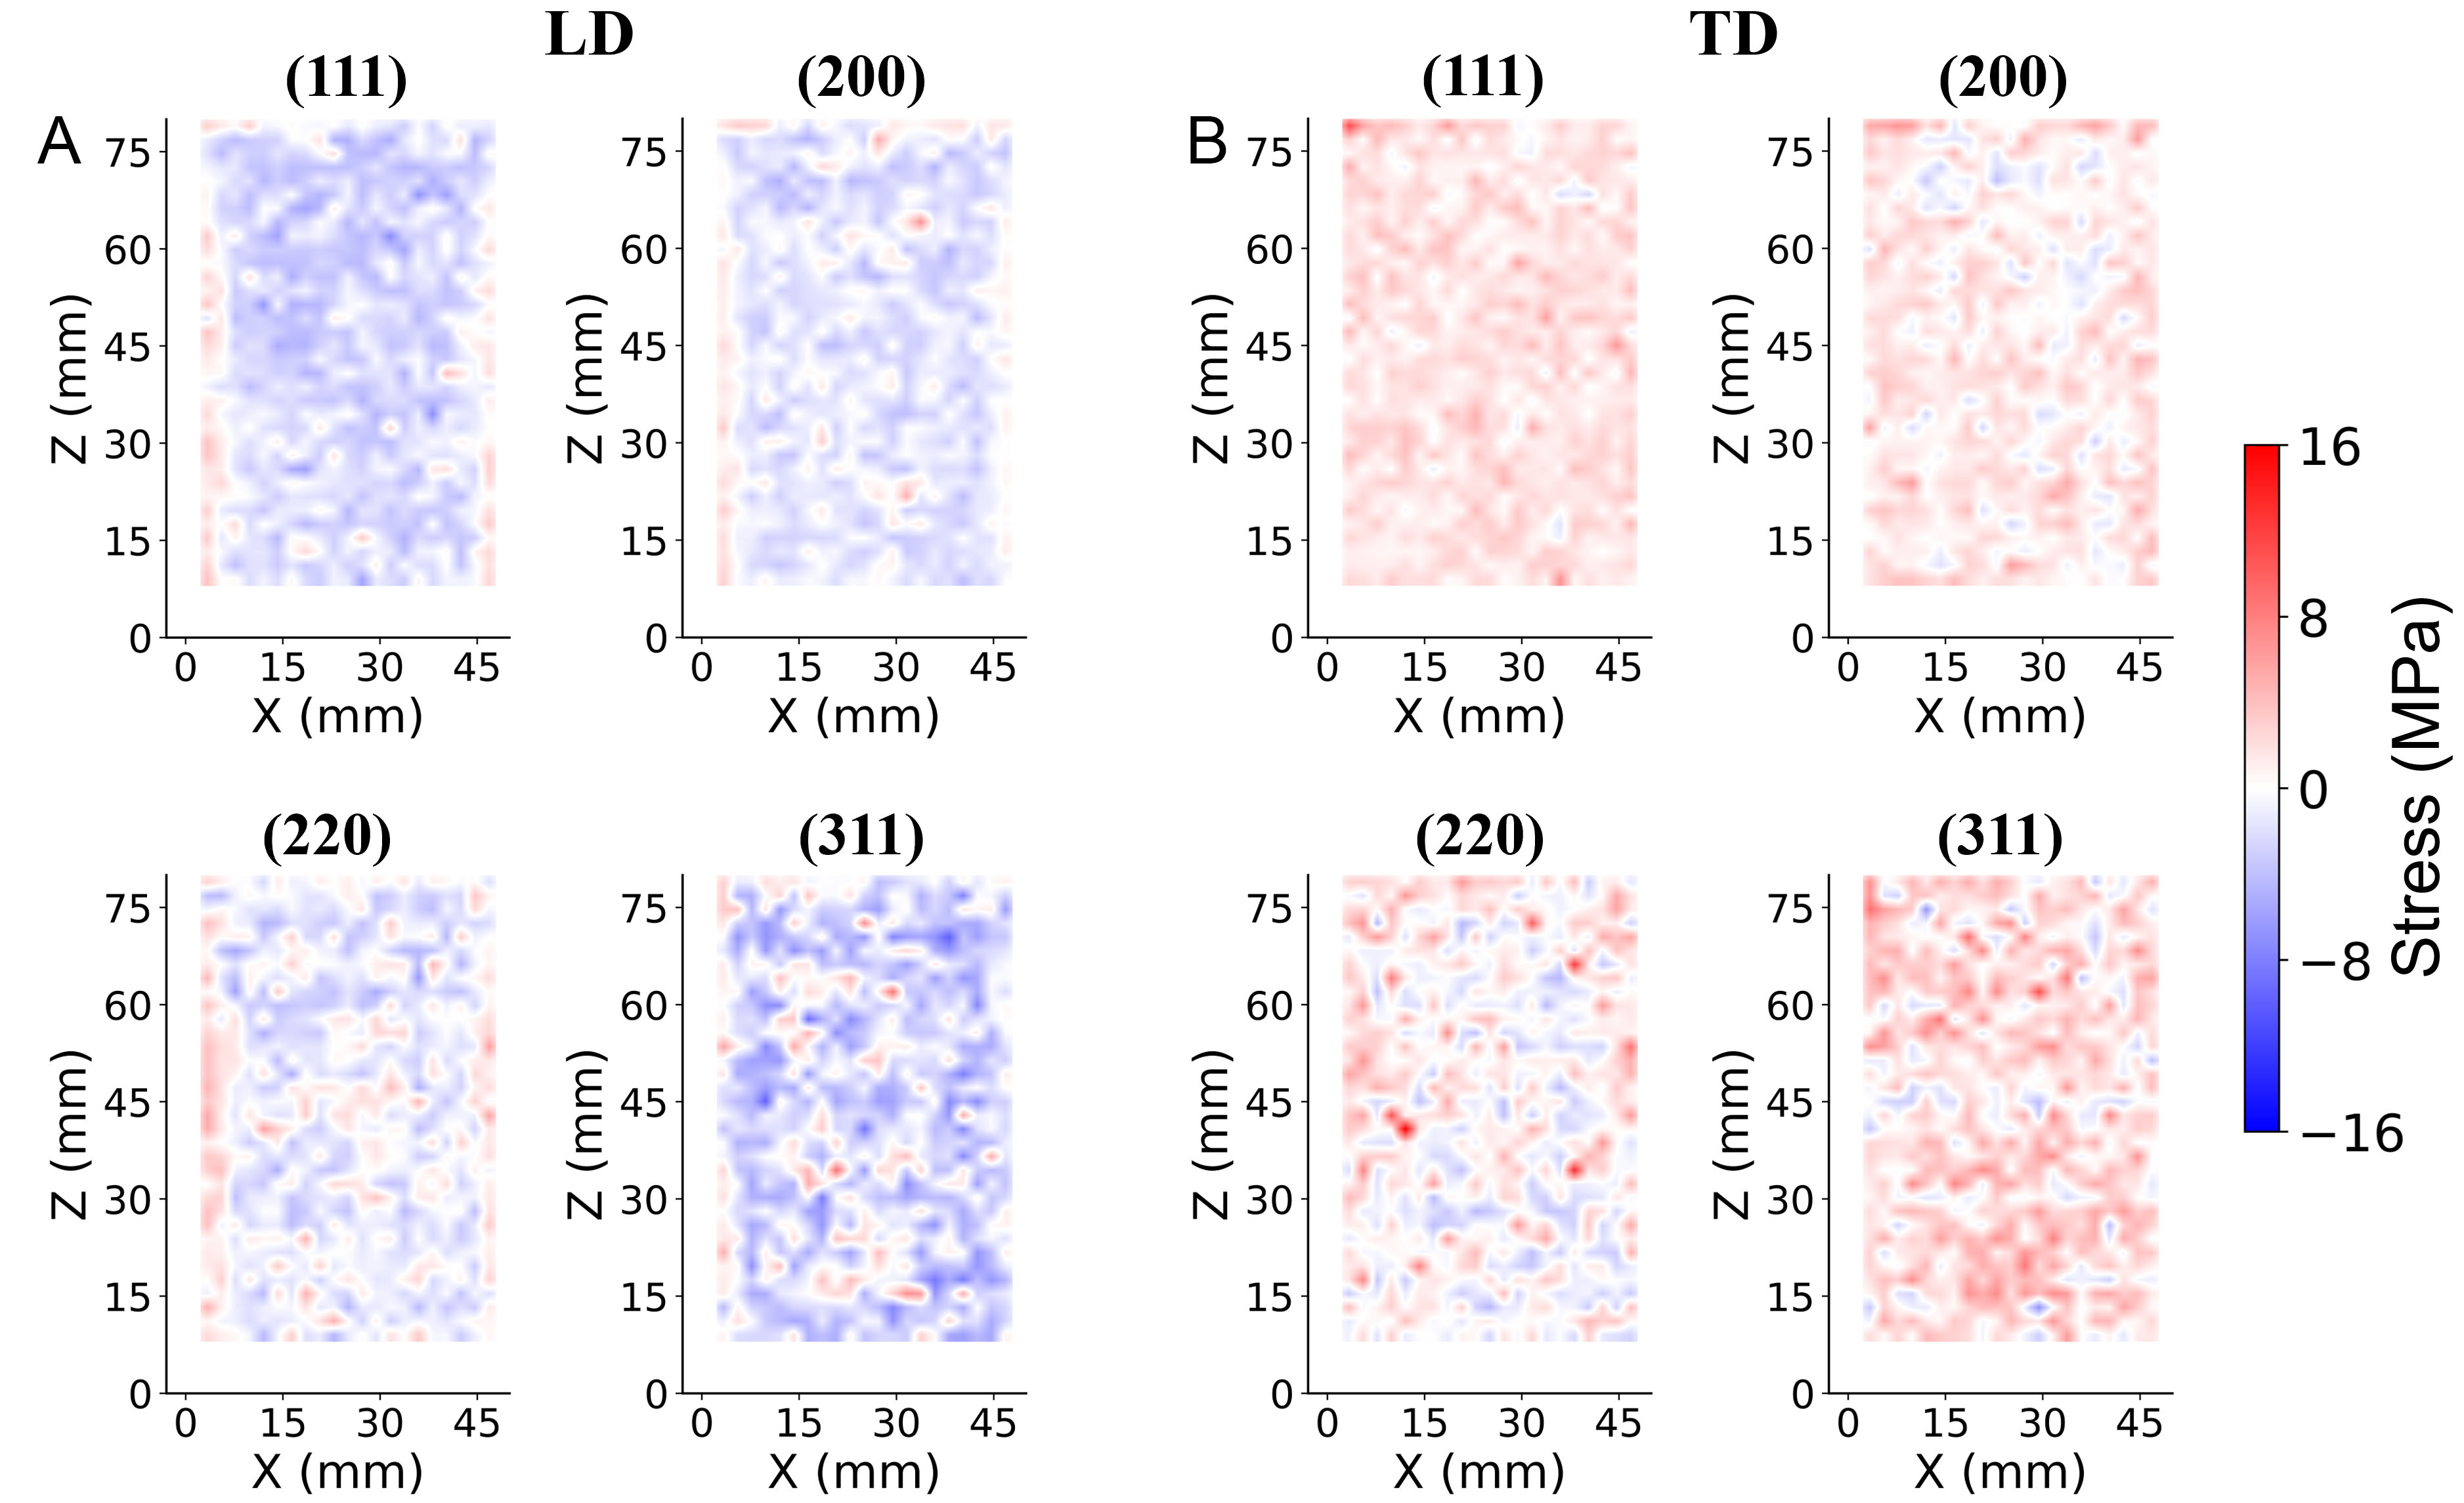
Figure 7. Maps showing the difference in measured residual stress between Pseudo-Voigt and Gaussian profiles when fitting X-ray diffraction data from additively manufactured IN718. Results are shown for the (A) LD and (B) TD, respectively. The color scale indicates the stress difference (MPa), with positive values indicating that the Pseudo-Voigt fit resulted in a larger residual stress magnitude and negative values indicating a smaller residual stress magnitude than the Gaussian fit. Each map corresponds to a different crystallographic plane (hkl), as indicated above each panel. LD: Loading direction; TD: transverse direction; IN718: Inconel 718.
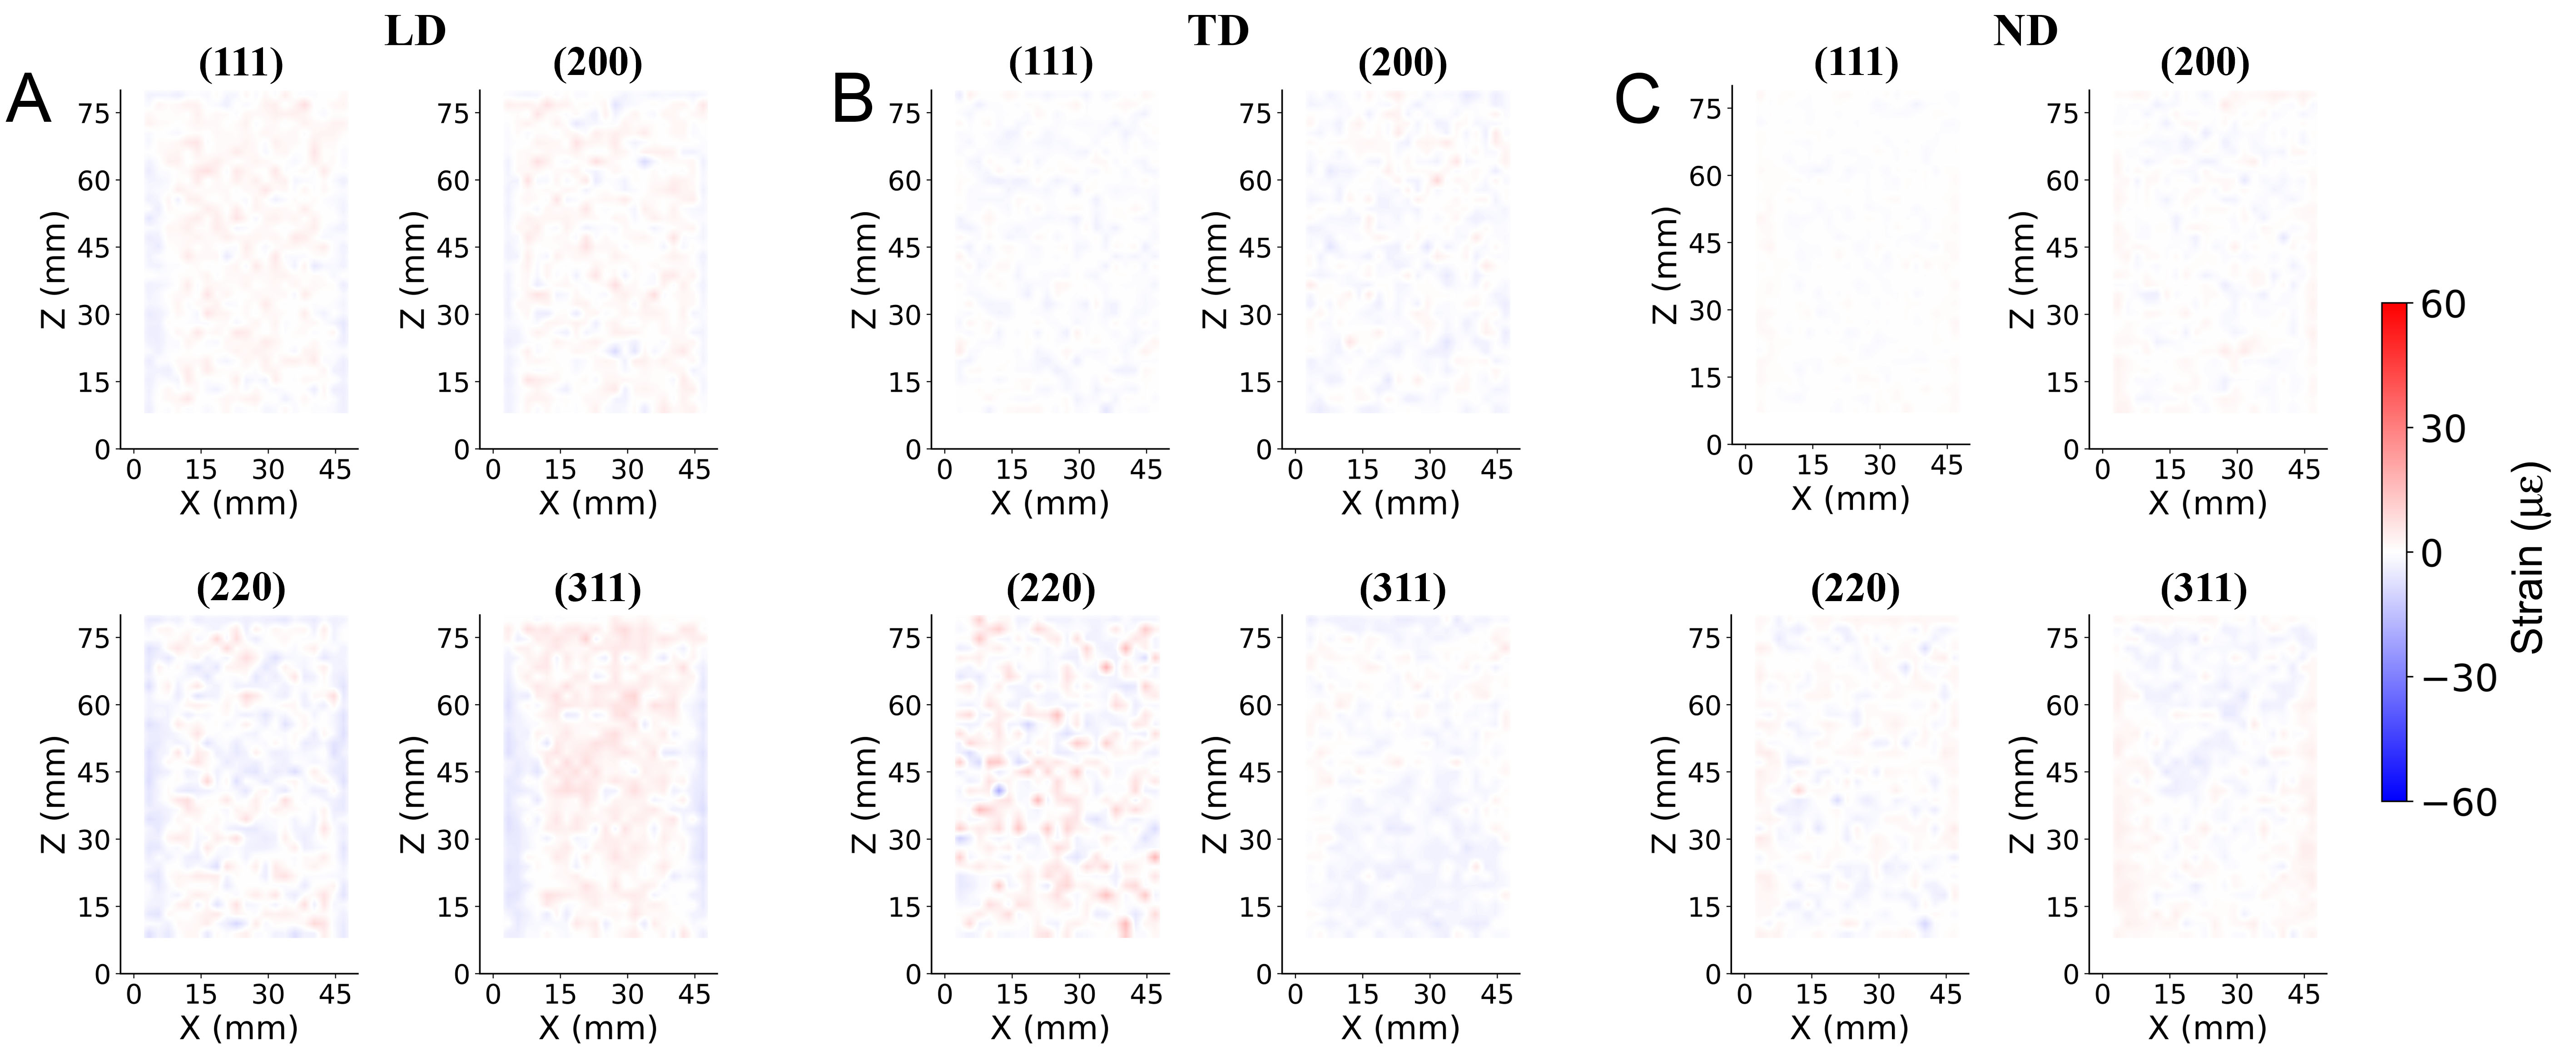
Figure 8. Maps showing the difference in measured residual strain between the Pseudo-Voigt and Pearson VII profile for fitting X-ray diffraction data from additively manufactured IN718. Results are shown for the (A) LD, (B) TD, and (C) ND strain difference. The color scale indicates differences in values, with positive values indicating that the Pseudo-Voigt fit resulted in a larger strain magnitude and negative values indicating a smaller strain magnitude than the Pearson VII fit. Each map corresponds to a different crystallographic plane (hkl), as indicated above each panel. LD: Loading direction; TD: transverse direction; ND: normal direction; IN718: Inconel 718.
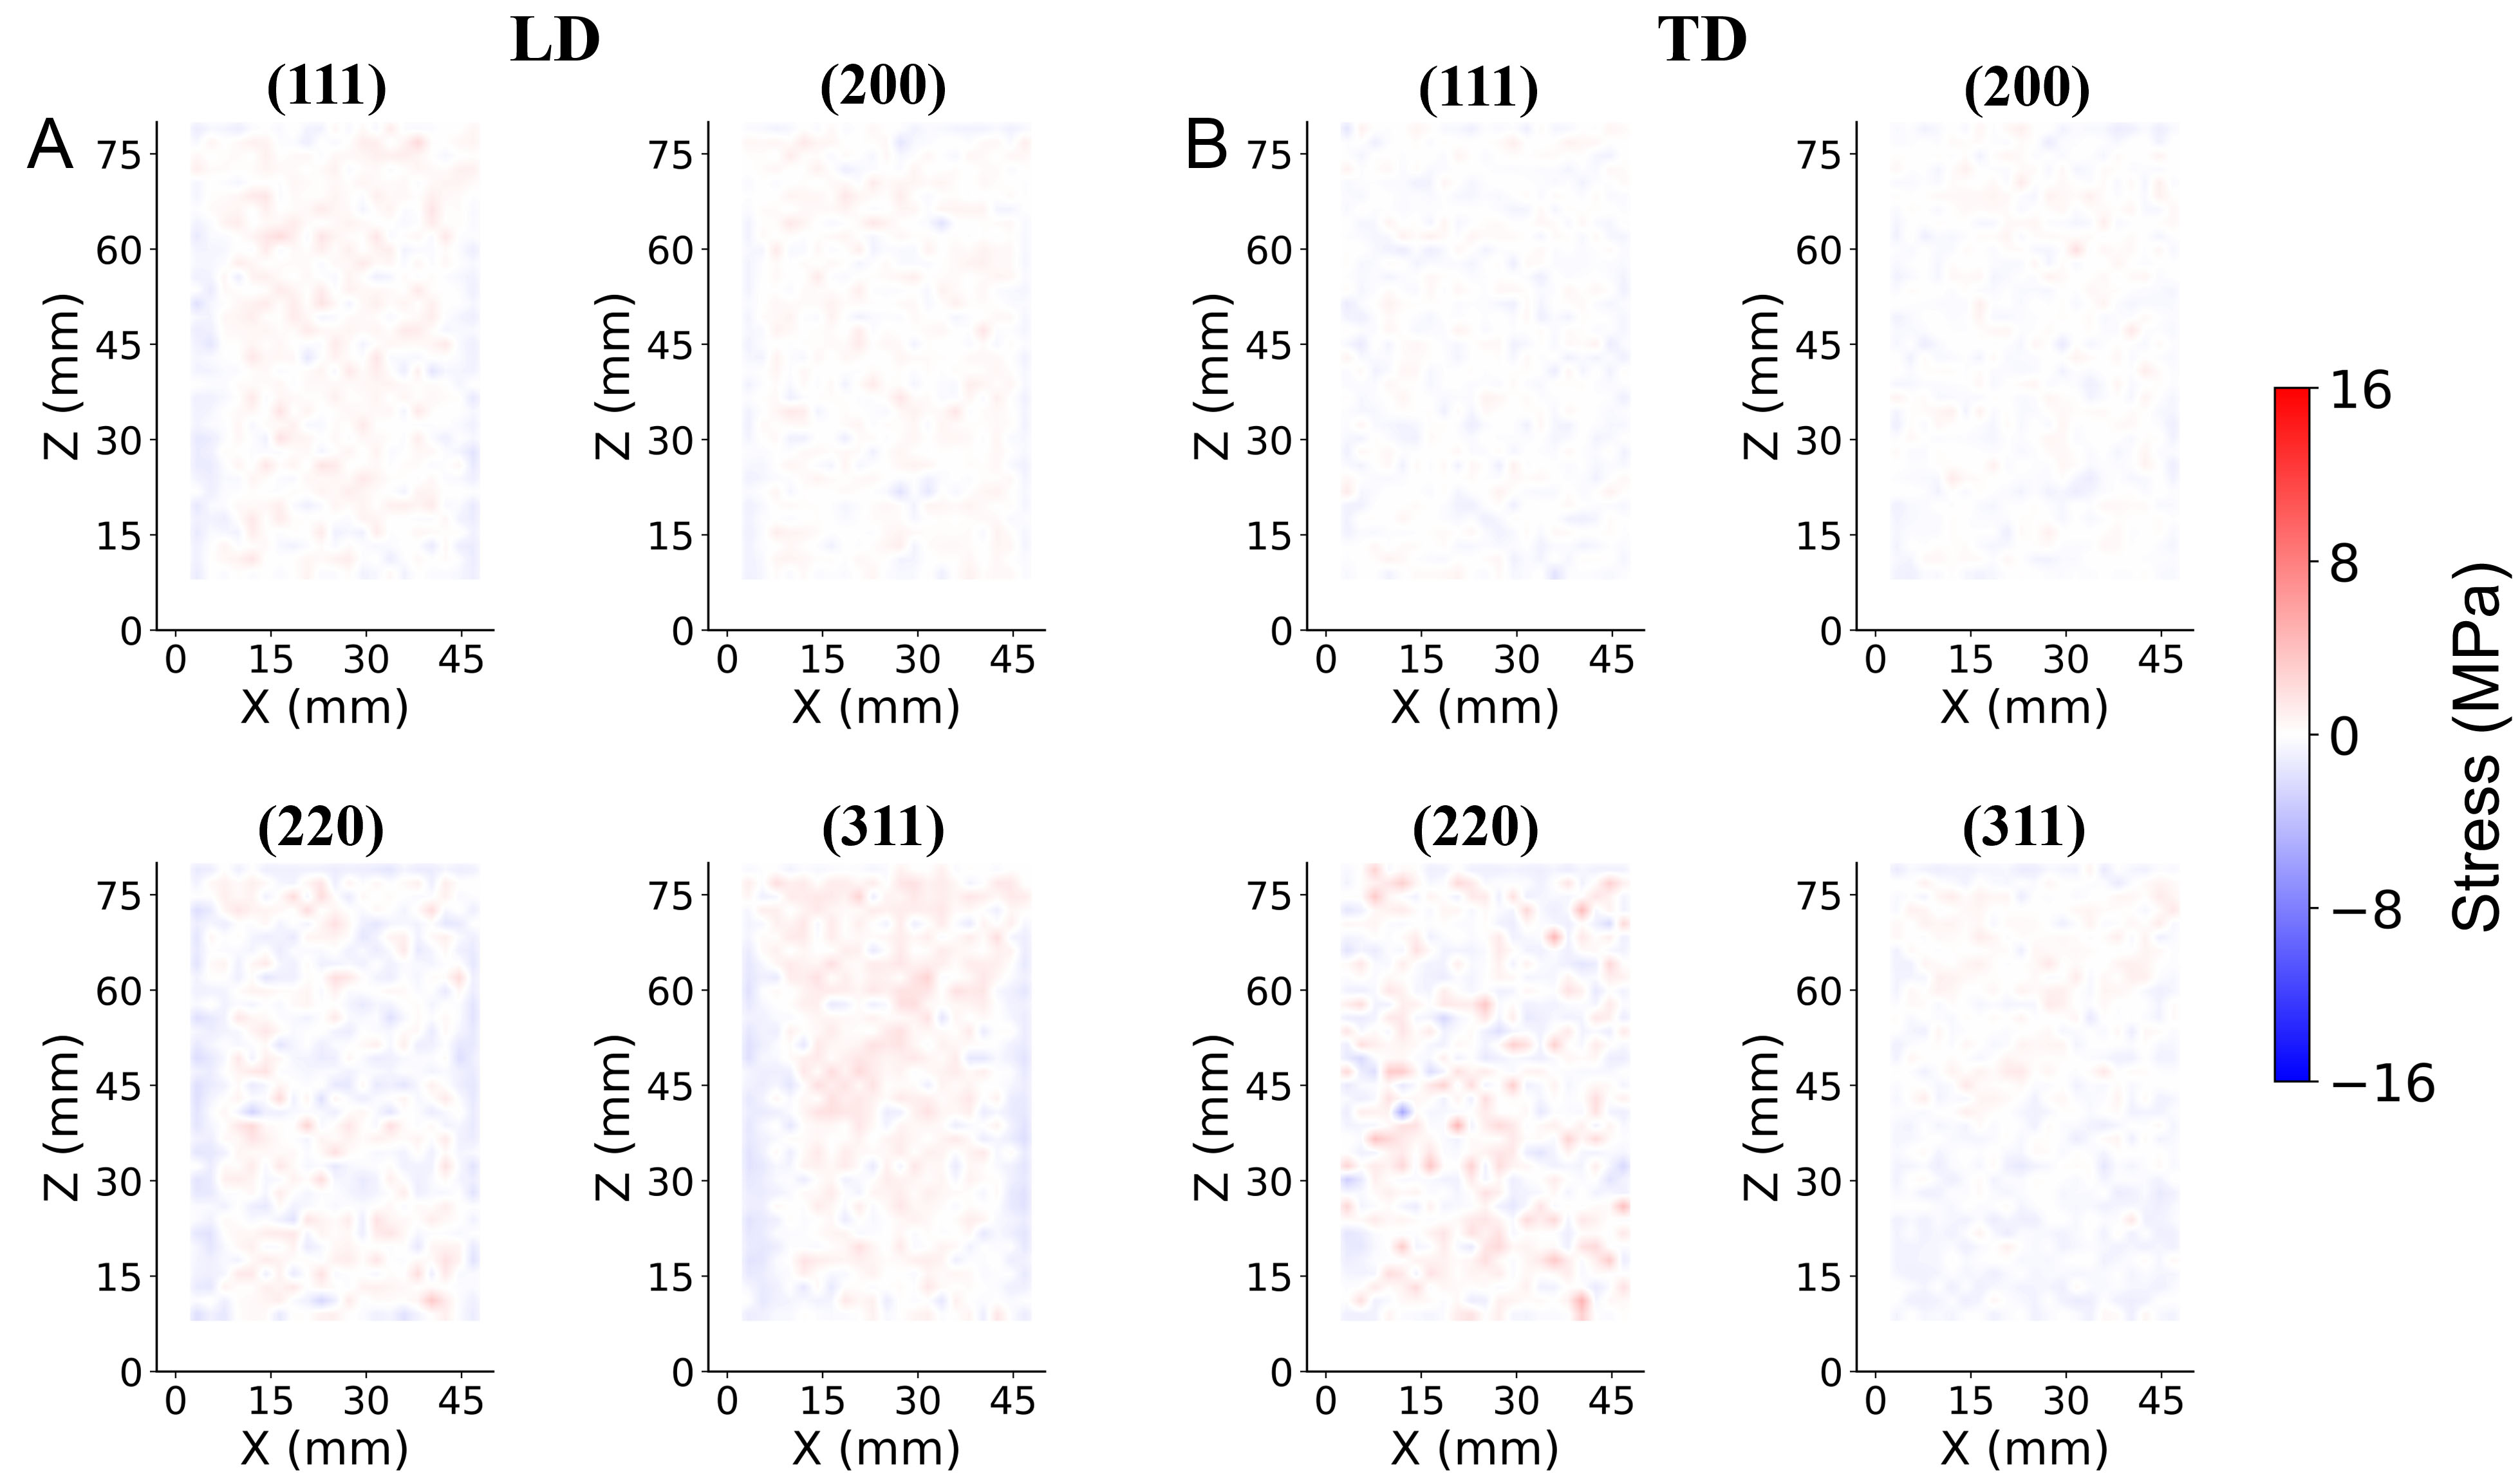
Figure 9. Maps showing the difference between the residual stress maps obtained using Pseudo-Voigt and Pearson VII for fitting X-ray diffraction data from additively manufactured IN718. Results are shown for the (A) LD and (B) TD, respectively. The color scale indicates the difference in values: positive values indicate that the Pseudo-Voigt fit yielded a larger residual stress magnitude than the Pearson VII fit, and negative values indicate the opposite. Each map corresponds to a different crystallographic plane (hkl), as indicated above each panel. LD: Loading direction; TD: transverse direction; IN718: Inconel 718.
Average and maximum absolute residual strain differences between fitting functions for different reflection planes
| (111) | (200) | (220) | (311) | |||||||||||||||||||||
| LD | TD | ND | LD | TD | ND | LD | TD | ND | LD | TD | ND | |||||||||||||
| Avg. | Max. | Avg. | Max. | Avg. | Max. | Avg. | Max. | Avg. | Max. | Avg. | Max. | Avg. | Max. | Avg. | Max. | Avg. | Max. | Avg. | Max. | Avg. | Max. | Avg. | Max. | |
| Pseudo-Voigt vs. Pearson VII | 1.8 | 8.0 | 1.2 | 5.7 | 0.6 | 2.8 | 1.9 | 8.8 | 1.6 | 9.7 | 1.2 | 5.9 | 2.7 | 9.6 | 3.2 | 20.4 | 1.6 | 9.7 | 3.0 | 10.9 | 1.7 | 6.2 | 1.7 | 6.1 |
| Pseudo-Voigt vs. Gaussian | 9.0 | 28.0 | 8.0 | 38.6 | 1.9 | 12.3 | 9.7 | 32.8 | 9.6 | 37.0 | 4.3 | 19.0 | 6.9 | 22.6 | 7.7 | 63.1 | 3.6 | 26.0 | 13.3 | 39.3 | 12.4 | 39.9 | 6.2 | 30.8 |
Average and maximum absolute residual stress differences between fitting functions for different reflection planes
| (111) | (200) | (220) | (311) | |||||||||||||
| LD | TD | LD | TD | LD | TD | LD | TD | |||||||||
| Avg. | Max. | Avg. | Max. | Avg. | Max. | Avg. | Max. | Avg. | Max. | Avg. | Max. | Avg. | Max. | Avg. | Max. | |
| Pseudo-Voigt vs. Pearson VII | 0.5 | 2.4 | 0.4 | 1.7 | 0.4 | 1.9 | 0.4 | 2.0 | 0.7 | 3.4 | 0.9 | 5.6 | 0.8 | 2.7 | 0.5 | 1.6 |
| Pseudo-Voigt vs. Gaussian | 2.2 | 7.3 | 1.8 | 11.2 | 1.7 | 6.9 | 1.6 | 6.6 | 1.8 | 6.4 | 2.0 | 16.4 | 2.9 | 10.0 | 2.6 | 11.0 |
Residual stress distribution
The crystallographic dependence of residual strain is systematically analyzed in Figure 10, which reveals distinct differences in strain magnitude between planes. The (200) plane maps display the greatest color contrast (from deep red to deep blue), indicating a much larger strain dynamic range than the others. This is physically consistent with the elastic anisotropy data in Table 2. The (200) plane is the most compliant (E200 is about 160 GPa), deforming markedly under stress, whereas the (220) plane is the stiffest (E220 is about 226 GPa), exhibiting smaller strains[10]. The distribution of the corresponding residual stress in Figure 11 follows the same trend.
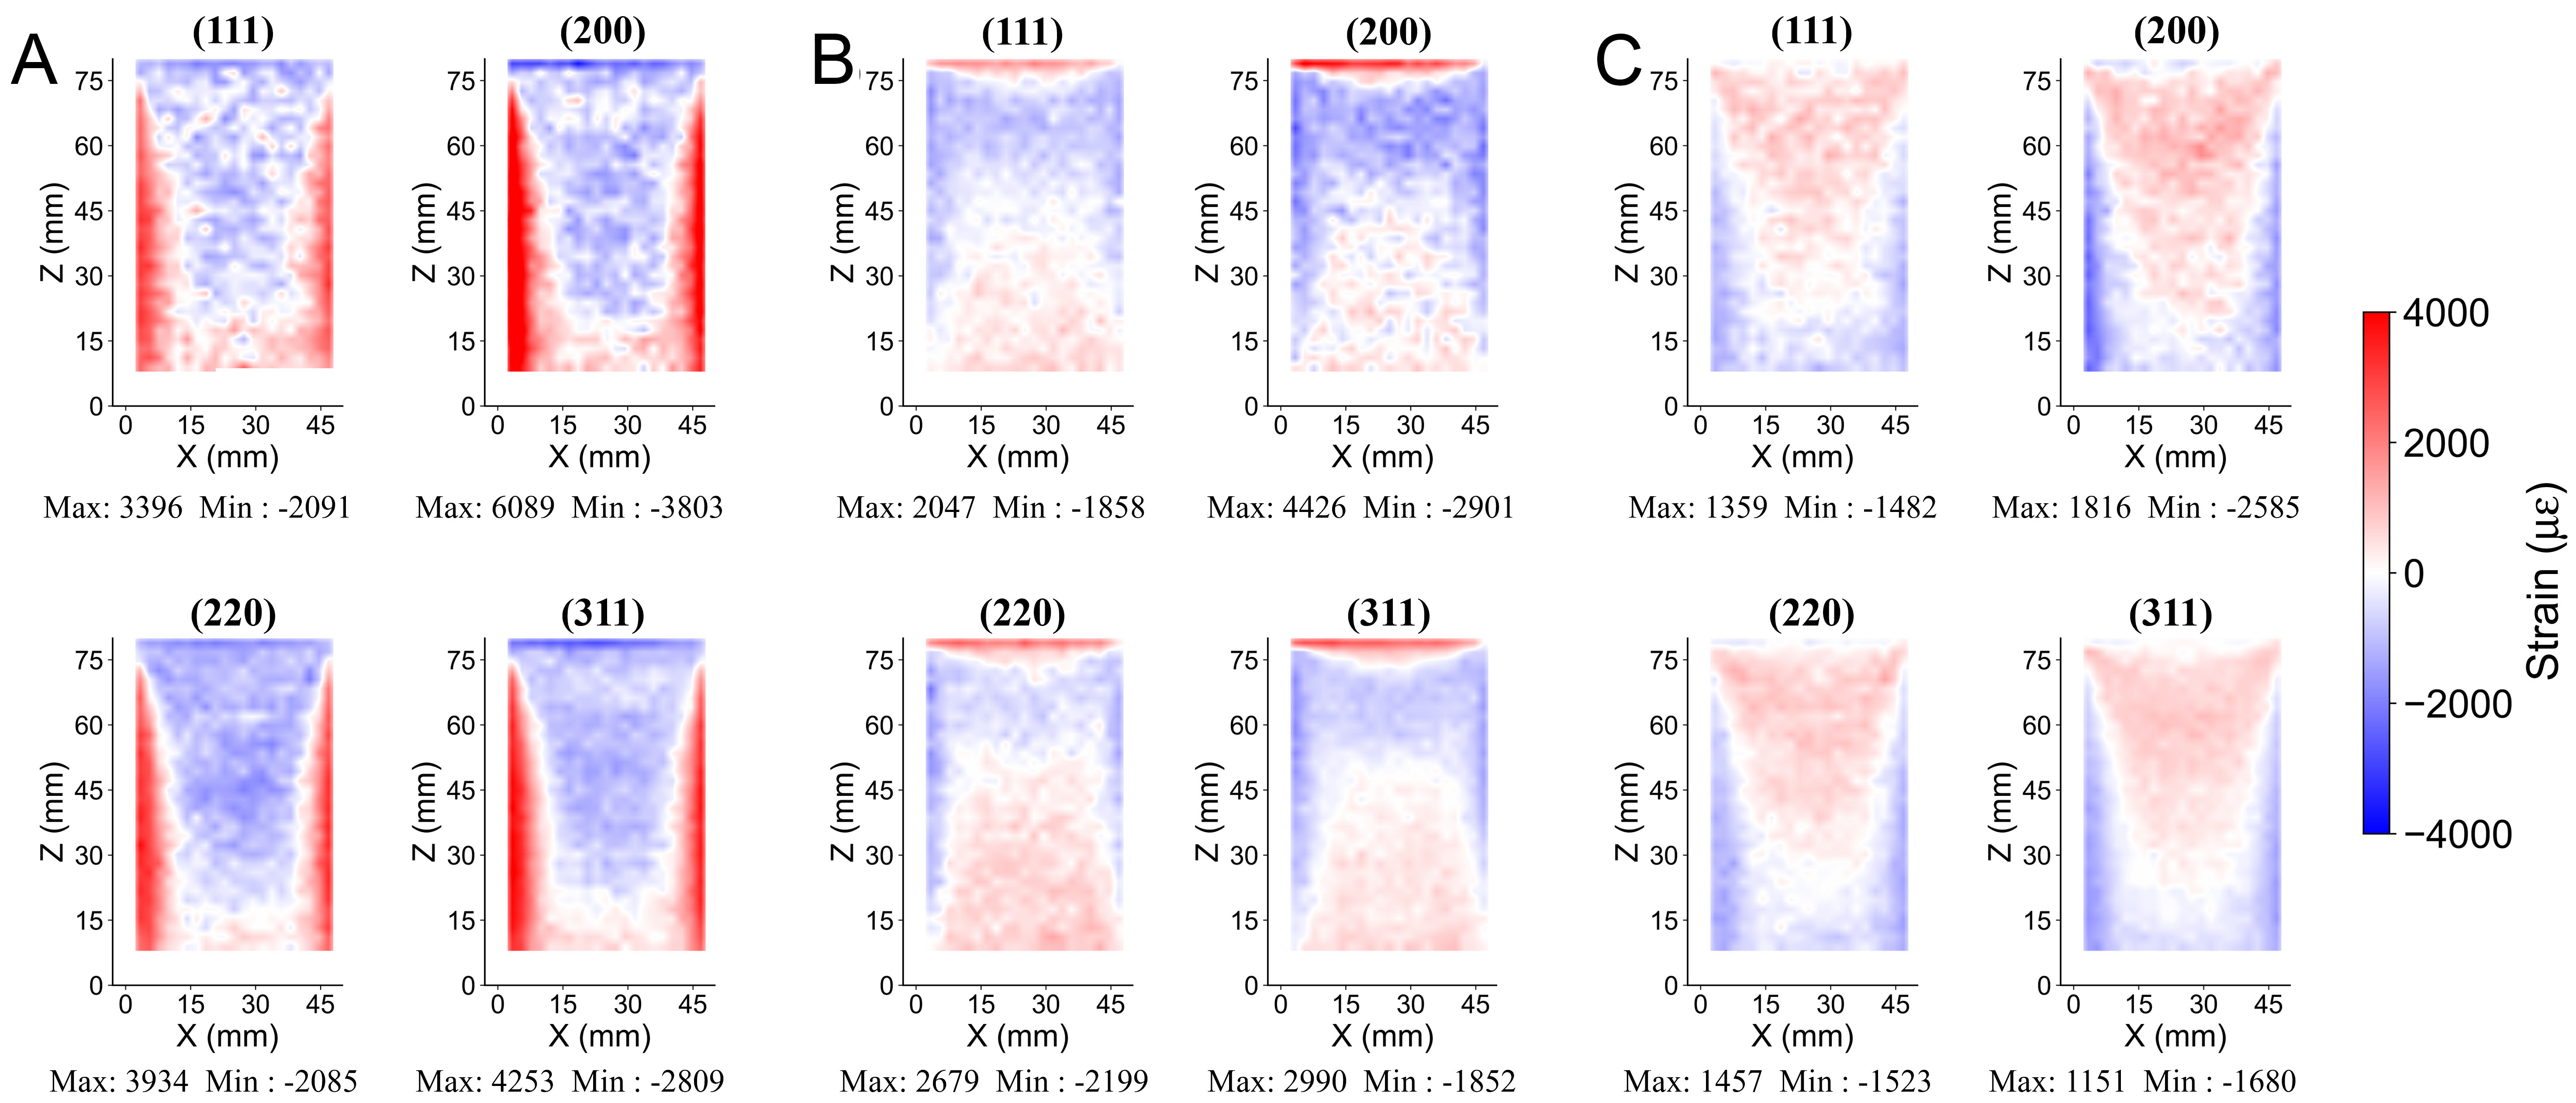
Figure 10. Distribution of residual strain for the (A) LD, (B) TD, and (C) ND in the additively manufactured Ni-based alloy sample, measured using synchrotron X-ray diffraction. Each map corresponds to a different crystallographic plane (hkl), as indicated above each panel. The color scale represents strain magnitude, with red indicating tensile strain and blue indicating compressive strain. LD: Loading direction; TD: transverse direction; ND: normal direction.
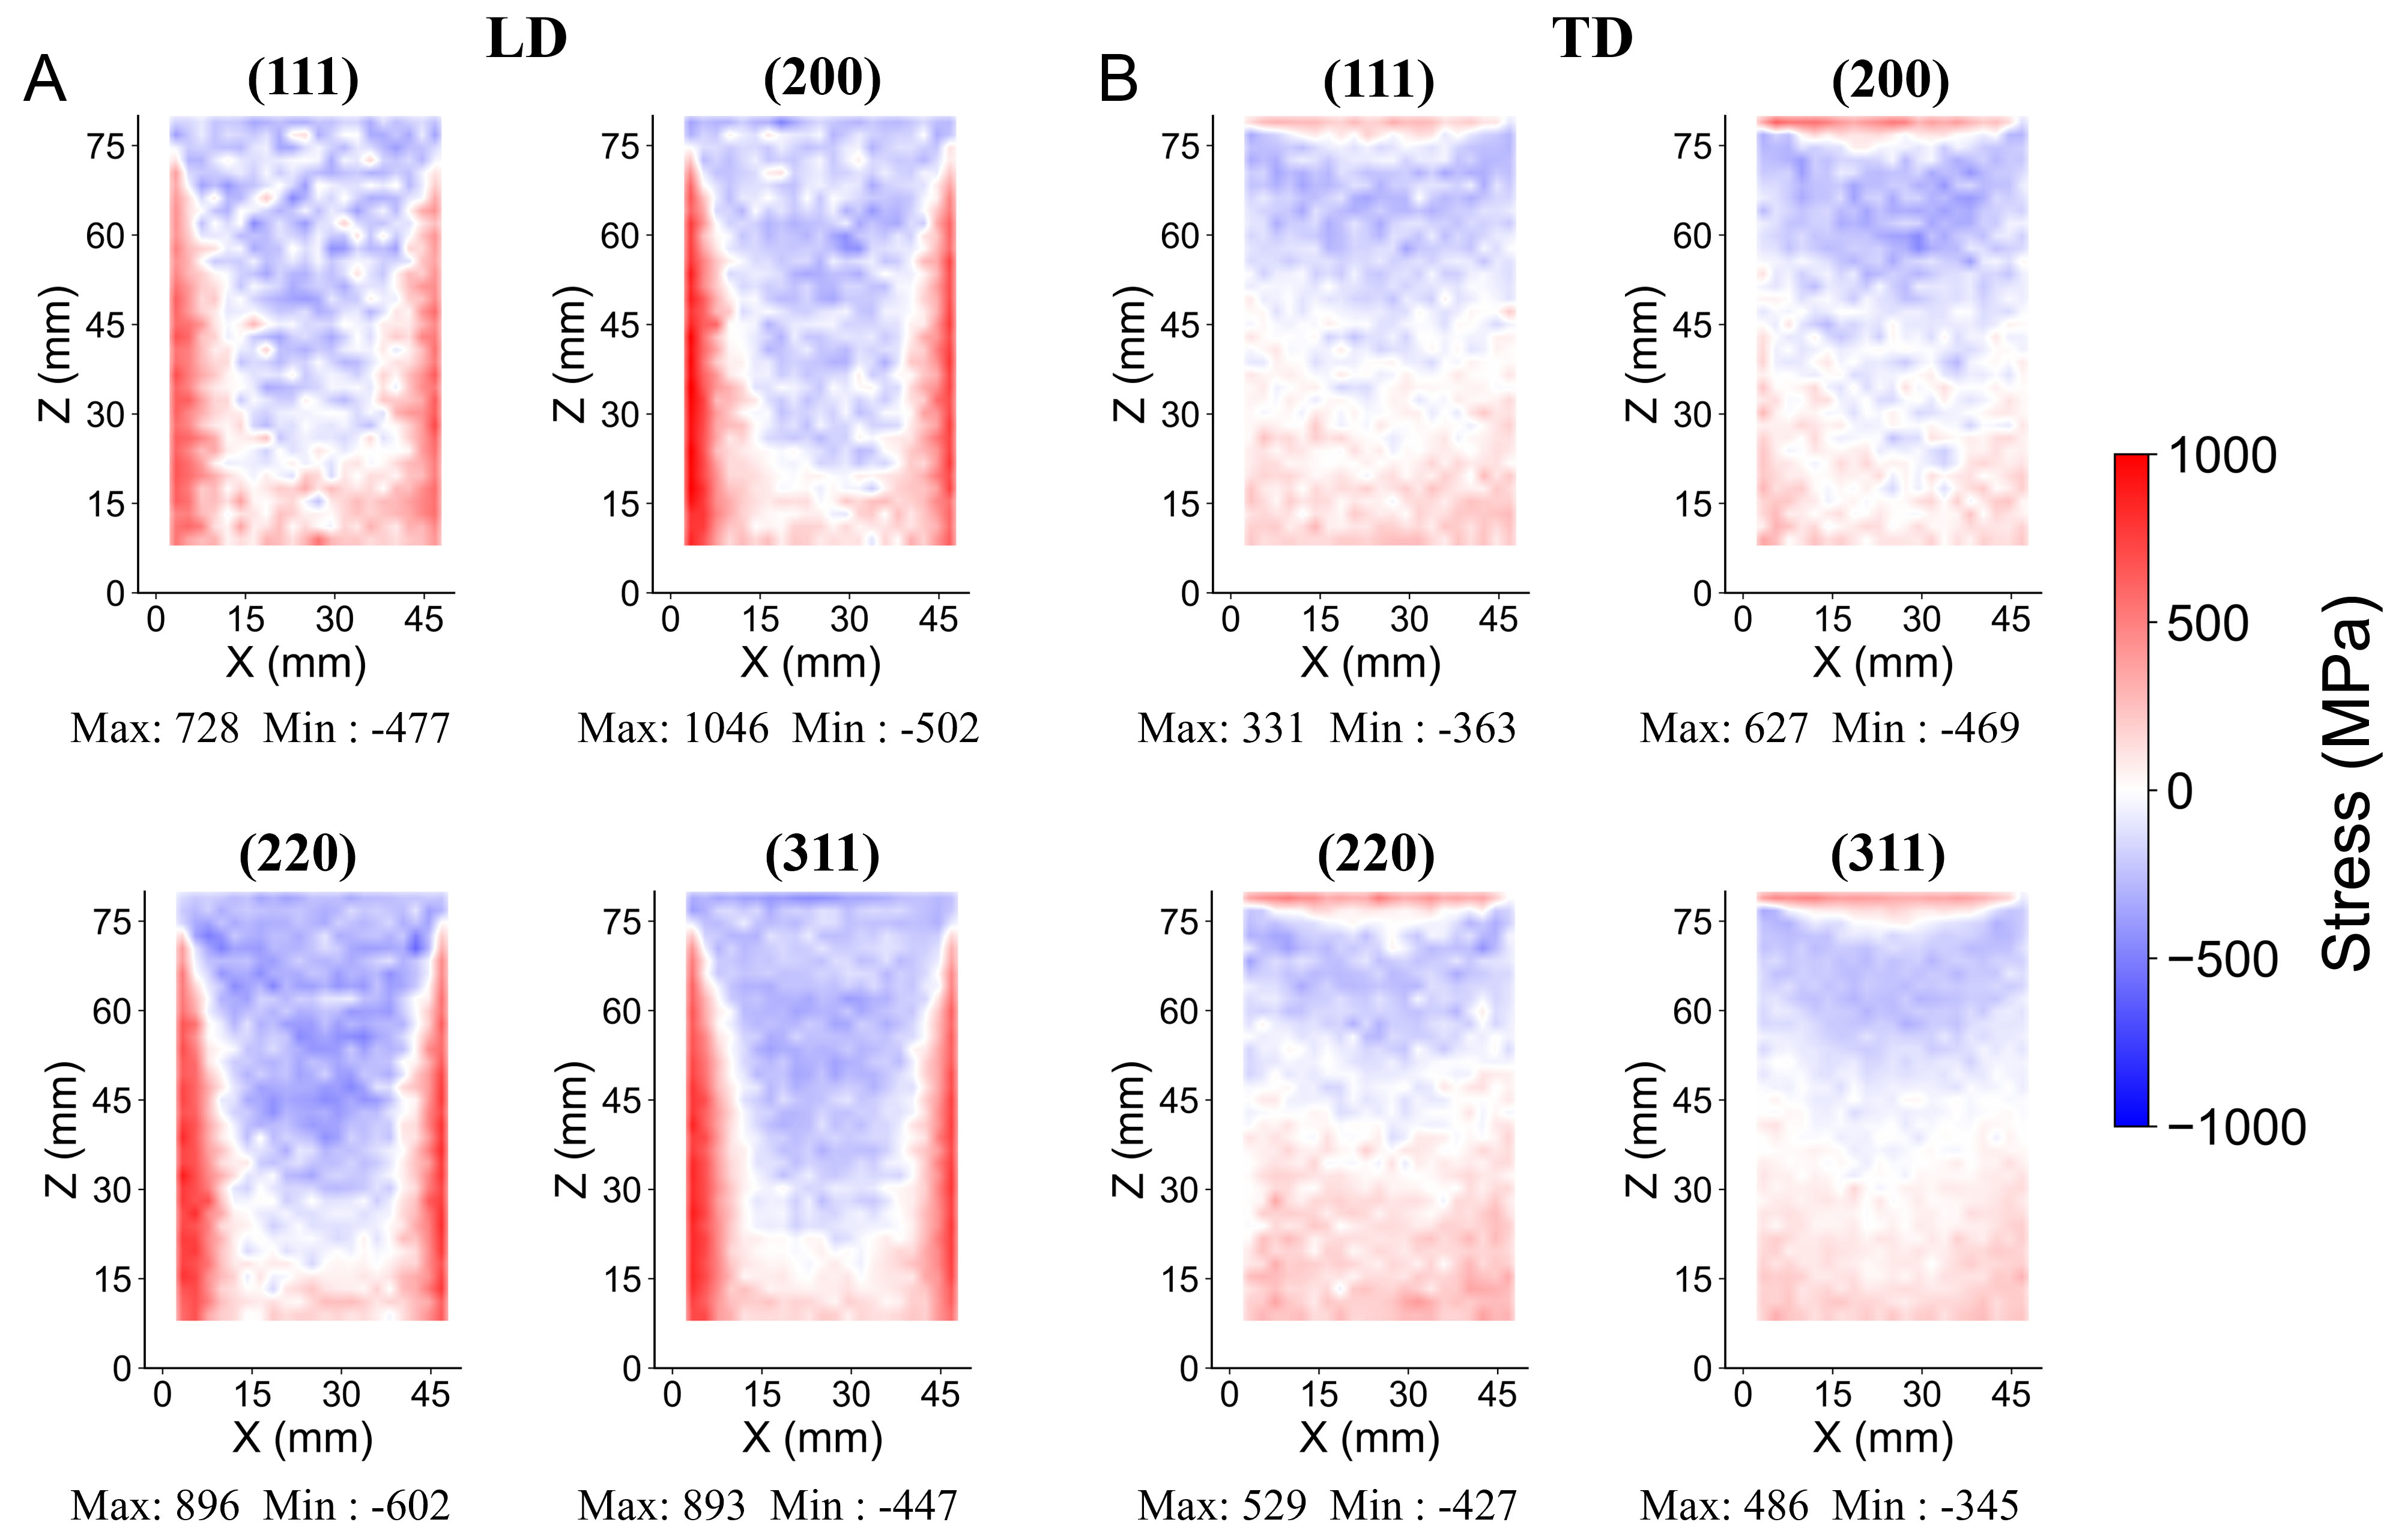
Figure 11. Residual stress field for the (A) LD and (B) TD in an additively manufactured Ni-based alloy, measured via synchrotron X-ray diffraction. The left and right columns correspond to LD and TD, respectively. Each map corresponds to a different crystallographic plane (hkl), as indicated above each panel. Red indicates tensile stress and blue indicates compressive stress. LD: Loading direction; TD: transverse direction.
To provide a macroscopic view, Figures 12 and 13 present the weighted-average results. Figure 12 shows the weighted macroscopic residual strain, and Figure 13 shows the corresponding macroscopic residual stress. Figure 13 clearly illustrates the “core compression, edge tension” distribution. The LD stress map [Figure 13A] shows substantial tensile concentrations at the vertical edges, which are much more pronounced than in the TD map [Figure 13B]. This anisotropy confirms that the residual stresses are dominated by constraints along the build direction. The literature consistently reports such directional dependencies in AM materials, which are linked to processing parameters and thermal effects[2].
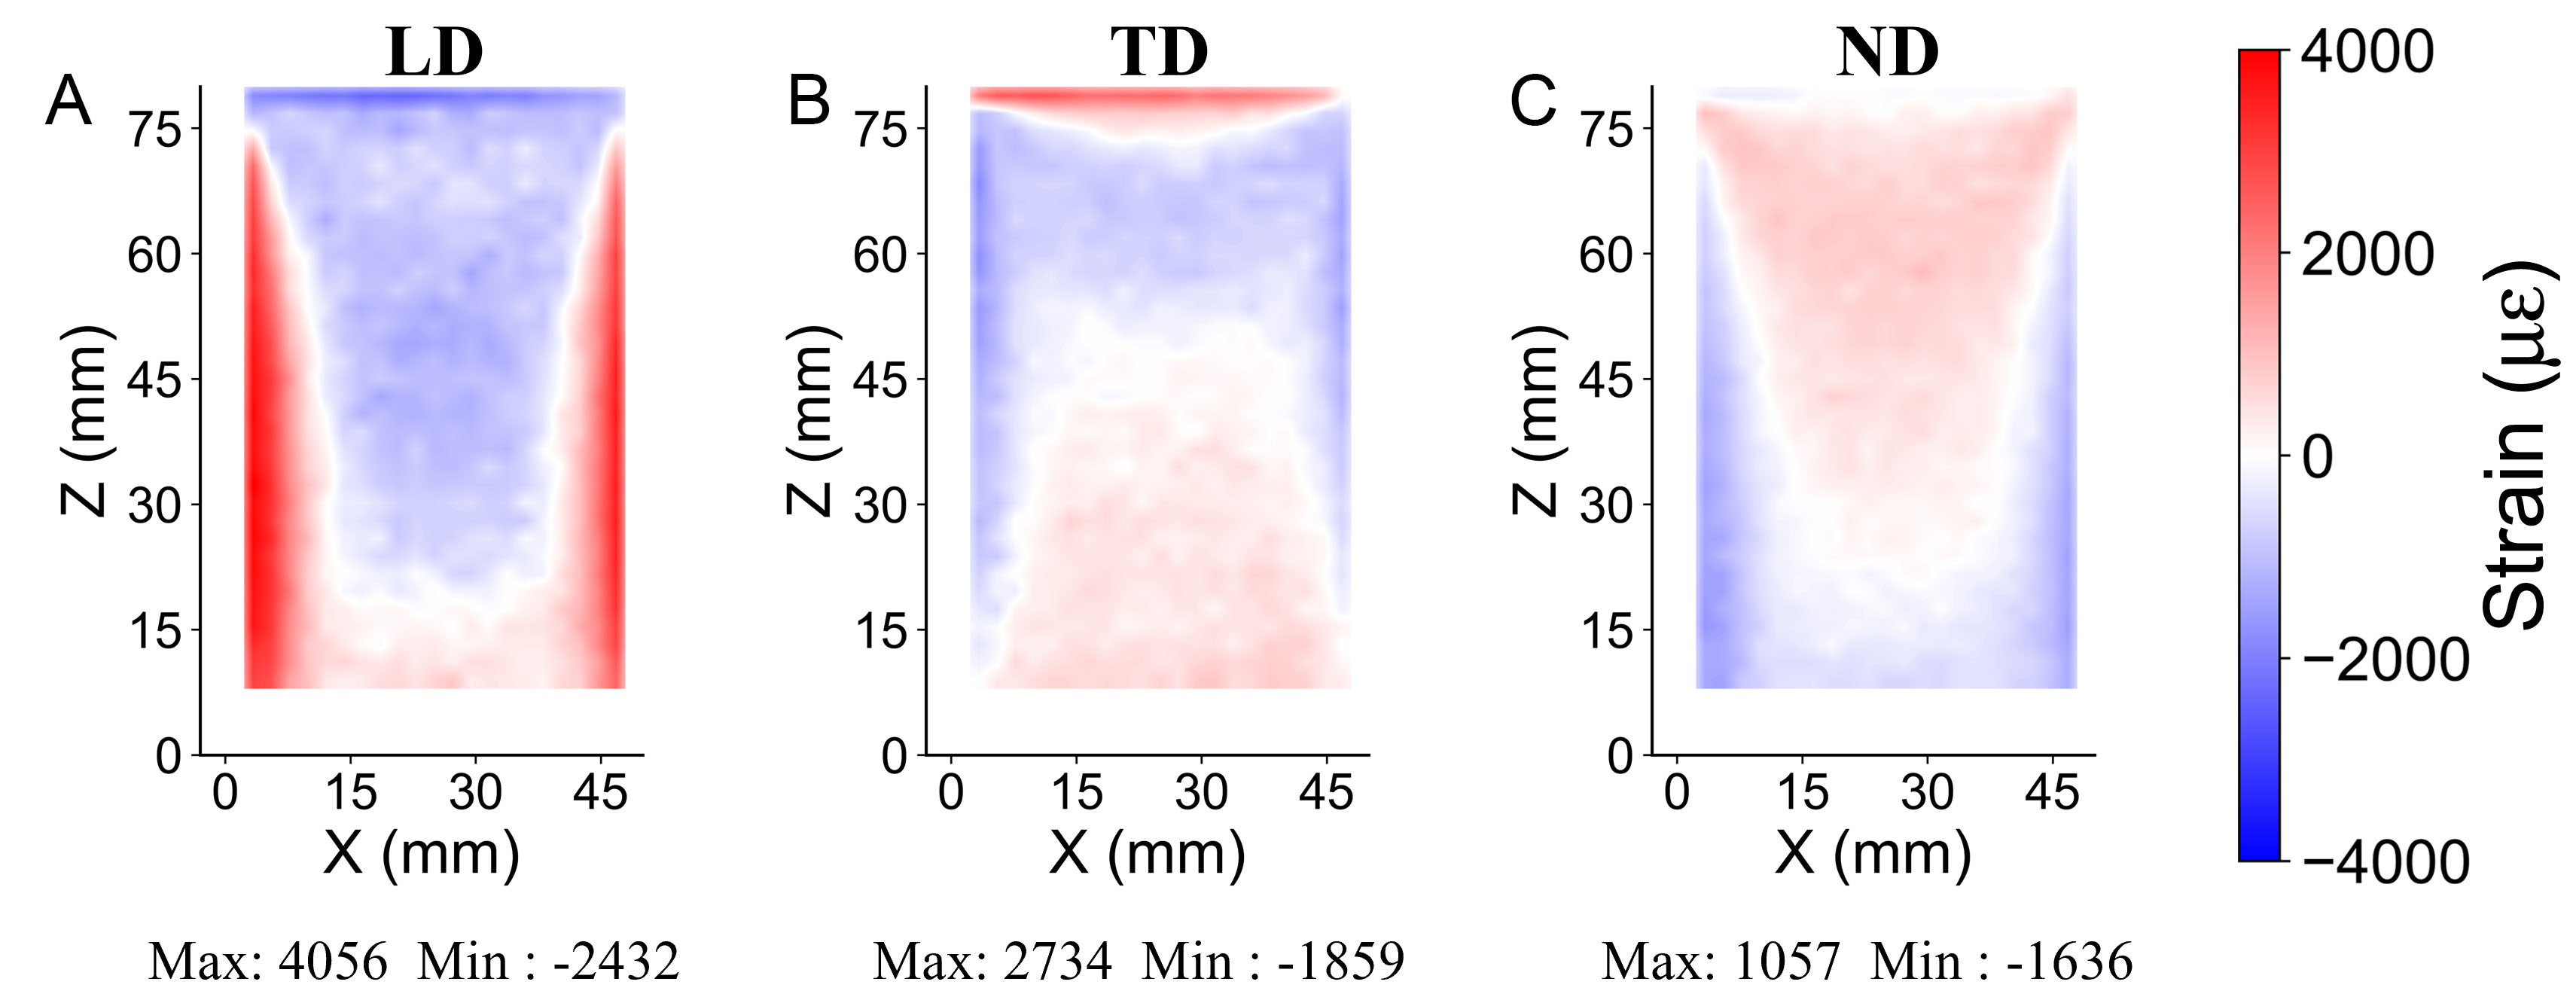
Figure 12. Weighted average residual strain map for the (A) LD, (B) TD, and (C) ND in the additively manufactured Ni-based alloy sample, obtained from multiple (hkl) crystallographic planes. The color scale represents the strain magnitude, with red indicating tensile strain and blue indicating compressive strain. LD: Loading direction; TD: transverse direction; ND: normal direction.
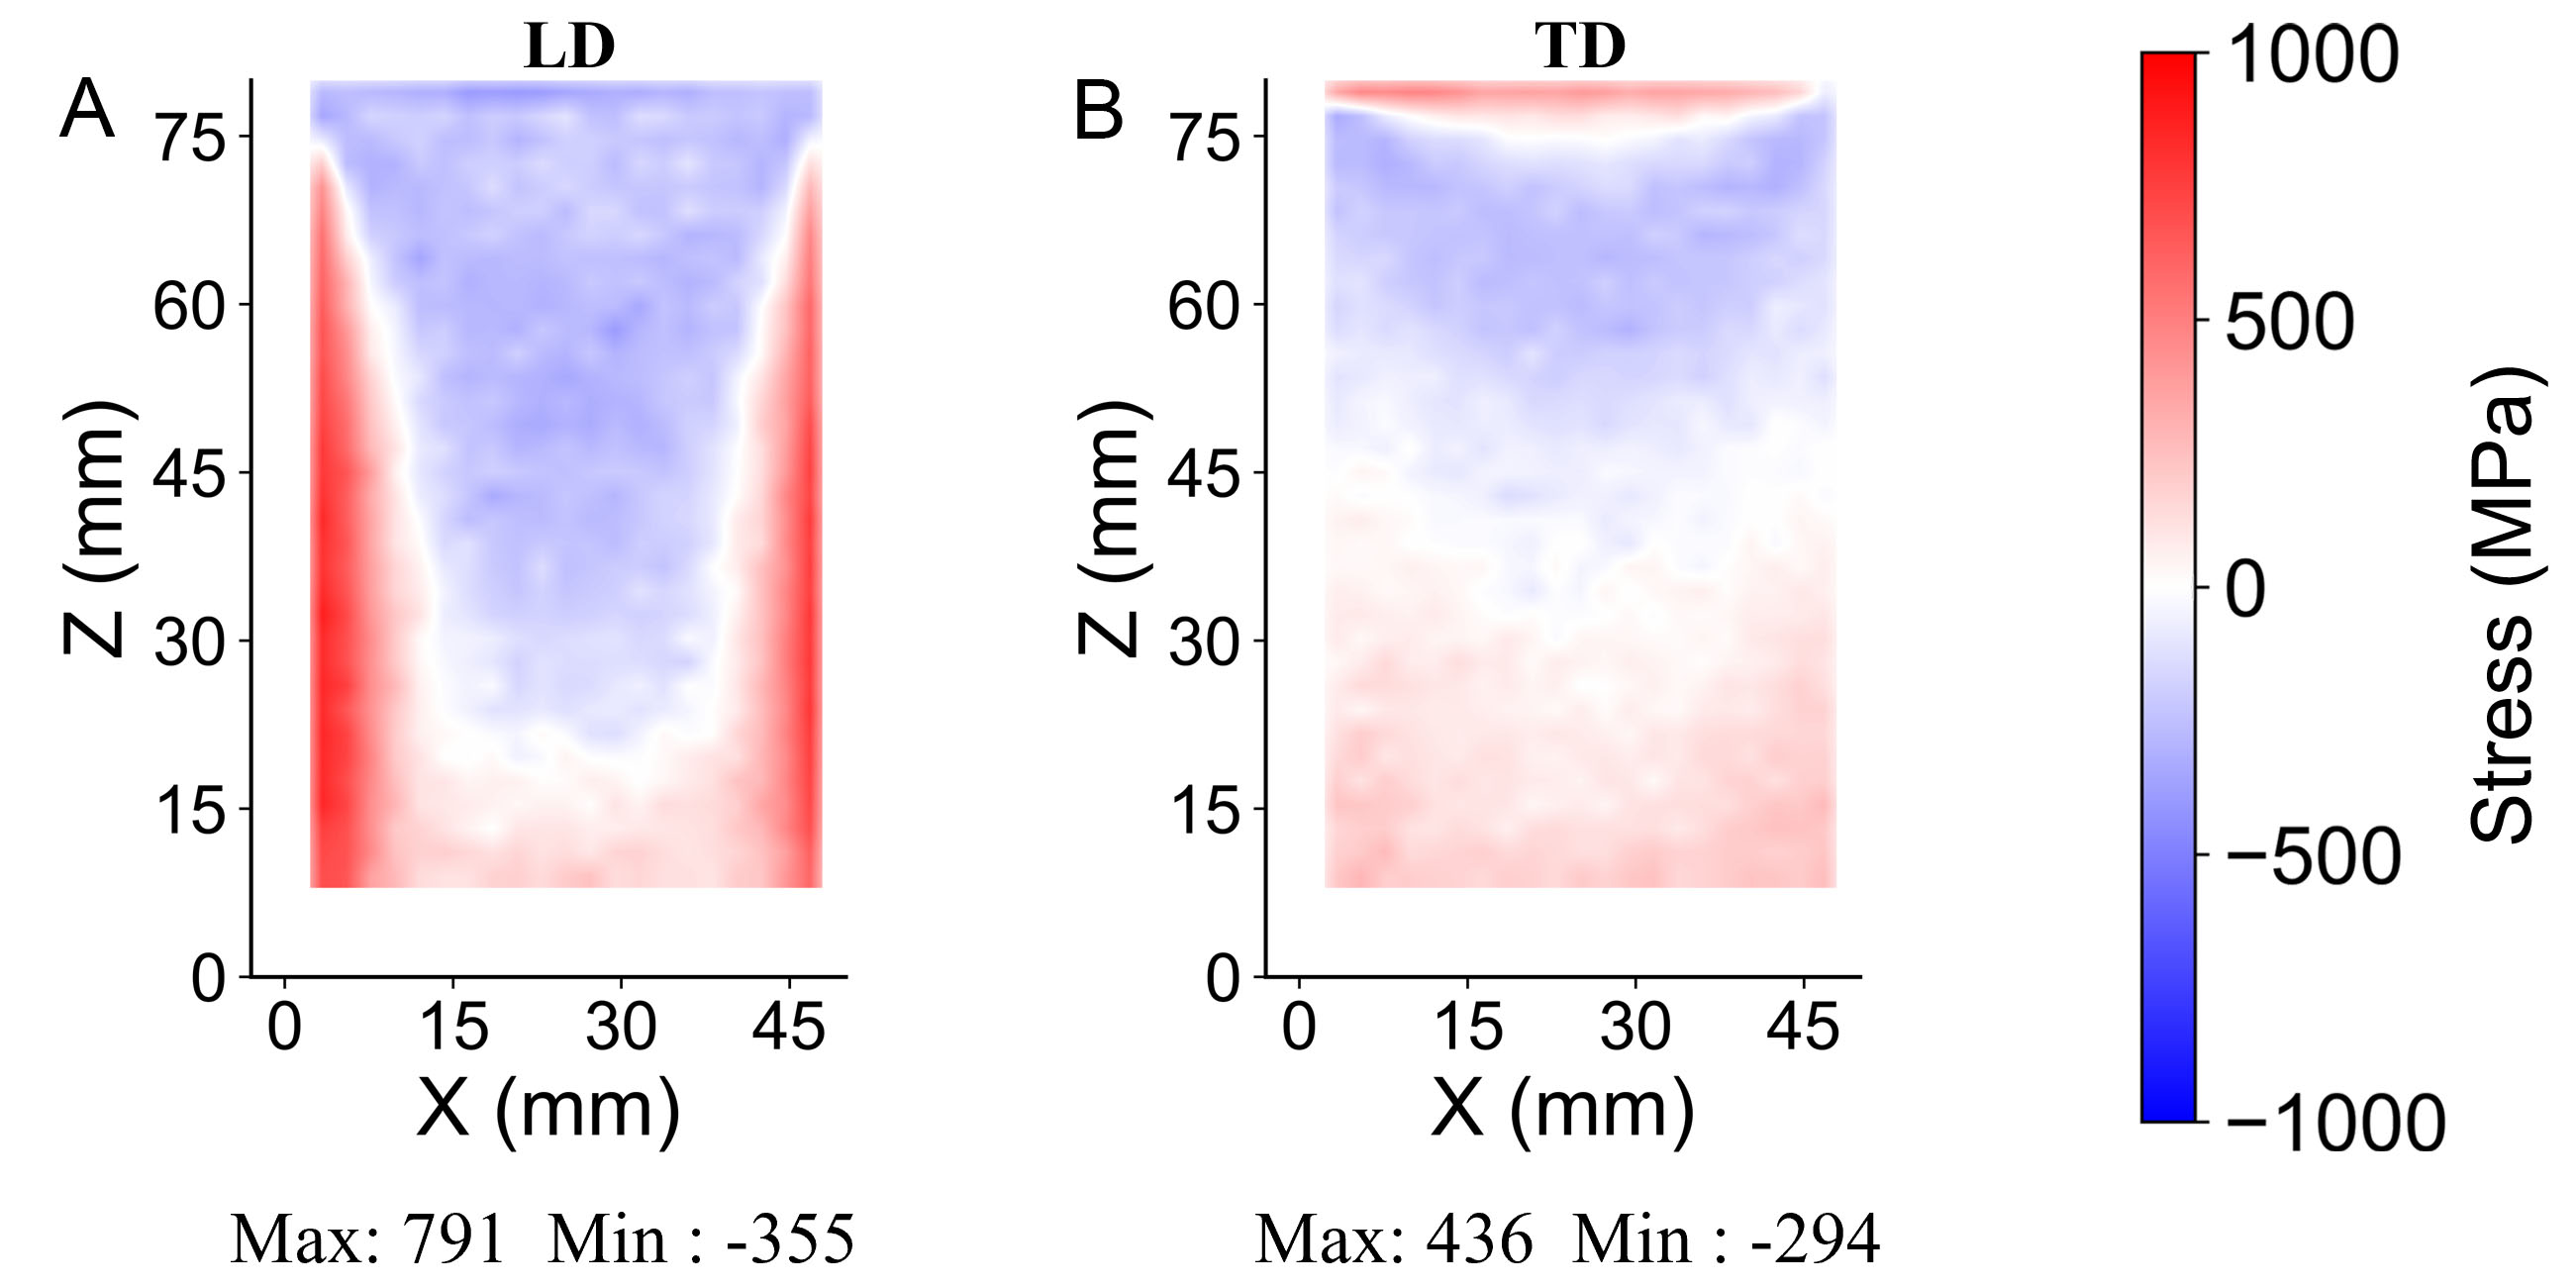
Figure 13. Weighted average residual stress field for the (A) LD and (B) TD in the additively manufactured Ni-based alloy sample, calculated from the individual (hkl) reflections and corresponding strain measurements. The color scale indicates the magnitude of residual stress, ranging from -1,000 MPa (compressive) to +1,000 MPa (tensile). LD: Loading direction; TD: transverse direction.
The line profiles for residual strains and stresses are illustrated in Figures 14 and 15, respectively. Figure 14 presents residual strain variation along the X-axis at four distinct Z-heights within the build: near the plate bottom (10 mm), at the mid-height (45 mm), near the top surface (76 mm), and immediately below the top surface (78 mm) along LD (red), TD (blue), and ND (green). The LD residual strain magnitude is substantially larger than in TD and ND. For LD, the residual strain profiles exhibit a characteristic “U-shaped” tensile distribution, with high tensile strain concentrated at the bottom and at the two vertical edges. By contrast, TD exhibits an inverted “U-shaped” compressive residual strain distribution, with considerable tensile residual strain at the top edge (Z = 78 mm) and the bottom. The overall geometric features of the residual stress field outline are consistent with previous reports[2,23]. However, the absolute magnitudes of residual stress measured in this as-built sample are higher. In direct thermodynamic comparison with thinner-walled struts or smaller test coupons often analyzed in the literature[23], the higher magnitudes measured may be attributed to the severe thermal confinement within the solid core of our thick plate. This thick internal structural bulk restrains the horizontal cooling shrinkage of the peripheral layers, thereby driving higher localized macroscopic tensile stresses at the lateral boundaries, as will be discussed in the following section, “Physical mechanisms of stress formation”.
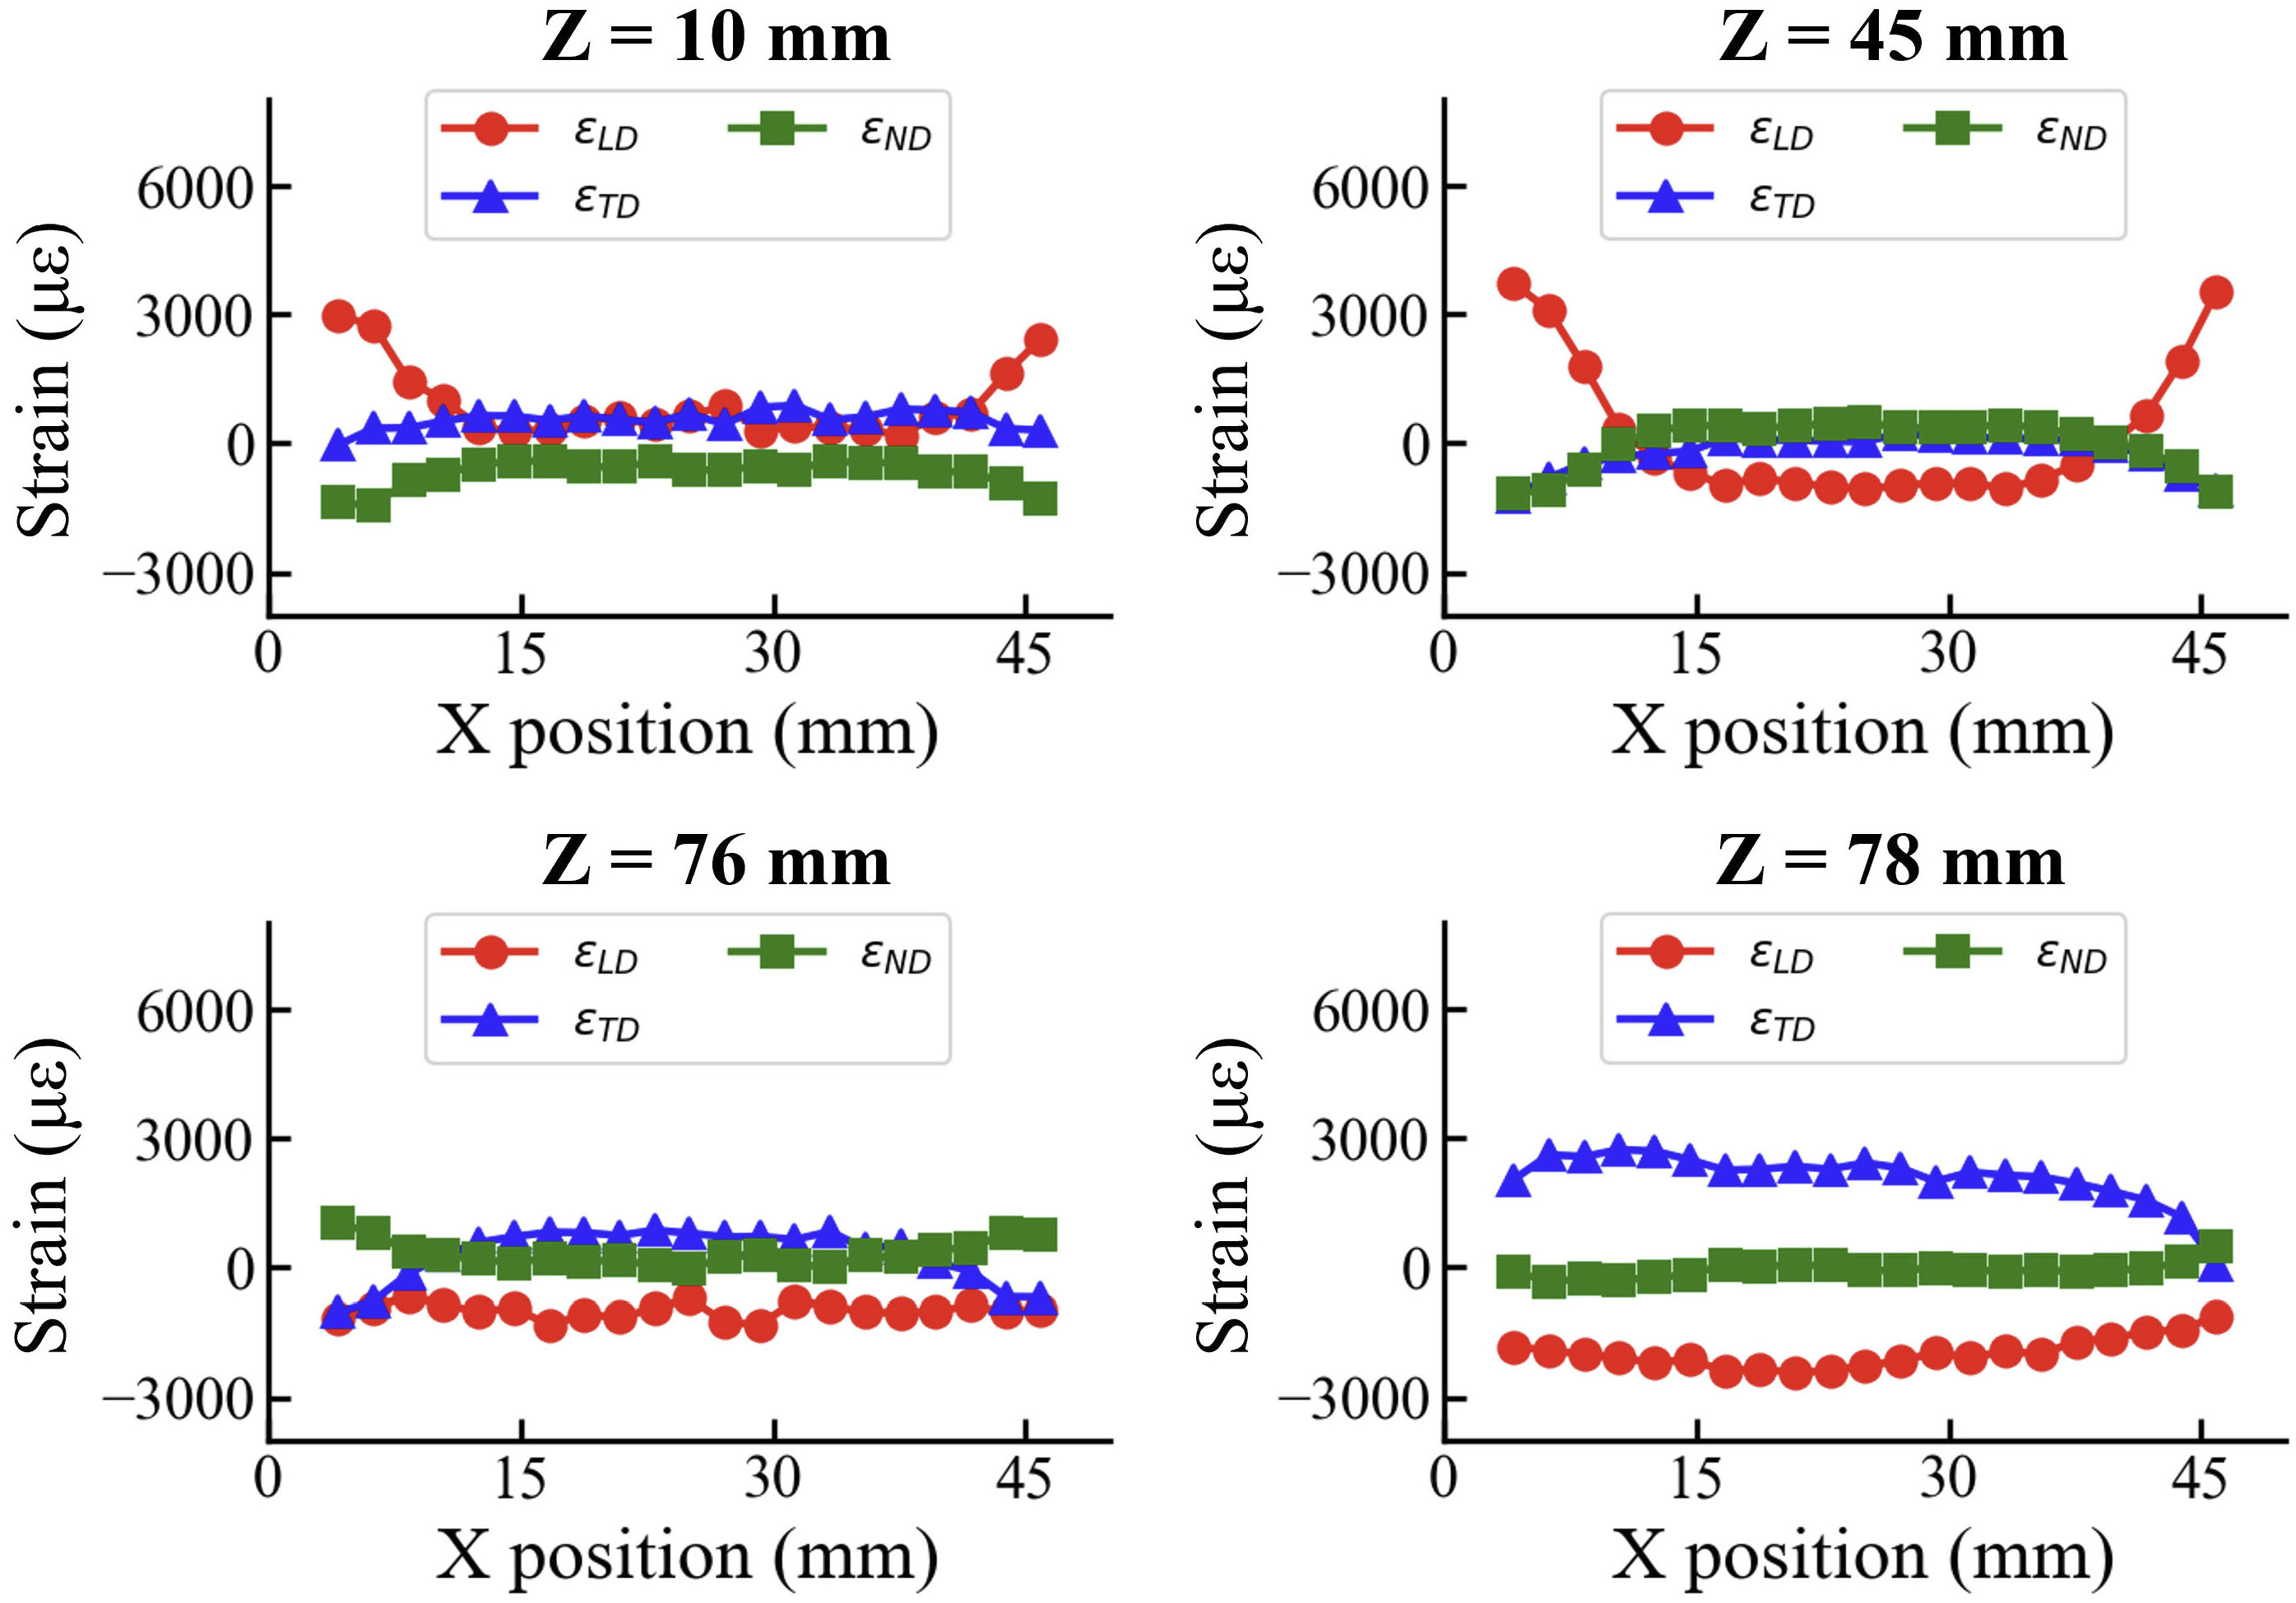
Figure 14. Variation along the X-axis at different Z-heights (Z = 10, 45, 76, and 78 mm) for the LD, TD, and ND. LD: Loading direction; TD: transverse direction; ND: normal direction.
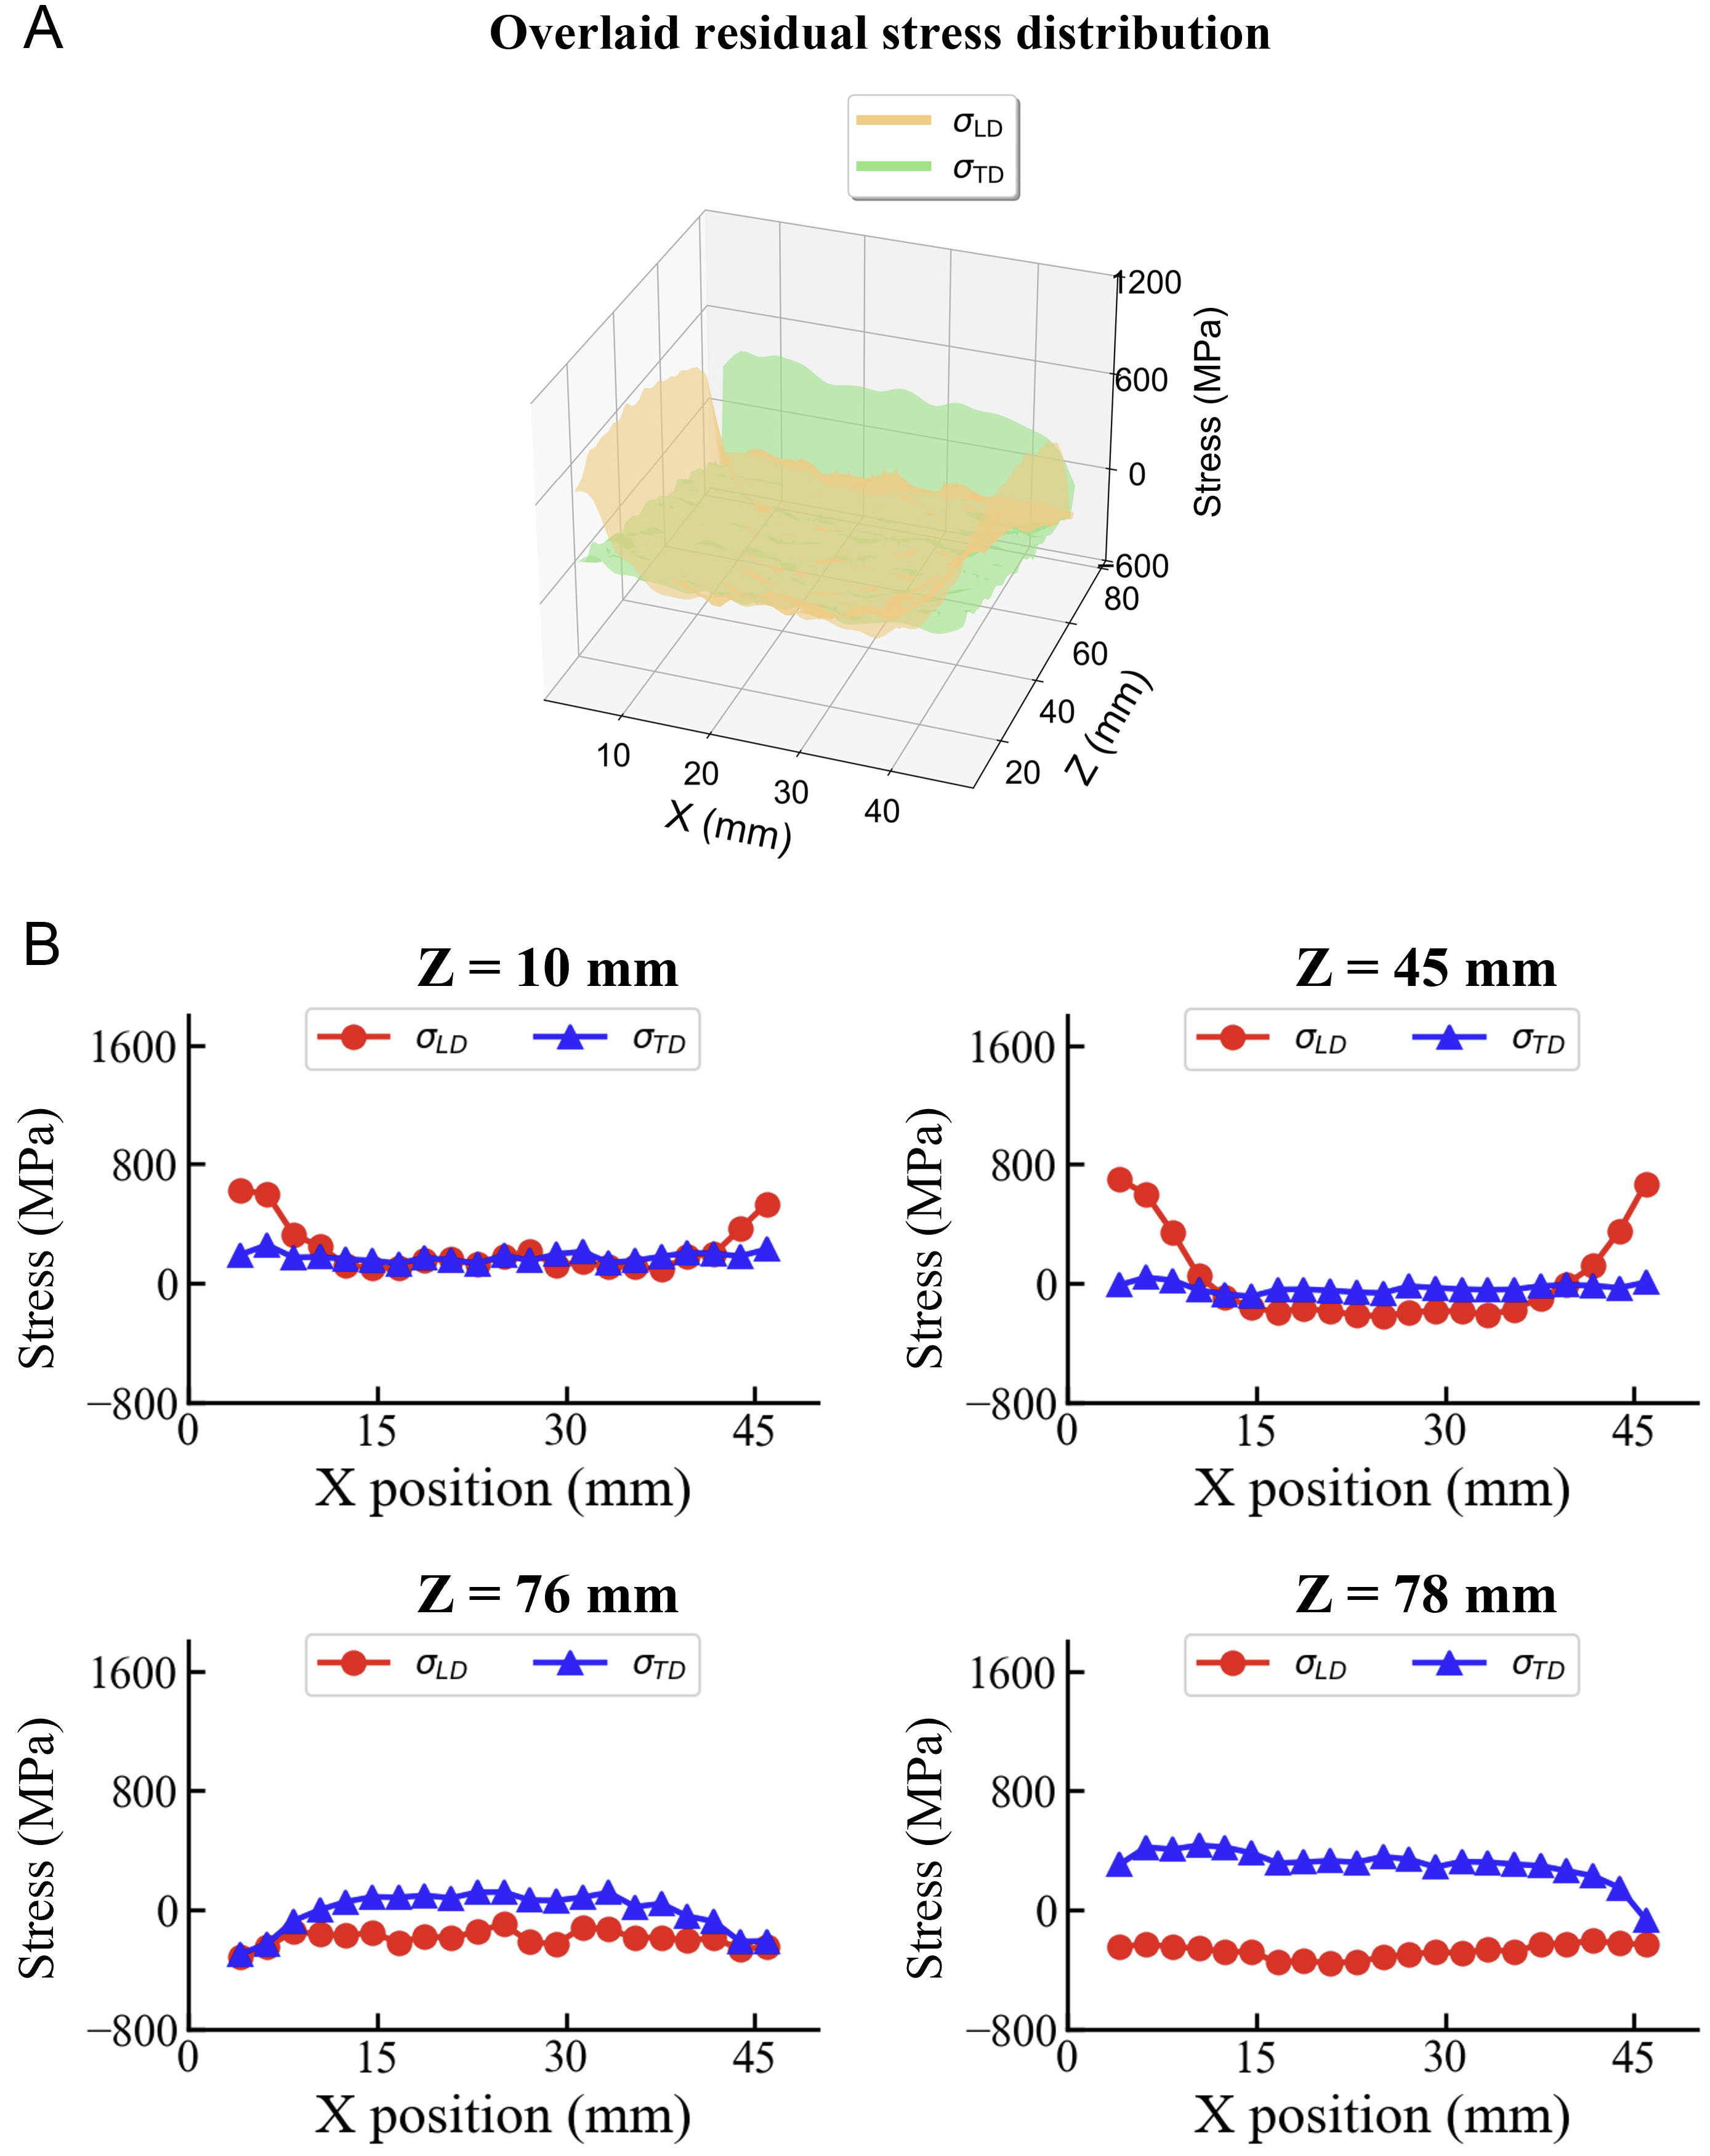
Figure 15. (A) Overlaid residual stress distribution; (B) corresponding residual stress variation along the X-axis at different Z-heights (Z = 10, 45, 76, and 78 mm) for the LD and TD. LD: Loading direction; TD: transverse direction.
Figure 15 provides quantitative proof of stress evolution. By comparing the distribution at different Z positions from bottom (Z = 10mm) to top (Z = 78 mm), the LD direction experiences a transition from “U-shape” tensile residual stress to compressive residual stress. In the LD profile, residual stress reaches a maximum of +791 MPa at the lateral edges. Accounting for the TD residual stress, the von Mises equivalent stress[41] at this location is slightly lower than 791 MPa. This measured LD residual stress peak exceeds the macroscopic yield strength of 646 MPa because the latter represents an average value over the bulk material, whereas the local yield strength may be higher. To balance the edges, the core region reaches approximately -355 MPa. The TD residual stress peak is +436 MPa.
Physical mechanisms of stress formation
To elucidate the physical origin of the measured residual stress fields, it is important to distinguish the static residual stress measured in this study from the dynamic thermomechanical mechanisms reported in the literature. Although our experimental data quantify the final solid-state stress equilibrium, the transient cyclic evolution underlying these characteristics is fundamentally governed by the temperature gradient mechanism (TGM), widely documented in prior LPBF research[11,42-44]. As inferred from these theoretical models and conceptually illustrated in Figure 16A, during the localized heating and deposition stage, the newly deposited (n+1) layer is heated to a high temperature and attempts to undergo massive thermal expansion (εthermal > 0). However, the underlying cooler (n) layers (or the substrate) constrain this free expansion, inducing irreversible compressive deformation within the (n + 1) layer (εplastic < 0)[11]. As shown in Figure 16B, the TGM framework indicates that this constrained thermal expansion induces a downward “push” effect at the edges. Subsequently, during the bulk cooling stage as illustrated in Figure 16C, the hindered thermal shrinkage of this plastically shortened layer forces a dramatic stress transition into severe tension (εelastic > 0)[11]. The extreme boundary tensile stresses and compensating internal compressions, directly captured in our spatial mapping in Figure 16D, provide macroscale validations of the cumulative structural equilibrium dictated by these theoretical layer-by-layer thermal cycling models.
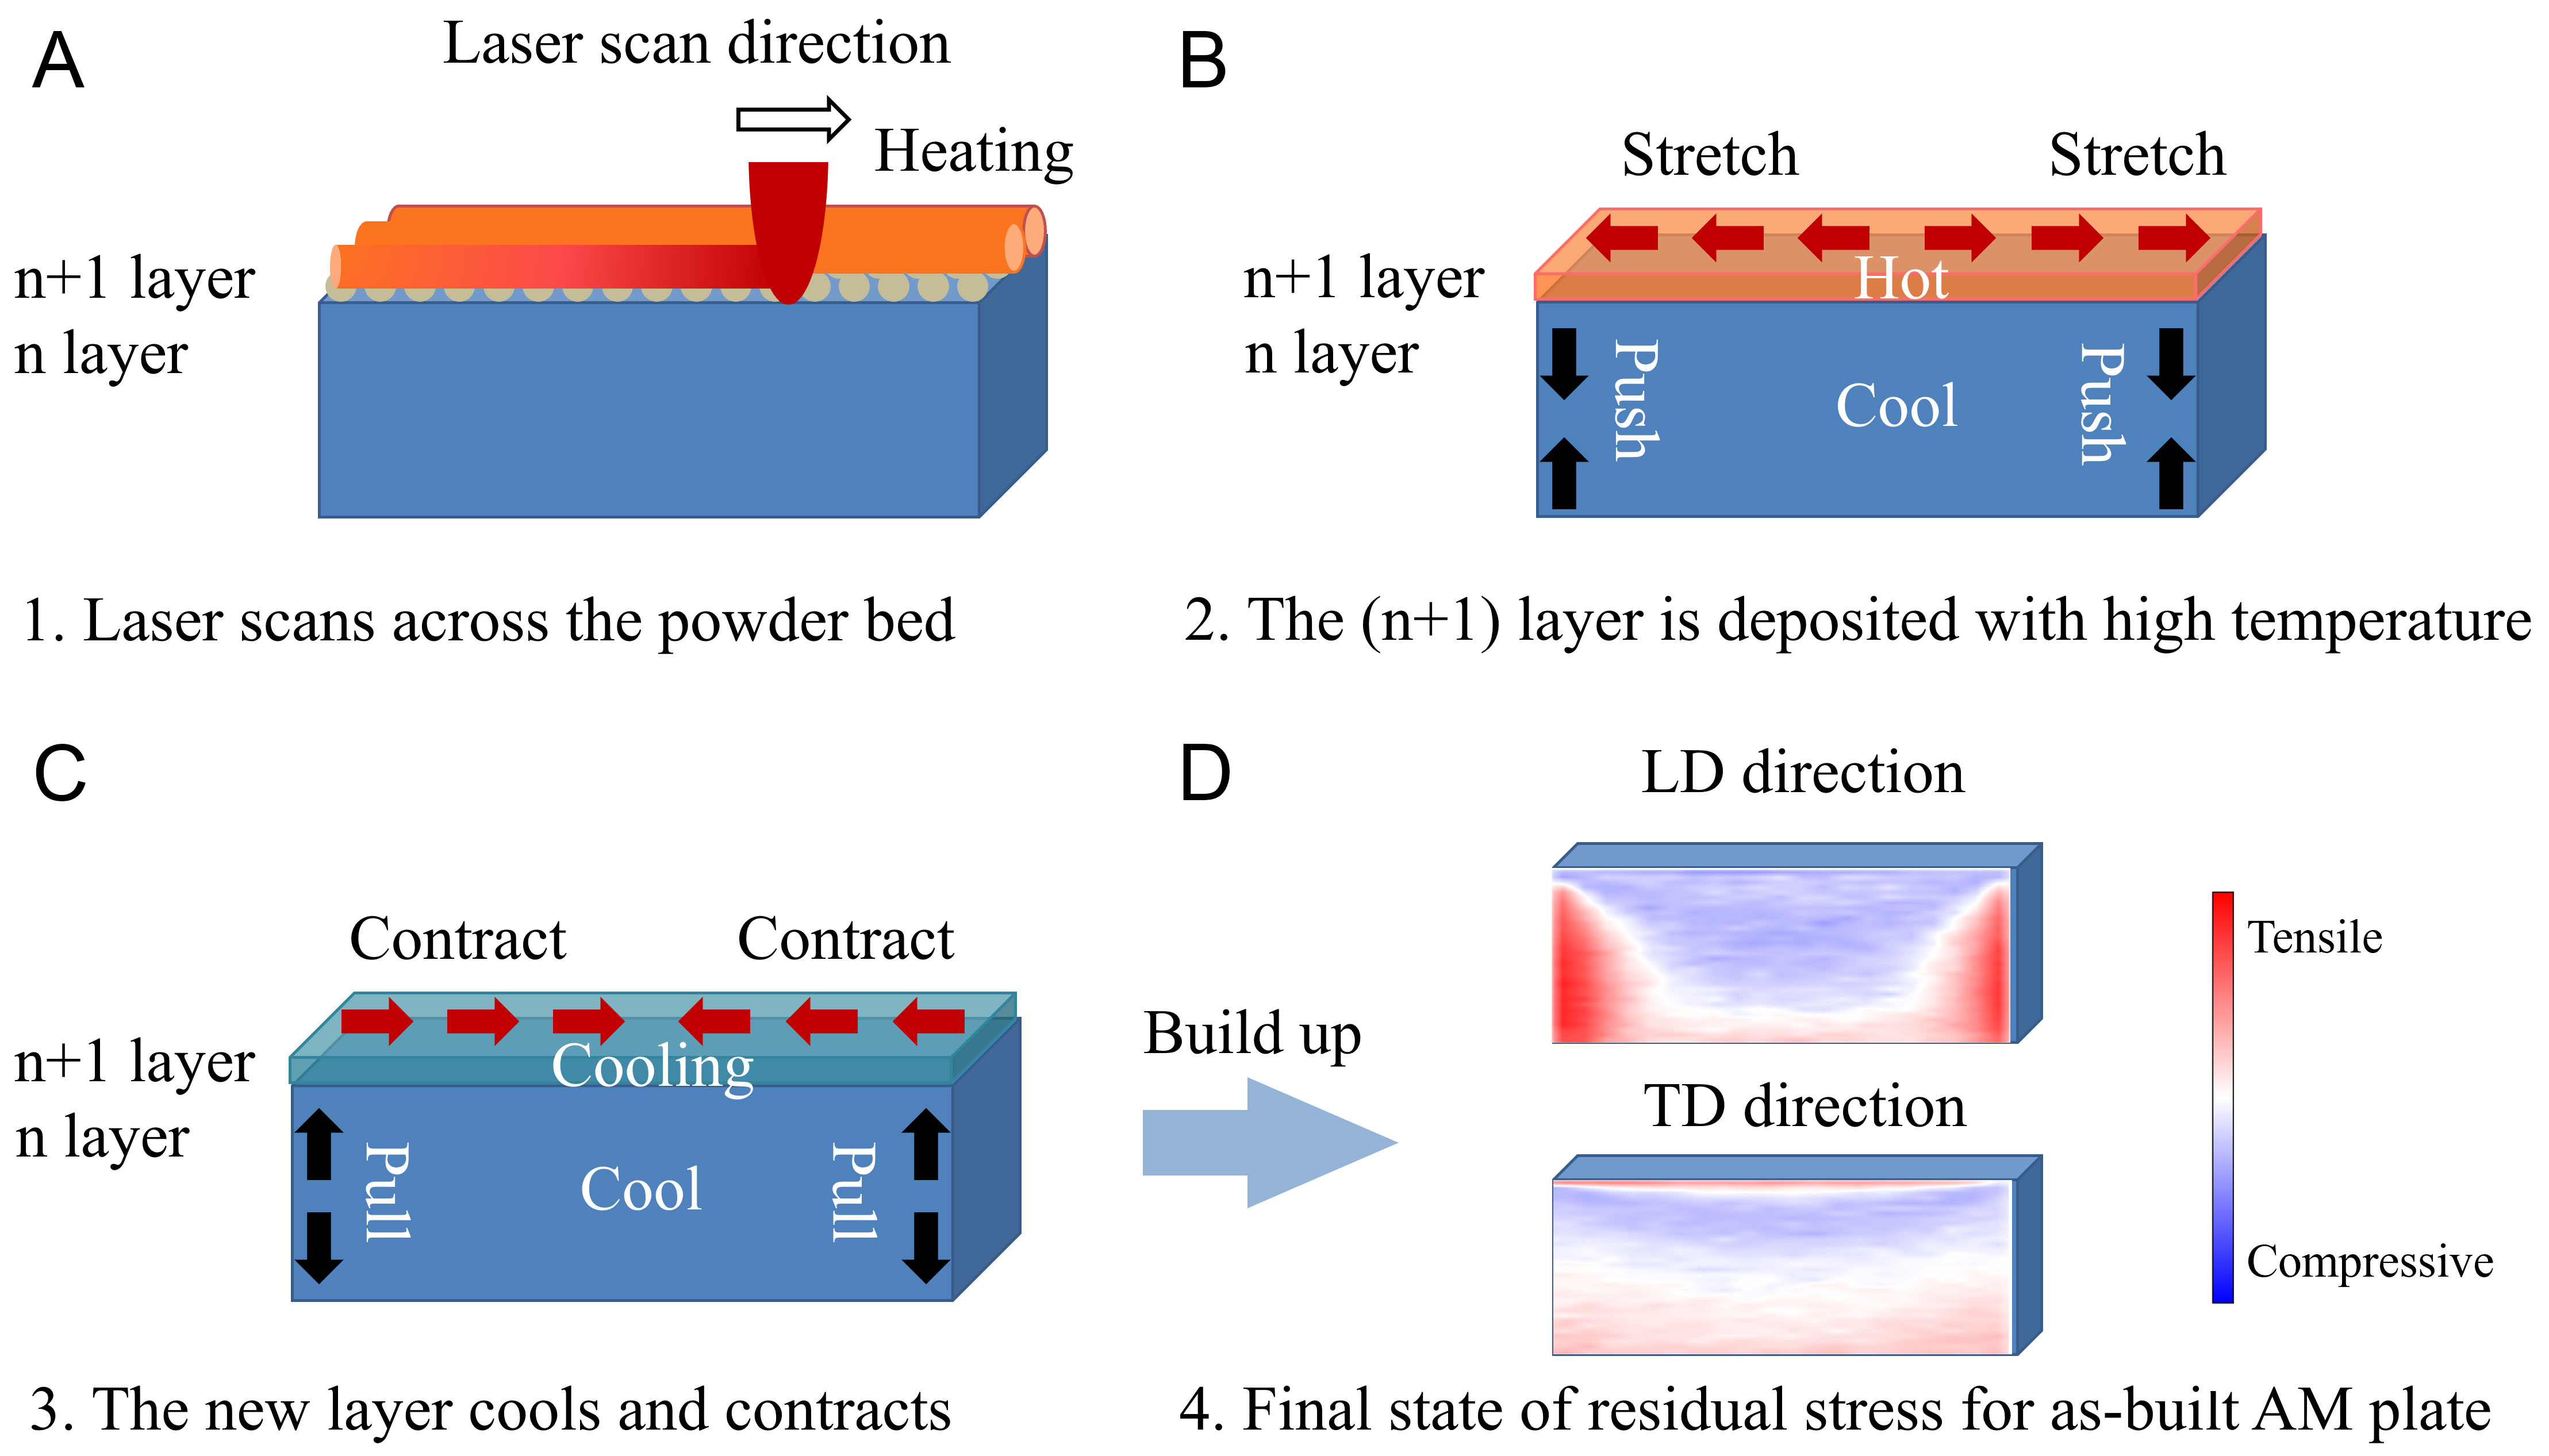
Figure 16. Formation mechanism of residual stress: (A) powder spreading for the new building layer; (B) a laser scans across the powder bed, inducing localized heating, while the underlying substrate undergoes cooling; (C) the newly deposited layer (n + 1) cools and contracts, resulting in upward pulling forces on the underlying layers; (D) final state residual stress distribution after AM processing. In (B and C), the red arrows denote thermal strain direction, while the black arrows denote elastic strain direction. LD: Loading direction; TD: transverse direction; AM: additive manufacturing.
CONCLUSIONS
This work systematically characterized the macroscopic two-dimensional in-plane residual stress components of an LPBF-fabricated IN718 plate using high-energy synchrotron X-ray diffraction. Four main conclusions are drawn from the experimental findings.
(1) Methodological cross-verification demonstrates that the Pseudo-Voigt profile provides the best fitting performance for capturing the diffraction peaks in textured LPBF microstructures, effectively constraining spatial stress calculation uncertainty below 15.3 MPa.
(2) Macroscopic spatial mapping reveals a pronounced “core compression, edge tension” residual stress equilibrium, in which an internal compressive core (down to -355 MPa) counterbalances extreme tensile gradients concentrated at the component peripheries.
(3) The quantitative residual stress distributions exhibit pronounced directional anisotropy, with the LD strictly governing the principal residual stress field and producing boundary tensile concentrations up to +791 MPa, which markedly exceed those measured in the TD (up to +436 MPa).
(4) The static spatial mapping provides direct macroscopic evidence of TGM-based thermomechanical evolution, objectively confirming that the extreme tensile states at lateral geometric boundaries represent critical high-risk regions for stress-induced deformation and mechanical degradation of LPBF IN718 components.
DECLARATIONS
Acknowledgment
The 3W1 beamline of the Beijing Synchrotron Radiation Facility is greatly acknowledged.
Authors’ contributions
Conceptualization: Sun, M.; Zhang, X.
Data curation: Sun, M.; Zhu, C.
Formal analysis: Sun, M.
Methodology: Sun, M.; Zhang, X.
Investigation: Sun, M.; Zhu, C.; Zhang, X.
Visualization: Sun, M.
Writing - original draft: Sun, M.; Zhu, C.
Writing - review & editing: Sun, M.; Yang, L.; Zhang, X.
Project administration: Yang, L.; Zhang, X.
Funding acquisition: Yang, L.; Zhang, X.
All authors have read and agreed to the published version of this manuscript.
Availability of data and materials
The original contributions presented in this study are included in the article. Further inquiries can be directed to the corresponding authors.
Financial support and sponsorship
The authors gratefully acknowledge support from the National Natural Science Foundation of China under Grant No. 12475353. This work was also supported by the National Key Research and Development Program of China (No. 2022YFB3707104) and the Beijing Nova Program (No. 20240484534).
Conflicts of interest
Sun, M. is affiliated with Sinochem Digital Intelligence Technology Co., Ltd. The other authors declare that they have no conflicts of interest.
AI and AI-assisted tools statement
During the preparation of this manuscript, the AI tool Doubao (Seed 2.0, released 2026-02-14) was used solely for language editing. The tool did not influence the study design, data collection, analysis, interpretation, or the scientific content of the work. All authors take full responsibility for the accuracy, integrity, and final content of the manuscript.
Ethical approval and consent to participate
Not applicable.
Consent for publication
Not applicable.
Copyright
© The Author(s) 2026.
REFERENCES
1. Debroy, T.; Wei, H.; Zuback, J.; et al. Additive manufacturing of metallic components - process, structure and properties. Prog. Mater. Sci. 2018, 92, 112-224.
2. Kumar, M. D. B.; Manikandan, M. Evaluation of microstructure, residual stress, and mechanical properties in different planes of wire + arc additive manufactured nickel-based superalloy. Met. Mater. Int. 2022, 28, 3033-56.
3. Thompson, S. M.; Bian, L.; Shamsaei, N.; Yadollahi, A. An overview of direct laser deposition for additive manufacturing; Part I: transport phenomena, modeling and diagnostics. Addit. Manuf. 2015, 8, 36-62.
4. Singla, A. K.; Banerjee, M.; Sharma, A.; et al. Selective laser melting of Ti6Al4V alloy: process parameters, defects and post-treatments. J. Manuf. Process. 2021, 64, 161-87.
5. Dong, B.; Wang, Z.; Zhu, H.; et al. Low neutron cross-section FeCrVTiNi based high-entropy alloys: design, additive manufacturing and characterization. Microstructures 2022, 2, 2022003.
6. Huang, D.; Dong, Y.; Chen, H.; Zhou, Y.; Zhang, M.; Yan, M. Effects of processing parameters on a β-solidifying TiAl alloy fabricated by laser-based additive manufacturing. Microstructures 2022, 2, 19.
7. Vrancken, B.; Thijs, L.; Kruth, J.; Van, Humbeeck. J. Heat treatment of Ti6Al4V produced by selective laser melting: microstructure and mechanical properties. J. Alloy. Compd. 2012, 541, 177-85.
8. Yadroitsev, I.; Krakhmalev, P.; Yadroitsava, I. Selective laser melting of Ti6Al4V alloy for biomedical applications: Temperature monitoring and microstructural evolution. J. Alloy. Compd. 2014, 583, 404-9.
9. Guo, C.; Li, G.; Li, S.; et al. Additive manufacturing of Ni-based superalloys: residual stress, mechanisms of crack formation and strategies for crack inhibition. Nano. Mater. Sci. 2023, 5, 53-77.
10. Wang, Q.; Zhao, H.; Hu, B.; et al. Recrystallization behavior of a high γ′-fraction Ni-based single crystal superalloy induced by residual strain. Mater. Des. 2024, 244, 113200.
11. Li, C.; Liu, Z.; Fang, X.; Guo, Y. Residual stress in metal additive manufacturing. Procedia. CIRP. 2018, 71, 348-53.
12. Sames, W. J.; List, F. A.; Pannala, S.; Dehoff, R. R.; Babu, S. S. The metallurgy and processing science of metal additive manufacturing. Int. Mater. Rev. 2016, 61, 315-60.
13. Mercelis, P.; Kruth, J. Residual stresses in selective laser sintering and selective laser melting. Rapid. Prototyp. J. 2006, 12, 254-65.
14. Kruth, J.; Froyen, L.; Van, Vaerenbergh. J.; Mercelis, P.; Rombouts, M.; Lauwers, B. Selective laser melting of iron-based powder. J. Mater. Process. Tech. 2004, 149, 616-22.
15. Zhang, D.; Niu, W.; Cao, X.; Liu, Z. Effect of standard heat treatment on the microstructure and mechanical properties of selective laser melting manufactured Inconel 718 superalloy. Mat. Sci. Eng. A-Struct. 2015, 644, 32-40.
16. Webster, G.; Ezeilo, A. Residual stress distributions and their influence on fatigue lifetimes. Int. J. Fatigue. 2001, 23, 375-83.
17. John, R. Residual stress effects on near-threshold fatigue crack growth in friction stir welds in aerospace alloys. Int. J. Fatigue. 2003, 25, 939-48.
18. Withers, P.; Bhadeshia, H. Residual stress. Part 1 - measurement techniques. Mater. Sci. Technol. 2001, 17, 355-65.
19. Rossini, N.; Dassisti, M.; Benyounis, K.; Olabi, A. Methods of measuring residual stresses in components. Mater. Design. 2012, 35, 572-88.
20. Uzun, F.; Slim, M. F.; Basoalto, H.; Liogas, K.; Wang, Z. I.; Korsunsky, A. M. Application of strain tomography and contour method to residual stress analysis in additively manufactured CM247LC superalloy parts. Prog. Addit. Manuf. 2025, 10, 8279-91.
22. Zhang, W.; Guo, D.; Wang, L.; et al. X-ray diffraction measurements and computational prediction of residual stress mitigation scanning strategies in powder bed fusion additive manufacturing. Addit. Manuf. 2023, 61, 103275.
23. Chuang, A. C.; Park, J.; Shade, P. A.; Schwalbach, E. J.; Groeber, M. A.; Musinski, W. D. AFRL additive manufacturing modeling series: challenge 1, characterization of residual strain distribution in additively-manufactured metal parts using energy-dispersive diffraction. Integr. Mater. Manuf. Innov. 2021, 10, 525-41.
24. Parry, L.; Ashcroft, I.; Wildman, R. Understanding the effect of laser scan strategy on residual stress in selective laser melting through thermo-mechanical simulation. Addit. Manuf. 2016, 12, 1-15.
25. Huang, X.; He, L.; Cao, Y. Numerical simulation and experiments for the microstructure and mechanical properties of Ni-based superalloys fabricated using directed energy deposition (DED). Opt. Laser. Technol. 2024, 177, 111161.
26. Malmelöv, A.; Hassila, C.; Fisk, M.; Wiklund, U.; Lundbäck, A. Numerical modeling and synchrotron diffraction measurements of residual stresses in laser powder bed fusion manufactured alloy 625. Mater. Design. 2022, 216, 110548.
27. Withers, P.; Bhadeshia, H. Residual stress. Part 2 - nature and origins. Mater. Sci. Technol. 2001, 17, 366-75.
28. Cox, M. E.; Schwalbach, E. J.; Blaiszik, B. J.; Groeber, M. A. AFRL Additive manufacturing modeling challenge series: overview. Integr. Mater. Manuf. Innov. 2021, 10, 125-8.
29. Zhang, X.; Lutz, A.; Andrä, H.; et al. Evolution of microscopic strains, stresses, and dislocation density during in-situ tensile loading of additively manufactured AlSi10Mg alloy. Int. J. Plast. 2021, 139, 102946.
30. Wang, X.; Gong, X.; Chou, K. Review on powder-bed laser additive manufacturing of Inconel 718 parts. P. I. Mech. Eng. B-J. Eng. 2017, 231, 1890-903.
31. Liu, S.; Shin, Y. C. Additive manufacturing of Ti6Al4V alloy: a review. Mater. Design. 2019, 164, 107552.
32. Murr, L. E.; Martinez, E.; Hernandez, J.; et al. Microstructures and properties of 17-4 PH stainless steel fabricated by selective laser melting. J. Mater. Res. Technol. 2012, 1, 167-77.
33. Prevey, P. S. The Use of Person VII distribution functions in X-ray diffraction residual stress measurement. Adv. X-ray. Anal. 1985, 29, 103-11.
34. Haribabu, G. N.; Canelo-Yubero, D.; Maawad, E.; et al. Benchmark sample design for the validation of residual stress measurements by diffraction: insights and practicalities. Integr. Mater. Manuf. Innov. 2024, 13, 955-68.
35. Ioannidou, C.; König, H.; Semjatov, N.; et al. In-situ synchrotron X-ray analysis of metal additive manufacturing: current state, opportunities and challenges. Mater. Design. 2022, 219, 110790.
36. Lindberg, F.; Ryde, L.; Brask, J.; Hörnström, S. E.; Östberg, J.; Müller, T. Stress mapping on ultrahigh strength steel cut edges. Adv. Eng. Mater. 2021, 23, 2001168.
37. Young, R. A.; Wiles, D. B. Profile shape functions in Rietveld refinements. J. Appl. Crystallogr. 1982, 15, 430-8.
38. Schröder, J.; Heldmann, A.; Hofmann, M.; Evans, A.; Petry, W.; Bruno, G. Determination of diffraction and single-crystal elastic constants of laser powder bed fused Inconel 718. Mater. Lett. 2023, 353, 135305.
39. Wilson, C.; Veeravalli, V. V.; Nedic, A. Adaptive sequential stochastic optimization. IEEE. Trans. Automat. Contr. 2019, 64, 496-509.
40. Daymond, M. R. The determination of a continuum mechanics equivalent elastic strain from the analysis of multiple diffraction peaks. J. Appl. Phys. 2004, 96, 4263-72.
41. Yu, T.; Xue, P. Yield criteria. In Introduction to engineering plasticity, Elsevier, 2022; pp 67-87.
42. Zhao, L.; Santos, Macías. J. G.; Dolimont, A.; Simar, A.; Rivière-lorphèvre, E. Comparison of residual stresses obtained by the crack compliance method for parts produced by different metal additive manufacturing techniques and after friction stir processing. Addit. Manuf. 2020, 36, 101499.
43. Huang, H.; Wang, Y.; Chen, J.; Feng, Z. An efficient numerical model for predicting residual stress and strain in parts manufactured by laser powder bed fusion. J. Phys. Mater. 2021, 4, 044006.
Cite This Article
 Open Access
How to Cite
Download Citation
Export Citation File:
Type of Import
Tips on Downloading Citation
Citation Manager File Format
Type of Import
Direct Import: When the Direct Import option is selected (the default state), a dialogue box will give you the option to Save or Open the downloaded citation data. Choosing Open will either launch your citation manager or give you a choice of applications with which to use the metadata. The Save option saves the file locally for later use.
Indirect Import: When the Indirect Import option is selected, the metadata is displayed and may be copied and pasted as needed.
About This Article
Copyright

Data & Comments
Data
0










Comments
Comments must be written in English. Spam, offensive content, impersonation, and private information will not be permitted. If any comment is reported and identified as inappropriate content by OAE staff, the comment will be removed without notice. If you have any queries or need any help, please contact us at [email protected].