


Knowledge-enabled data-driven smart design of ultra-strong ductile near-α titanium alloys under extreme conditions
 0
0 Abstract
Under extreme service conditions, adiabatic shear banding critically limits the performance of titanium alloys in warhead applications, creating an urgent demand for strategies to achieve strength-ductility synergy. In this work, a knowledge-enabled data-driven multi-objective optimization framework is proposed to investigate the composition of near-α titanium alloys under high strain rates. By integrating domain knowledge with twelve machine learning models, key performance parameters (KPPs) governing strength are identified through feature engineering, including strain rate, Fermi energy, and phase formation parameters, while ductility is controlled by the KPPs of strain rate, bulk/shear modulus (B/G) ratio, and mixing enthalpy. Using a gradient boosting regression tree model for strength prediction [test the coefficient of determination (R2) = 0.91] and a random forest model for ductility prediction (test R2 = 0.82), the nondominated sorting genetic algorithm II (NSGA-II) is integrated to identify 14 Pareto-optimal alloys from a pool of 200,000 candidate compositions of near-α titanium alloys (Ti-Al-V-Mo-Zr-Sn system). A breakthrough combination of 1,600 MPa dynamic compressive strength and 26% ductility at a strain rate of
Keywords
INTRODUCTION
Titanium alloys, characterized by low density, high specific strength, excellent ductility, and corrosion resistance, are regarded as ideal structural materials under impact loading[1-5]. However, due to their low thermal conductivity, titanium alloys are prone to thermoplastic instability under high-speed impact, exhibiting high adiabatic sensitivity and a tendency to form adiabatic shear bands (ASBs). The non-uniform deformation and stress concentration between these bands and the matrix accelerate crack propagation, ultimately leading to material failure[6-12]. Improving the strength-ductility balance of titanium alloys has been considered a potential strategy to improve stress-strain behavior, reduce adiabatic shear sensitivity, and enhance impact resistance[4]. Near α-titanium alloys, which benefit from multi-scale synergistic energy dissipation mechanisms and high-temperature stability, have been regarded as ideal impact-resistant materials[13-16]. However, current research lacks comprehensive and systematic development of near α-titanium alloys, particularly for high-speed impact applications[17]. Therefore, it is essential to develop efficient methods for producing high-performance near-α titanium alloys suitable for extreme conditions.
The design of composition and microstructure is critical for balancing the strength and toughness of titanium alloys under extreme impact conditions. Traditional theoretical strategies, such as those grounded in molybdenum equivalence and d-electron theory (Bo-Md method), have successfully guided the development of various high-performance alloys[18-20]. However, these approaches rely heavily on costly “trial-and-error” processes and frequently suffer from limited predictive accuracy when dealing with complex multi-element interactions due to the scarcity of comprehensive statistical data[21,22].
To overcome these limitations, data-driven machine learning (ML) has emerged as a transformative approach for mapping complex nonlinear relationships among composition, processing, and performance[23-35]. Recent studies have demonstrated that ensemble learning frameworks, such as support vector machine (SVM) and random forest (RF), can significantly enhance prediction accuracy for mechanical properties and fatigue life, particularly when physical features such as electron work function (EWF) are incorporated[36-42]. Despite these advancements, current ML applications often focus on single-target prediction or operate as “black boxes” lacking physical interpretability. Furthermore, effectively integrating domain knowledge with multi-objective evolutionary algorithms to systematically resolve the trade-off between strength and ductility remains a significant challenge[43-49].
In this work, a multi-objective genetic optimization algorithm framework based on the nondominated sorting genetic algorithm II (NSGA-II) is proposed to efficiently design near-α titanium alloys with excellent strength-ductility synergy and high resistance to adiabatic shear under high-strain-rate conditions. By employing a knowledge-enabled feature engineering approach, the key parameters influencing the strength and ductility of titanium alloys are identified. The optimal ML model is selected through comparative evaluation and integrated into the multi-objective optimization framework. Combined with constitutive modeling and phase diagram calculations, this approach enables the design of near α-titanium alloys that meet target performance requirements. The proposed method can rapidly generate and screen titanium alloy compositions that simultaneously exhibit high strength and ductility under extreme strain conditions, providing an innovative pathway for the accelerated design of titanium alloys for extreme environments.
MATERIALS AND METHODS
A knowledge-enabled data-driven multi-objective optimization framework
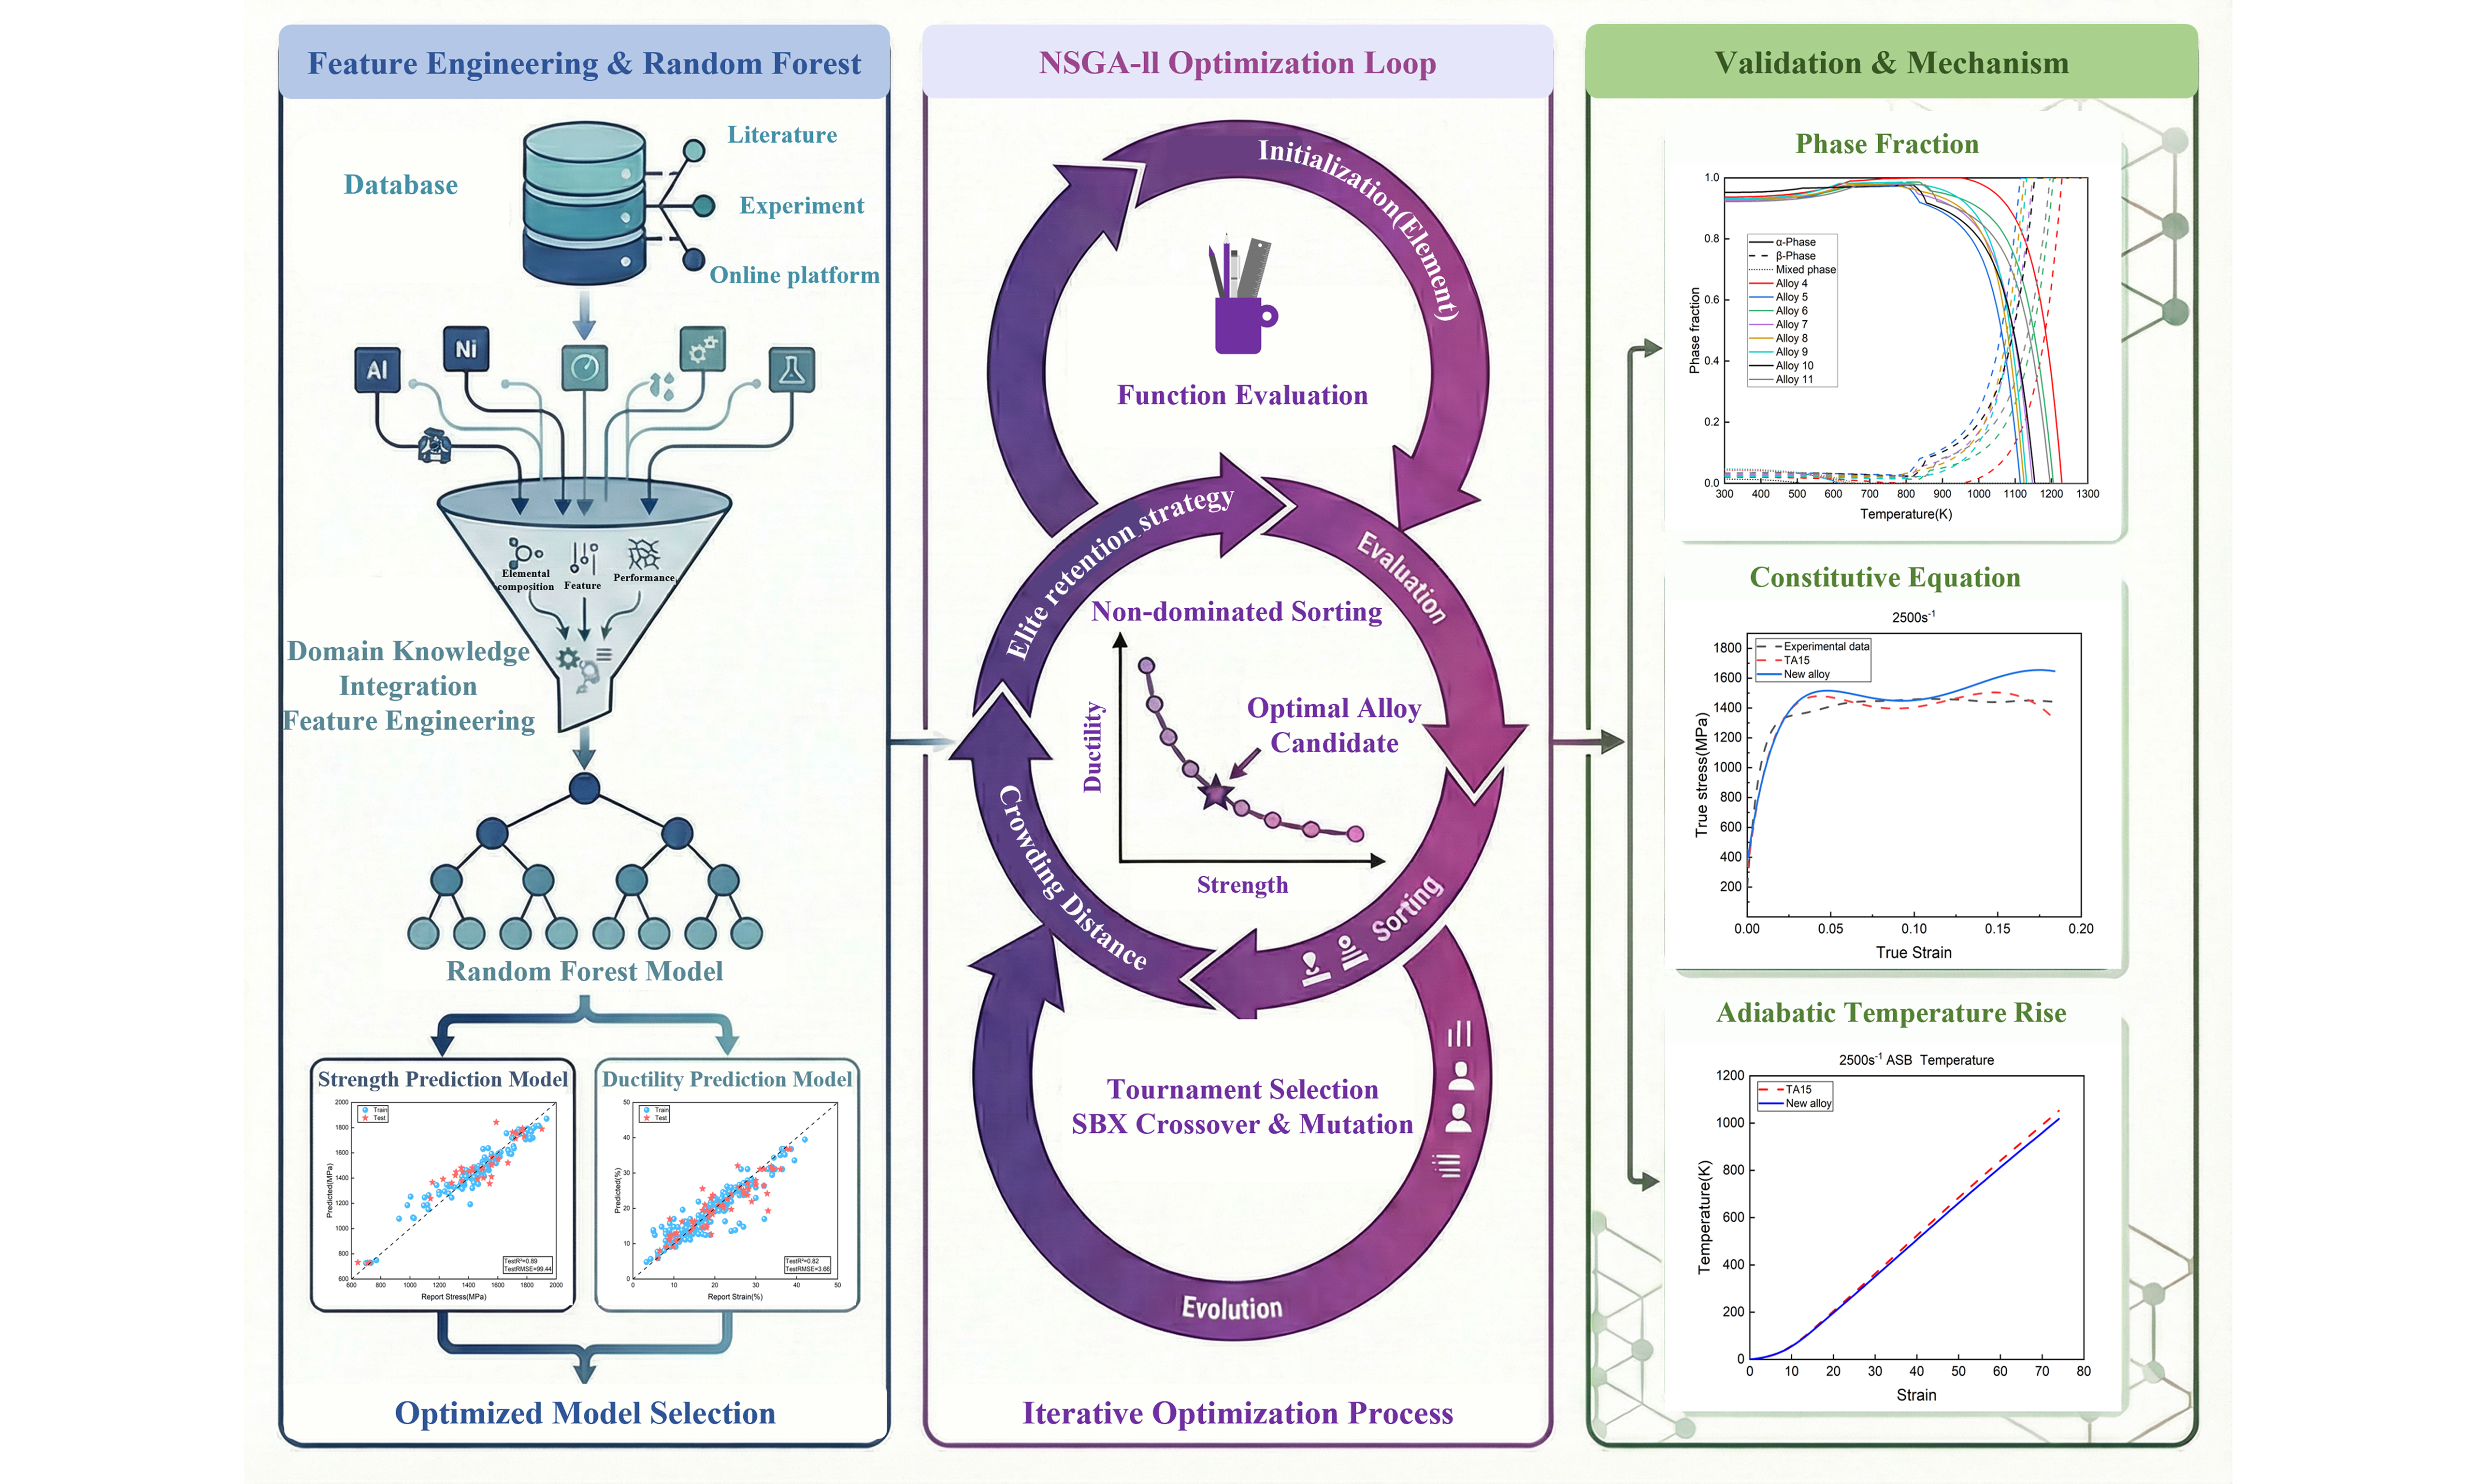
This work aims to establish a domain-knowledge-enhanced data-driven multi-objective optimization framework for the design of titanium alloys under extreme conditions. Here, “domain knowledge” refers to the use of physically motivated descriptors and metallurgical constraints in both feature construction and optimization, rather than purely empirical feature selection. The research roadmap is illustrated in Figure 1. First, a mechanical property database is established, encompassing 10 alloying elements, strain rate, dynamic compressive strength, and fracture strain. All data in this work are either derived from or correspond to high-strain-rate impact loading conditions. Meanwhile, a material feature pool is constructed, including intrinsic physical properties, electronic and surface characteristics, mechanical properties, and structural features. Based on this feature pool, key feature parameters influencing the strength and ductility of titanium alloys are identified by employing correlation analysis, feature importance analysis, and feature subset search methods. Second, by evaluating twelve ML models, the optimal models for strength and ductility prediction tasks are identified to validate the fitting performance of the selected key feature parameters. By coupling composition with these key feature parameters, the optimal ML models for strength and ductility are combined with multi-objective optimization algorithms to design near α-titanium alloys satisfying [Mo]eq ≤ 2.5 and [Al]eq ≤ 8.5. Finally, the titanium alloys within the designed Pareto front subset are validated by using constitutive equations and thermodynamic calculations via Thermo-Calc to demonstrate the application potential of the new alloys.
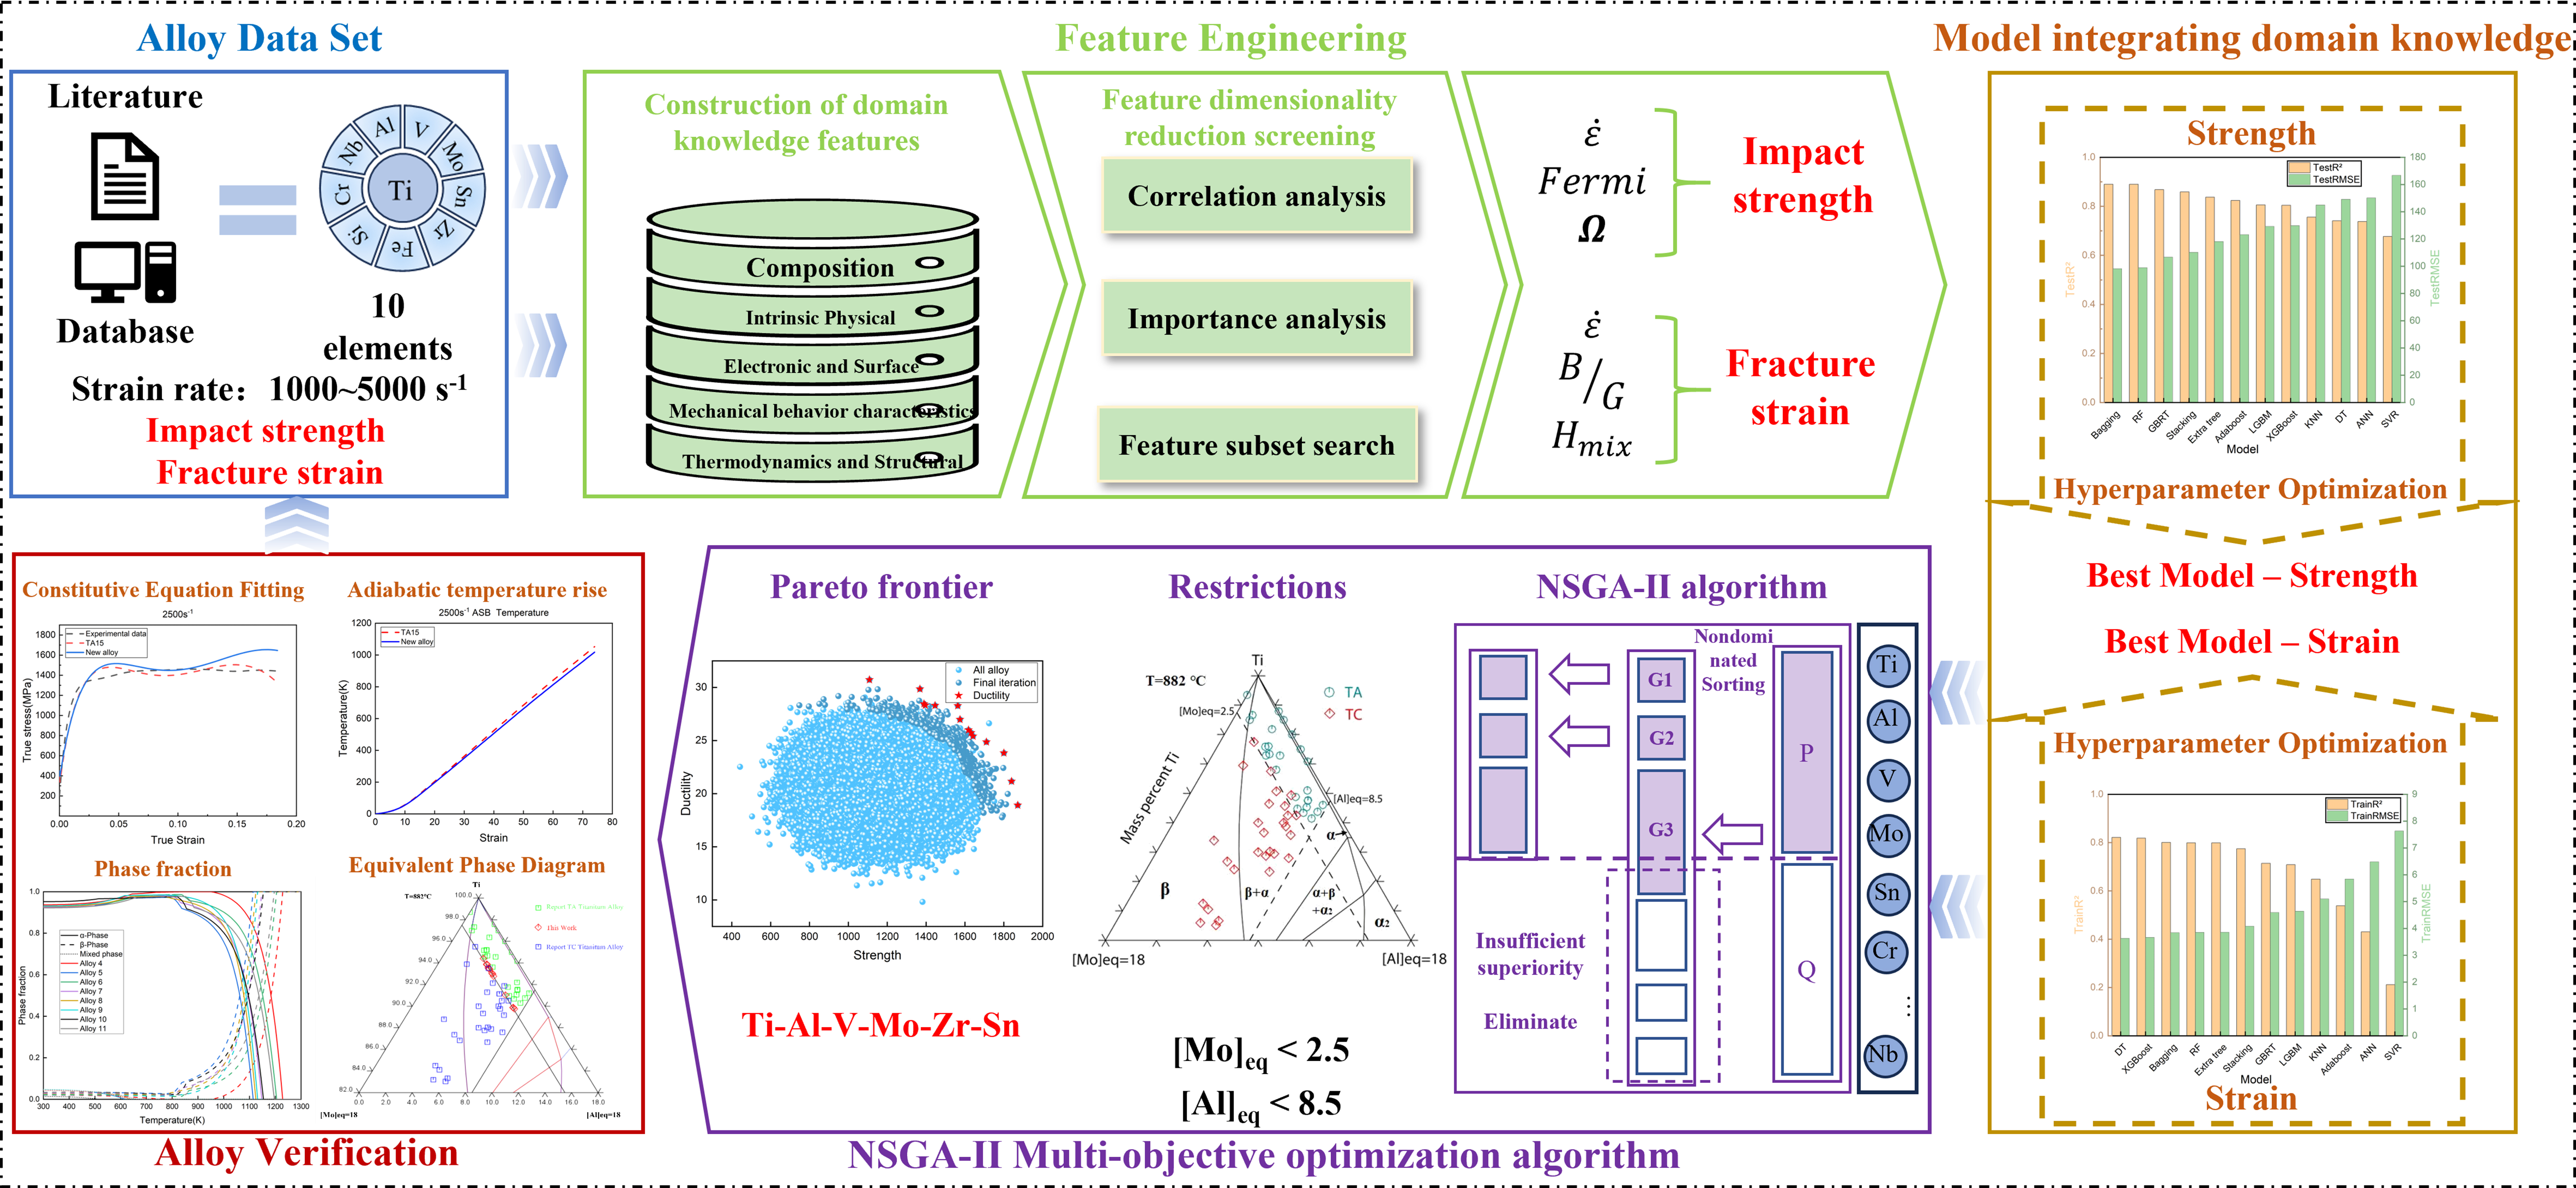
Figure 1. Roadmap of knowledge-enabled data-driven smart design of ultra-strong ductile near-α titanium alloys under extreme conditions. R2: The coefficient of determination; RMSE: root mean square error; Bagging: bootstrap aggregating; RF: random forest; GBRT: gradient boosting regression tree; ExtraTree: extremely randomized tree; AdaBoost: adaptive boosting; LGBM: light gradient boosting machine; XGBoost: eXtreme gradient boosting; KNN: K-nearest neighbor; DT: decision tree; ANN: artificial neural network; SVR: support vector regression; NSGA-II: nondominated sorting genetic algorithm II; TA: titanium alpha; TC: titanium composite; ASB: adiabatic shear band.
Analyze the database and determine key characteristic parameters
Due to the substantial diversity and compositional complexity of titanium alloys, available datasets are often limited in scope, leading to underrepresentation of critical performance features and hindering the accurate development of ML models[50,51]. To overcome this limitation, a comprehensive database of titanium alloy mechanical properties was established, comprising 175 data points for dynamic compressive strength and 312 data points for ductility, primarily recording the maximum dynamic compressive strength and maximum impact fracture strain. To capture intrinsic material characteristics and underlying mechanisms, raw experimental data were transformed through feature engineering into physically meaningful descriptors, enhancing both model accuracy and interpretability[52-54].
In line with previously reported works[55], the present work proposes 17 feature descriptors related to alloy design, electronic structure, surface characteristics, and thermodynamic stability, which can influence alloy performance [Table 1]. Some of the features were obtained from material constitutive equations [Table 2]. Atomic size difference can serve as an indicator for quantifying the degree of lattice distortion[56]. Mixed enthalpy (ΔHmix), mixed entropy (ΔSmix), and valence electron concentration (VEC) can predict the formation of solid solutions or phase stability[57]. The presence of ΔHmix and ΔSmix has been shown to promote the formation of single-phase solid solutions, inhibit the precipitation of intermetallic compounds, and enhance solid solution strengthening effects[58]. The shear modulus (G) represents a material’s resistance to shear deformation, while the elastic modulus (E) indicates resistance to tensile or compressive deformation during the elastic deformation stage. The bulk modulus (K) reflects resistance to uniform compressive deformation. These three moduli serve as fundamental parameters for mechanical properties, collectively describing the elastic response under various loading conditions. The equivalent molar fractions [Mo]eq and [Al]eq quantify the contribution of β/α-stabilizing elements to the strength of titanium alloys[59]. The introduction of EWF is intended to reflect differences in bond strength and electronic states among different atoms[60]. It has been reported that EWF significantly affects the yield strength of titanium alloy materials[37]. The electron density at the Fermi level has been confirmed by first-principles calculations as the core electronic structure parameter that simultaneously governs both strength and ductility[61]. The bulk/shear modulus (B/G) ratio determines the strength-ductility trade-off: values below 1.71 indicate strength dominance, while values above 1.71 indicate ductility predominance[62,63]. The Poisson ratio (v) is defined as the negative ratio of transverse strain to axial strain under uniaxial tension or compression. Materials with a higher Poisson ratio facilitate stress release through shear mechanisms during deformation, thereby enhancing ductility[64]. In addition, as shown in Table 1, some descriptors can be directly calculated from atomic percentages. The composition-weighted descriptors are defined as the atomic percentages (at%) of ten elements, namely Ti, Al, V, Mo, Zr, Fe, Si, Sn, Nb, and Cr, and can be expressed as Equation (1)[65]:
Calculation formulas and classification of 17 characteristic parameters of titanium alloys
| Feature | Formula of calculation | Abbreviation | Classification |
| Density | ρ | Intrinsic physical properties | |
| Melting point | Tm | ||
| Elastic modulus | E | ||
| Shear modulus | G | ||
| Volume modulus | B | ||
| Chemical potential | μ | Electronic and surface properties | |
| Electron work function | EWF 6 | ||
| Fermi level | Fermi | ||
| Pugh parameter | B/G | Mechanical behavior characteristics | |
| Mo equivalent | [Mo]eq | ||
| Poisson’s ratio | v | ||
| Al equivalent | [Al]eq | ||
| Atomic size difference | δ | ||
| Valence electron concentration | VEC | Thermodynamics and structural properties | |
| Entropy of mixing | S_mix | ||
| Enthalpy of mixing | H_mix | ||
| Phase formation parameters | Ω |
Characteristic parameters derived from titanium alloy compositions based on physical models
| Model | Constitutive equation | ||
| J–C model[72,73] | Uniaxial stress at room temperature | Strain rate Melting point Tm Atomic size δ | |
| High strain rate at room temperature | |||
| JC-P4 model [70] | |||
| Z–A model[74] | BCC | ||
| KHL model[75] | Describe the mixture of nanocrystalline iron, copper, and titanium | ||
| Adsorption temperature rise [71] | Density ρ | ||
where Xi represents the property of a given constituent element, ci denotes its atomic percentage (at%), and n is the total number of alloying elements. For non-additive quantities (such as B/G), these are treated as heuristic indicators of overall ductility or brittleness trends. The usefulness of these descriptors is ultimately evaluated through feature selection and model performance rather than a priori assumptions.
To identify the most relevant descriptors for target properties, a three-stage feature selection methodology was implemented. First, mutual information (MI) and Pearson correlation analysis were combined to address both linear redundancy and nonlinear relevance. If a feature exhibited a Pearson correlation coefficient exceeding 0.8 [Equation (2)], high linear redundancy was inferred, and a priority ranking based on MI was employed to systematically eliminate low-MI features [Equation (3)][55]:
where r denotes the Pearson correlation coefficient, I represents mutual information, and corr(x, y) quantifies the linear relationship between descriptors x and y. The terms
To streamline feature selection, the second stage employs a RF regressor to evaluate feature importance. Each feature’s importance is quantified by its frequency of occurrence in node splitting and corresponding impurity reduction, measured by the Gini index. For each node in every decision tree (DT), the change in mean squared error (Δ_MSE) is computed and multiplied by the node’s sample proportion w (node samples/total training samples), as shown in Equation (4)[66]:
The total impurity reduction for each feature is aggregated across all nodes and trees, then normalized such that the sum of all feature importance scores equals 1 [Equation (5)][66]:
where p denotes the total number of features and j the index of the current feature. The scores were normalized so that their sum equaled unity, enabling the selection of features with cumulative importance greater than 0.9, which indicated a dominant contribution to property prediction.
After preliminary screening, features were further evaluated using an exhaustive wrapper method to identify the key subset that governs the strength and ductility of titanium alloys. Considering the distribution of features, categorical variables were label-encoded, and continuous features standardized via Z-score normalization. Since the type of target variable determines how the RF iteratively evaluates feature subsets, the predictive performance of each subset is consequently assessed via repeated training and validation. Based on these evaluations, the optimal subset is then selected to maximize the coefficient of determination (R2) while simultaneously minimizing root mean square error (RMSE) for property prediction.
Learning algorithm and optimization
According to the “No Free Lunch” (NFL) theorem, no ML algorithm is universally applicable to all situations. To systematically evaluate model applicability in predicting the strength of titanium alloys at high strain rates, this work implemented 12 ML algorithms. These include distance-based K-nearest neighbors (KNNs); kernel-based support vector regression (SVR); tree-based models such as DT and extremely randomized trees (ExtraTrees); ensemble methods including RF, bootstrap aggregating (Bagging), adaptive boosting (AdaBoost), gradient boosting regression trees (GBRT), eXtreme gradient boosting (XGBoost), light gradient boosting machine (LightGBM), and Stacking; as well as a neural network model (artificial neural network, ANN). R2 and RMSE were used to evaluate model performance.
During model construction, data preprocessing was performed. Data were imported from an Excel file, with the target variable y defined as the last column and the feature variables X as the remaining columns. Missing values and outliers were identified and processed. Data integrity and type distribution were assessed through missing value statistics, followed by descriptive statistical analysis to detect and remove abnormal data points. In the data partitioning stage, stratified sampling was employed. The standardized dataset was randomly split into a training set (80%) and a test set (20%), with a random seed of 55 for result reproducibility. This preprocessing procedure creates a standardized database for model training, enabling ML algorithms to achieve improved learning and generalization performance.
Equation (6) defines R2, which quantifies the proportion of variance in the dependent variable explained by the model. RMSE, defined in Equation (7), represents the standard deviation of prediction residuals; lower RMSE values indicate higher predictive accuracy. RMSE is also sensitive to extreme prediction deviations due to its disproportionate penalization of large errors[67].
Here, yi denotes the true value,
In ML, hyperparameters control the model structure and learning process. Even minor adjustments to these parameters can significantly affect the model’s prediction accuracy and generalization capabilities[68]. For the RF model, the parameter n_estimators defines the number of DTs; max_depth limits the maximum growth depth of each tree; min_samples_split specifies the minimum number of samples required for node splitting; and min_samples_leaf defines the minimum sample size required for leaf nodes. For GBRT, n_estimators determines the number of boosting iterations and model capacity. The learning rate, as a key regularization parameter, controls the step size of each iteration and works in conjunction with n_estimators - smaller learning rates require more trees, yielding more stable models with superior generalization. max_depth limits the complexity of individual weak learners by capping DT depth, ensuring gradual learning progression. min_samples_split acts as a node-level regularization constraint, preventing the model from learning noise by requiring a minimum number of samples for splitting. The main hyperparameters and their adopted values for the 12 ML models used in this work are summarized in Table 3. For model performance comparison, the hyperparameters of all models were set to their default values.
Summary of the main hyperparameters and their adopted values for 12 ML models
| Model | Hyperparameter | Parameter value |
| AdaBoost (decision tree regressor) | n_estimators | 100 |
| learning_rate | 1.0 | |
| max_depth | 3 | |
| min_samples_split | 2 | |
| min_samples_leaf | 1 | |
| ANN | hidden_layer_sizes | (100, 50) |
| alpha | 0.001 | |
| max_iter | 1000 | |
| Bagging | n_estimators | 100 |
| min_samples_split | 2 | |
| min_samples_leaf | 1 | |
| max_samples | 1 | |
| DT | min_samples_split | 2 |
| min_samples_leaf | 1 | |
| min_weight_fraction_leaf | 0 | |
| min_impurity_decrease | 0 | |
| Extra trees | min_samples_leaf | 1 |
| min_weight_fraction_leaf | 0 | |
| min_impurity_decrease | 0 | |
| ccp_alpha | 0 | |
| n_estimators | 100 | |
| max_depth | 10 | |
| min_samples_split | 2 | |
| GBRT | n_estimators | 100 |
| max_depth | 3 | |
| subsample | 1 | |
| learning_rate | 0.1 | |
| min_samples_split | 2 | |
| KNN | n_neighbors | 5 |
| leaf_size | 30 | |
| p | 2 | |
| LightGBM | num_leaves | 31 |
| max_depth | -1 | |
| learning_rate | 0.1 | |
| n_estimators | 100 | |
| subsample | 1 | |
| RF | max_depth | -1 |
| learning_rate | 0.1 | |
| n_estimators | 100 | |
| subsample | 1 | |
| min_samples_split | 2 | |
| min_samples_leaf | 1 | |
| Stacking | SVR-C | 1 |
| SVR-epsilon | 0.1 | |
| RF- n_estimators | 100 | |
| RF- max_depth | -1 | |
| RF- min_samples_split | 2 | |
| GBRT- learning_rate | 0.1 | |
| GBRT- max_depth | 3 | |
| GBRT- n_estimators | 100 | |
| SVR | C | 100 |
| gamma | 0.1 | |
| epsilon | 0.1 | |
| degree | 3 | |
| tol | 0.001 | |
| XGBoost | n_estimators | 100 |
| learning_rate | 0.3 | |
| max_depth | 6 | |
| min_child_weight | 1 | |
| subsample | 1 | |
| gamma | 0 |
Effective optimization of these hyperparameters balances model expressiveness and computational efficiency. Excessively high learning rates may cause premature convergence, while insufficient tree depth can restrict the model’s ability to capture nonlinear relationships. To systematically explore the hyperparameter space, a grid search strategy was employed to evaluate combinations of values within predefined ranges. This method identified configurations with high validation performance and strong robustness, indicated by less than a 5% drop between training and testing performance. The grid search protocol thus proves effective in building reliable and generalizable models through structured exploration of the parameter space.
In addition to point predictions, estimating the reliability of model outputs is crucial, particularly for material design under extreme conditions. This work leveraged the ensemble nature of ML algorithms to quantify predictive uncertainty. For the RF model (used for ductility prediction), the prediction uncertainty for a given input x was estimated by calculating the standard deviation (σ) of predictions from all N individual DTs. The 95% confidence interval (CI) was defined as
Multi-objective optimization algorithm
Multi-objective optimization algorithms address the trade-off issues inherent in traditional single-objective design methods[43].
In this work, a multi-objective optimization system for titanium alloys was established based on the NSGA-II framework. The system defines a 9-dimensional alloy element space as the design variables, with dual-objective optimization functions aimed at maximizing impact ductility and ductility. Domain knowledge-based ML models were integrated into the NSGA-II algorithm, which adopts an elitist strategy and is initialized using Latin hypercube sampling to ensure uniform coverage of the design space. The evolutionary search is driven by simulated binary crossover (crossover probability = 0.9; distribution index = 15) to promote global exploration, combined with polynomial mutation (mutation probability = 0.25; distribution index = 15) to enhance local refinement. An innovative constraint-handling mechanism is introduced, incorporating component normalization
Thermo-Calc thermodynamic phase diagram calculation
Thermo-Calc calculations were performed to locate titanium alloys on the Pareto frontier within equivalent phase and phase fraction diagrams under different equilibrium states. These results reveal the evolution of phase fractions under various heat treatment conditions. The thermodynamic equilibrium state of titanium alloys is determined by establishing mathematical models of Gibbs free energy for each phase and applying optimized database parameters. Phase fraction calculations and equivalent diagram generation are direct applications of these thermodynamic models. For instance, a single equilibrium calculation at fixed composition and temperature directly yields the phase fractions under those conditions. By systematically varying temperatures at fixed composition and performing multiple equilibrium calculations, phase fraction-temperature curves can be obtained. These curves can be combined to construct equivalent diagrams, thereby revealing phase evolution during heat treatment. For the calculation of derived properties such as specific heat capacity, the software computes the system enthalpy through equilibrium analysis and employs numerical differentiation to determine enthalpy changes over small temperature intervals. This enables the calculation of specific heat capacity. This method captures latent heat effects during phase transitions, allowing the calculated results to reproduce characteristic peaks observed in experimental data.
Johnson–Cook model validation
This work aims to investigate the stress-strain relationship in various alloys under dynamic impact conditions. However, the classical Johnson–Cook (J–C) model[69] cannot accurately and efficiently capture the combined effects of dynamic loading, strain hardening, and thermal softening. To address this limitation, the initial segment equation was modified to describe elastic deformation, leading to the development of the JC-P4 model. The primary modification involves replacing the initial segment equation with a fourth-order polynomial, as expressed in Equation (8)[70]:
where σ denotes the flow stress (MPa), and k0 - k4 are strain-hardening coefficients. C is the strain rate hardening exponent, and m is the thermal softening coefficient. ε represents the equivalent plastic strain, while
where Cp is the specific heat capacity, ρ is the density, and τ45° =
For the TA15 alloy, the JC-P4 parameters k0 - k4, C and m were directly fitted to the experimentally measured stress–strain curves at strain rates of 2,000, 2,500, and 3,000 s-1. For the newly designed alloy, which has not yet been manufactured, an approximate procedure was adopted. The thermal properties (melting temperature Tm, specific heat capacity Cp, and density ρ) were obtained from Thermo-Calc calculations and density estimates. The rate-sensitivity parameter C and thermal softening exponent m were assumed to be similar to those of TA15, reflecting the comparable near-α microstructural class. The strain-hardening coefficients k0 - k4 were then adjusted such that the JC-P4 model reproduces the overall strength level predicted by the ML model at a strain rate of 3,000 s-1. This approach provides a qualitative estimate of the dynamic stress-strain response of the designed alloy.
RESULTS AND DISCUSSION
Feature engineering for knowledge-enabled initial data spaces
To establish a more comprehensive relationship between domain knowledge-based alloy characteristics and the strength-ductility behavior of titanium alloys under extreme conditions, a database was constructed by integrating dynamic compressive strength, fracture strain, strain rate, and compositional information of titanium alloys at high strain rates. On one hand, Figure 2 presents 175 datasets of flow strength and fracture strain for titanium alloys containing Al, V, Mo, Zr, Fe, Si, Sn, Nb, and Cr. The experimental strain rates range from 1,000 to 5,000 s-1 [Figure 2A]. Strain rates above 5,000 s-1 often induce premature fracture in brittle titanium alloys, thereby limiting the availability of comprehensive data. Figure 2B shows a box plot of the strength distribution, where most titanium alloys exhibit strengths in the range of 1,100-1,900 MPa. This range exceeds the typical strength of industrial-scale titanium alloys, which is generally below 1,300 MPa; this discrepancy may be attributed to the use of small-scale laboratory specimens reported in the literature. Among the nine principal alloying elements (excluding Ti), Figure 2C shows that Al, V, Mo, Nb, and Cr exhibit relatively higher concentrations, whereas Fe and Si are present in minor amounts. Figure 2D illustrates the distribution of alloying elements in typical titanium alloys, which generally contain two to six elements, as both insufficient and excessive alloying reduce practical applicability. These results indicate a broad compositional space for titanium alloy design.
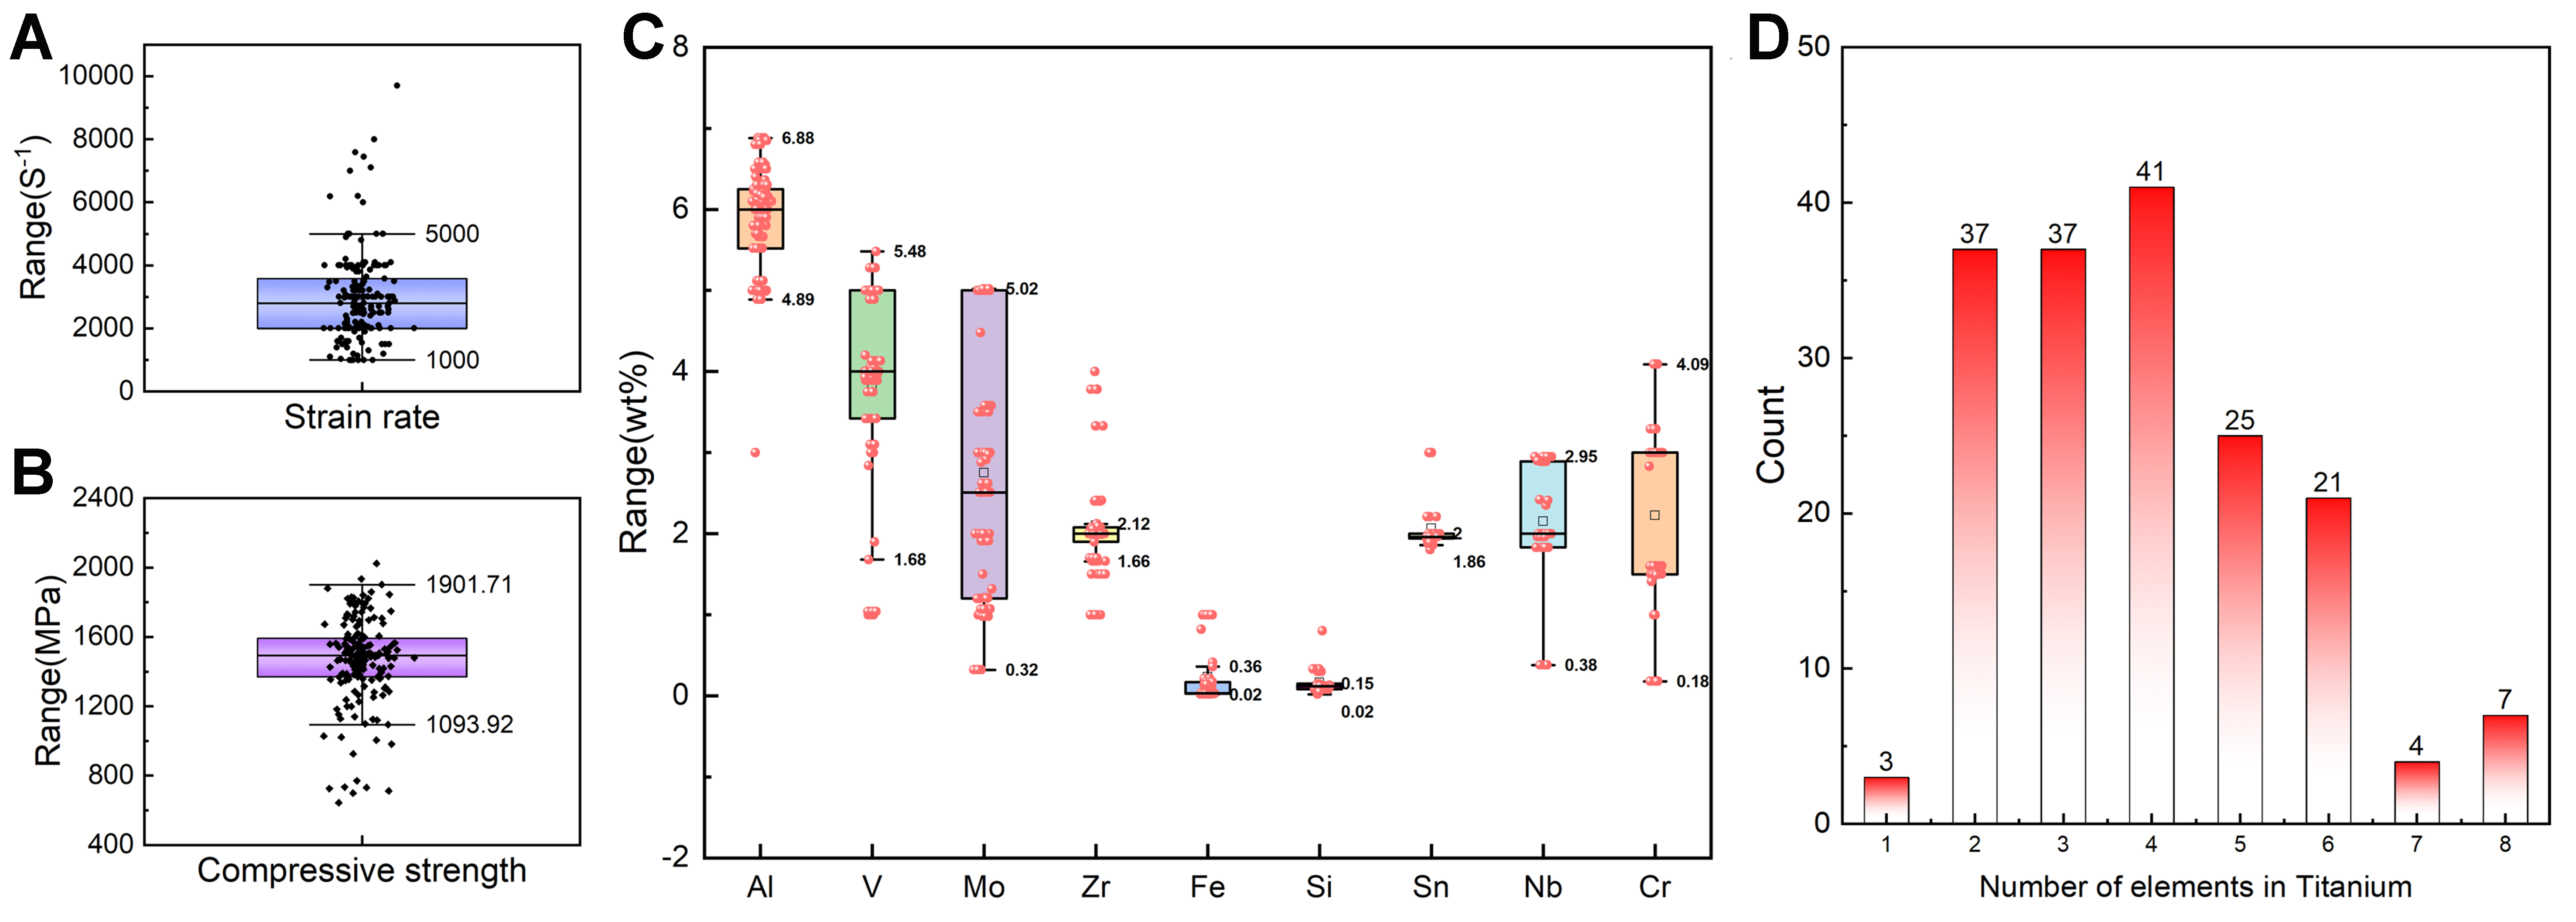
Figure 2. The distribution of the strength dataset. The box plot distributions of flow strength, fracture strain and non-Ti alloying element characteristics in the datasets. (A-C) all show many outliers in terms of characteristics and target values; (D) The distribution of element quantities in titanium alloys indicates that most of the alloys in the dataset contain 4 to 6 elements.
On the other hand, a total of 312 datasets reflecting ductility information, including fracture strain and strain rate, are presented in Figure 3. The strain rates shown in Figure 3A are concentrated between 250 and
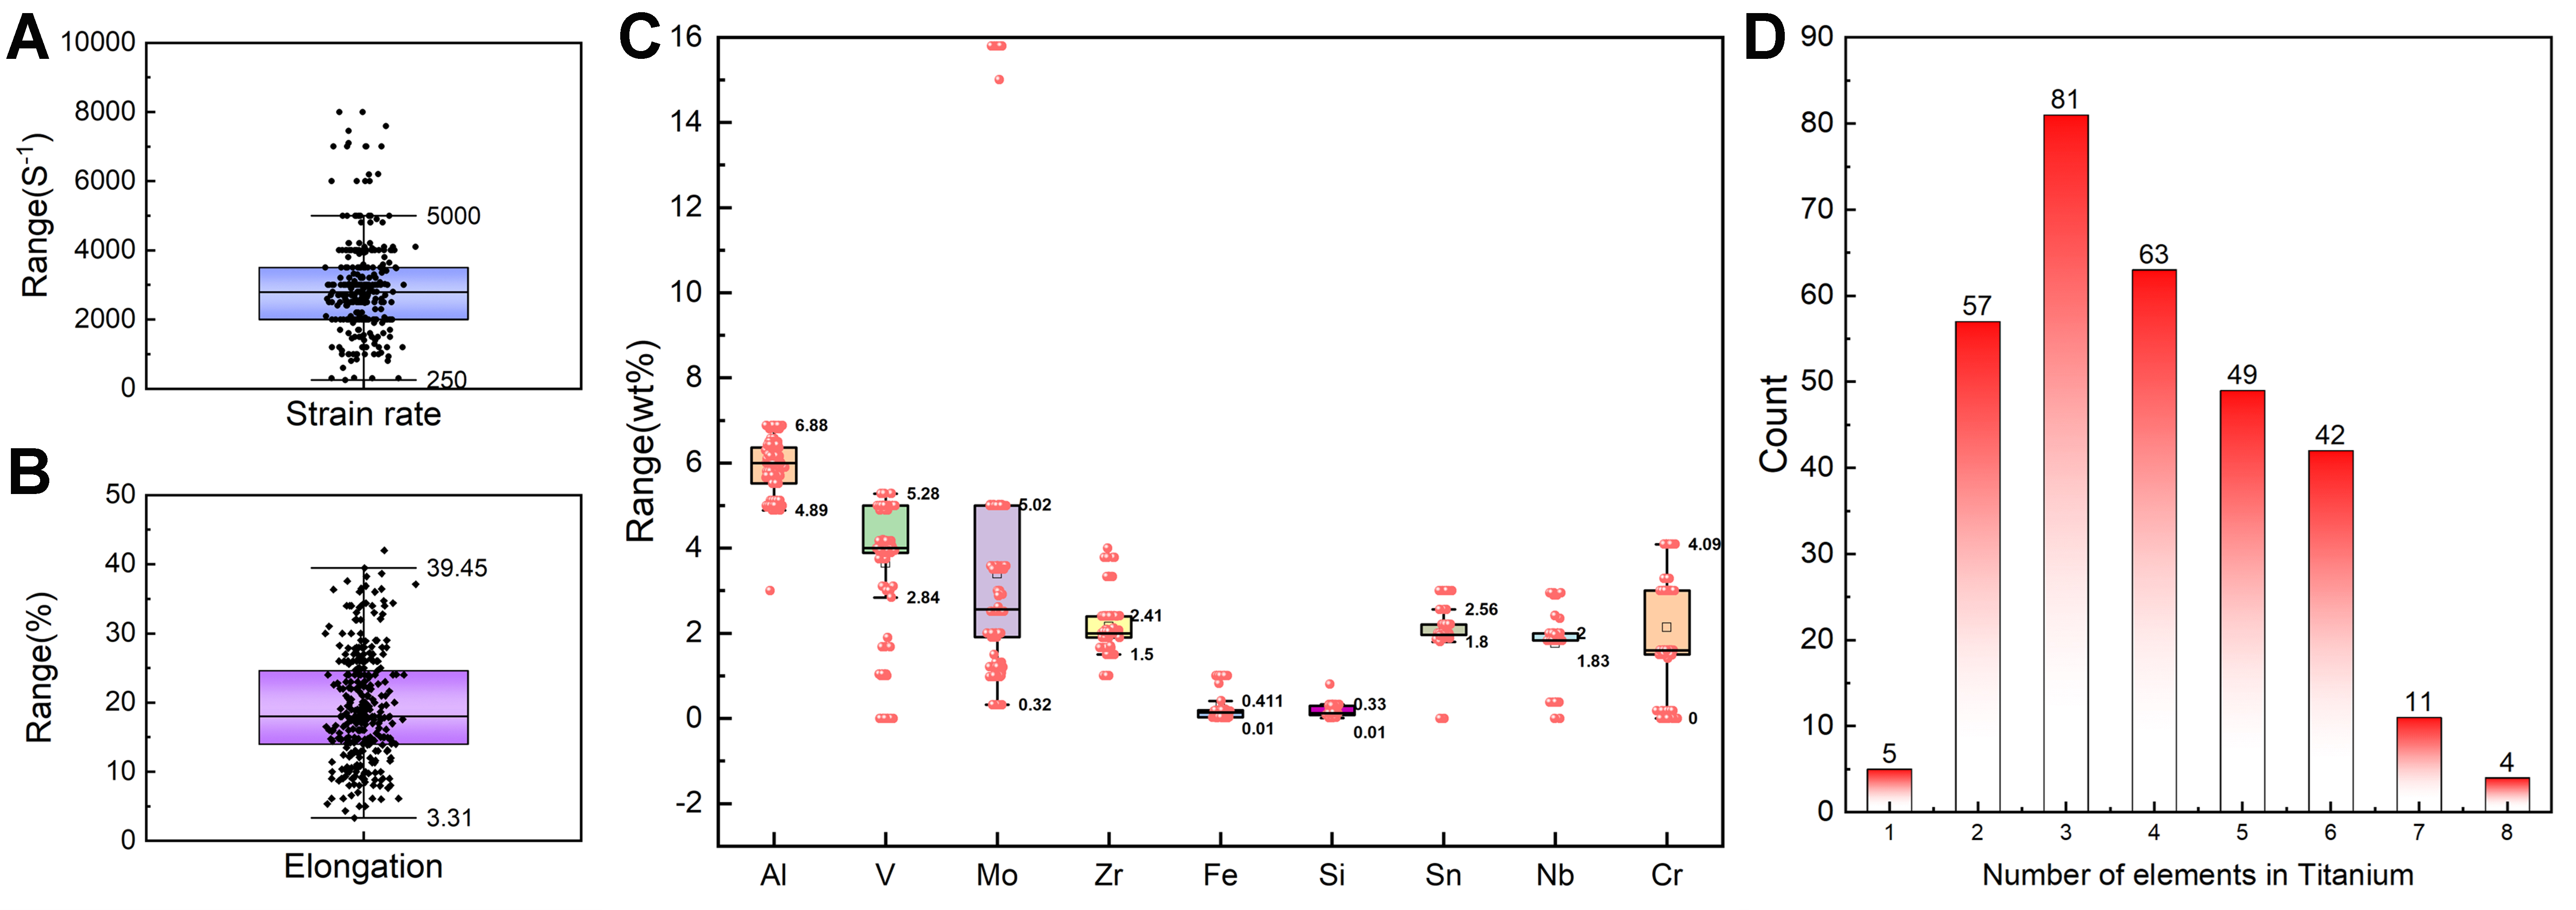
Figure 3. The distribution of the ductility dataset. The box plot distributions of flow strength, fracture strain and non-Ti alloying element characteristics in the datasets. (A-C) All show many outliers in terms of characteristics and target values; (D) The distribution of element quantities in titanium alloys indicates that most of the alloys in the dataset contain 4 to 6 elements.
In Figure 4, initial feature selection for strength is conducted based on 27 candidate parameters in the strength database, including alloy composition, Pearson correlation coefficients, MI, and RF feature importance ranking. Eleven key parameters {V, Zr, Fe, Si, Sn, Nb,
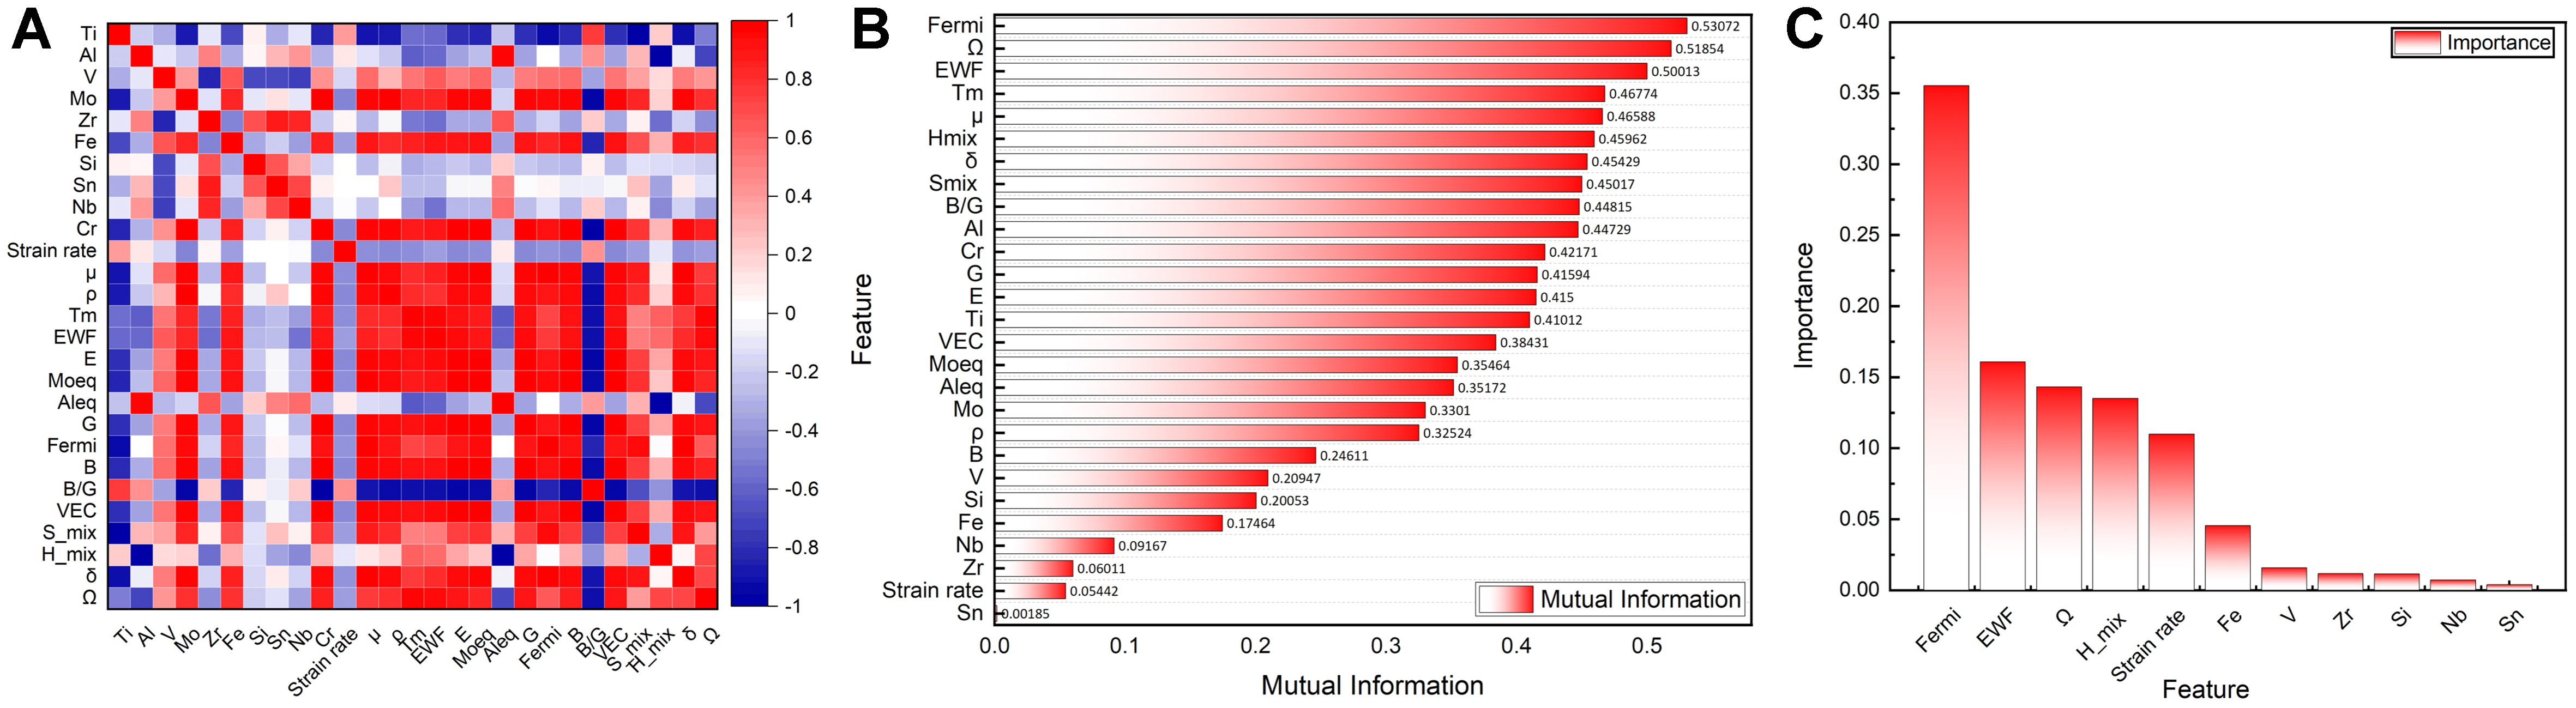
Figure 4. Preliminary screening results of strength feature engineering. (A) Pearson correlation coefficient matrix among features; (B) MI between features and target variables; (C) Feature importance ranking based on the RF model. MI: Mutual information; RF: random forest; EWF: electron work function; B/G: bulk/shear modulus; VEC: valence electron concentration.
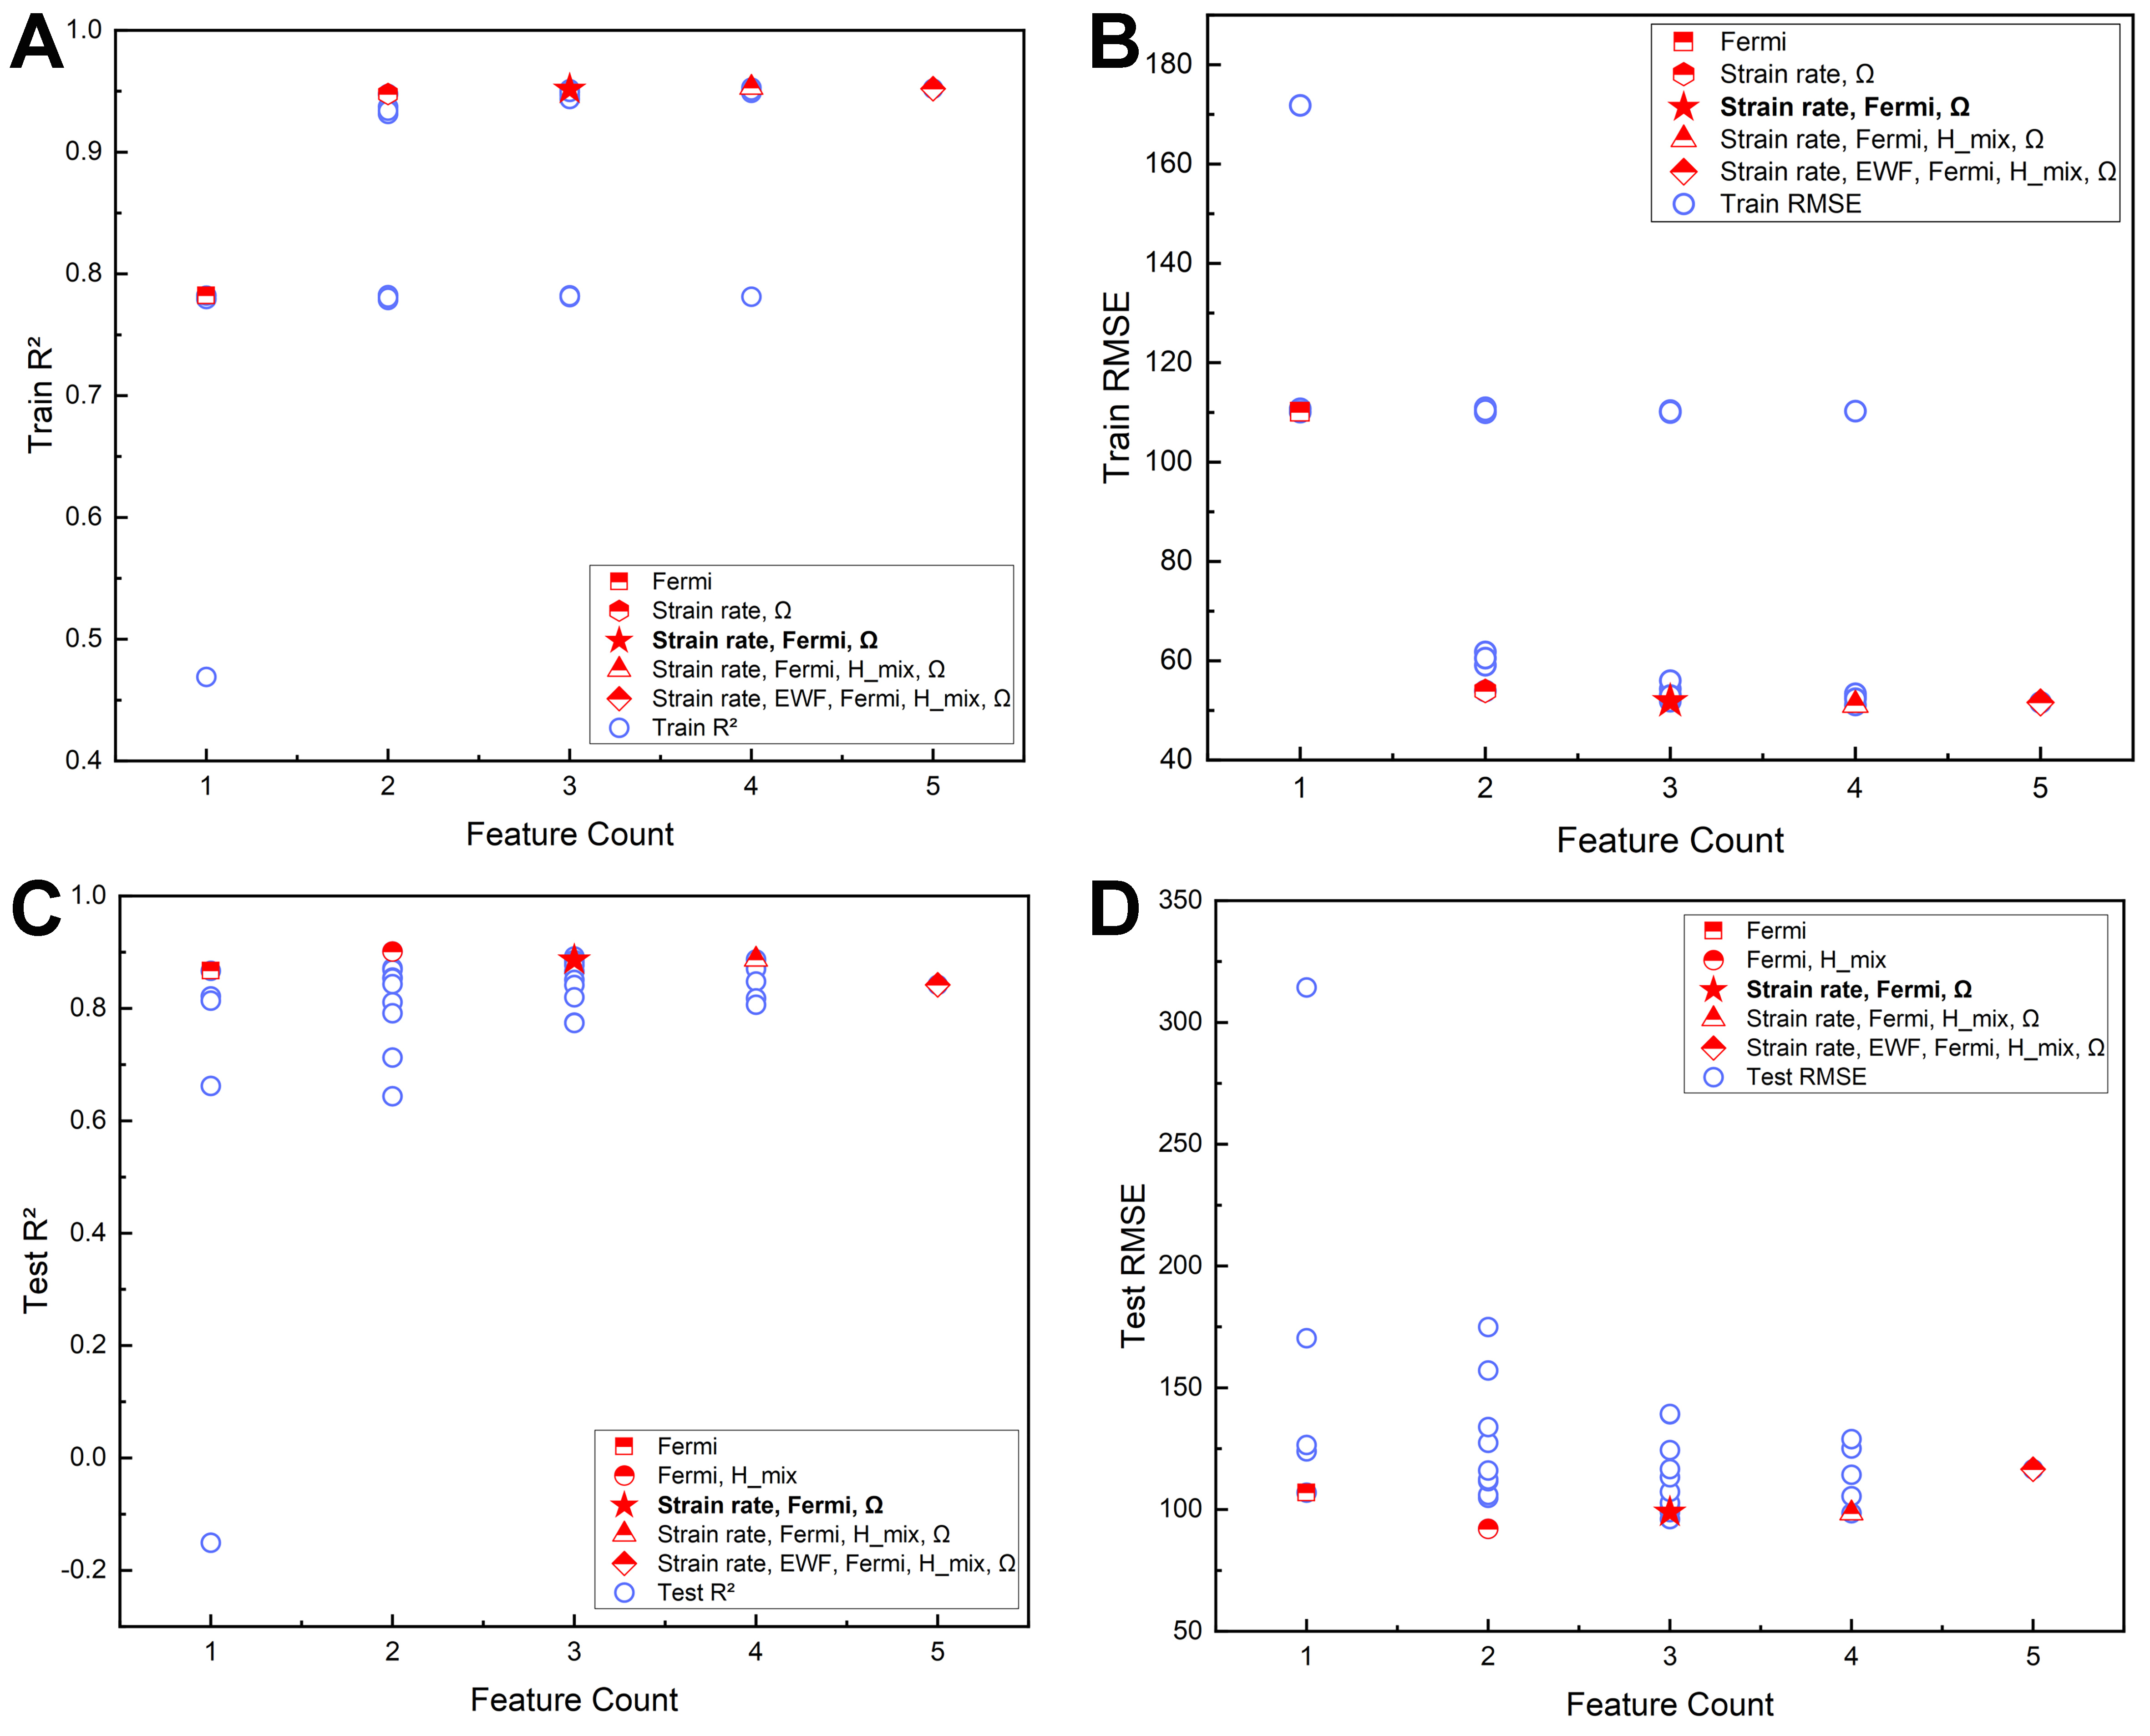
Figure 5. Wrapper-based exhaustive screening of strength feature subsets. All possible feature combinations were evaluated through multiple iterations of training and prediction. By comparing the regression accuracy and error of the model, the subset of characteristic parameters with the greatest impact on target strength performance is determined. (A) Training set R2; (B) Training set RMSE; (C) Test set R2; (D) Test set RMSE. R2: The coefficient of determination; RMSE: root mean square error; EWF: electron work function.
Summary of feature subset selection for the strength dataset using the exhaustive method
| Feature count | Feature subset | Train RMSE | Train R2 | Test RMSE | Test R2 |
| 2 | Fermi, Hmix | 110.12 | 0.78 | 92.11 | 0.90 |
| 3 | Fermi, Hmix , Ω | 110.11 | 0.78 | 96.09 | 0.89 |
| 4 | Strain rate, Fermi, Hmix, Ω | 51.11 | 0.95 | 98.52 | 0.89 |
| 3 | Strain rate, Fermi, Ω | 51.85 | 0.95 | 98.96 | 0.89 |
| 3 | Strain rate, Fermi, Hmix | 53.21 | 0.95 | 100.61 | 0.88 |
| 3 | EWF, Fermi, Ω | 110.00 | 0.78 | 102.73 | 0.88 |
| 2 | Fermi, Ω | 109.94 | 0.78 | 104.86 | 0.87 |
| 4 | EWF, Fermi, H_mix, Ω | 110.29 | 0.78 | 105.51 | 0.87 |
| 2 | EWF, Fermi | 110.44 | 0.78 | 106.01 | 0.87 |
| 1 | Fermi | 110.05 | 0.78 | 106.97 | 0.87 |
| 3 | EWF, Fermi, Hmix | 110.37 | 0.78 | 107.32 | 0.87 |
| 2 | Hmix , Ω | 110.03 | 0.78 | 111.67 | 0.85 |
| 2 | Strain rate, Fermi | 59.09 | 0.94 | 112.30 | 0.85 |
| 3 | Strain rate, Hmix, Ω | 52.75 | 0.95 | 113.31 | 0.85 |
| 4 | Strain rate, EWF, Fermi, Ω | 52.81 | 0.95 | 114.30 | 0.85 |
| 2 | EWF, Hmix | 110.94 | 0.78 | 116.02 | 0.84 |
| 5 | Strain rate, EWF, Fermi, Hmix, Ω | 51.60 | 0.95 | 116.52 | 0.84 |
| 3 | EWF, Hmix, Ω | 110.16 | 0.78 | 116.60 | 0.84 |
| 1 | Ω | 110.67 | 0.78 | 123.92 | 0.82 |
| 3 | Strain rate, EWF, Fermi | 54.33 | 0.95 | 124.40 | 0.82 |
| 4 | Strain rate, EWF, Fermi, Hmix | 53.36 | 0.95 | 125.06 | 0.82 |
| 1 | EWF | 110.74 | 0.78 | 126.52 | 0.81 |
| 2 | Strain rate, Ω | 53.93 | 0.95 | 127.43 | 0.81 |
| 4 | Strain rate, EWF, Hmix, Ω | 52.35 | 0.95 | 128.9 | 0.81 |
| 2 | EWF, Ω | 110.44 | 0.78 | 133.91 | 0.79 |
| 3 | Strain rate, EWF, Hmix | 56.01 | 0.94 | 139.09 | 0.77 |
| 3 | Strain rate, EWF, Ω | 52.98 | 0.95 | 139.30 | 0.77 |
| 2 | Strain rate, EWF | 61.77 | 0.93 | 157.10 | 0.71 |
| 1 | Hmix | 110.07 | 0.78 | 170.38 | 0.66 |
| 2 | Strain rate, Hmix | 60.54 | 0.93 | 174.93 | 0.64 |
| 1 | Strain rate | 171.82 | 0.47 | 314.40 | -0.150 |
For the ductility dataset, initial feature selection was conducted using Pearson correlation coefficients, MI, and RF feature importance ranking [Figure 6A and B]. A subset comprising ten parameters {Strain rate, B/G, Zr, ΔHmix, Fe, V, VEC, Sn, Nb, Si} is identified [Figure 6C]. Subsequently, six features {Strain rate, B/G, Zr, ΔHmix, Fe, V}, collectively accounting for over 90% of the cumulative importance, are retained through feature importance analysis, indicating their dominant influence on ductility. Among these, strain rate alone shows an importance greater than 0.55 under the experimental conditions. To reduce computational complexity during feature subset evaluation, these six features were further subjected to exhaustive subset screening[Figure 7 and Table 5]. Single-feature subsets achieve limited predictive accuracy (R2 = 0.56), whereas multi-feature configurations maintain higher predictive performance (R2 = 0.82). Subsets including strain rate consistently exhibit training R2 values above 0.85. Three- and four-parameter subsets containing strain rate demonstrate a clear trend of strong predictive performance (R2 > 0.85), leading to the identification of five optimal subsets: {Strain rate, B/G, ΔHmix}, {V, Strain rate, ΔHmix}, {V, Fe, Strain rate, ΔHmix}, {V, Strain rate, B/G, ΔHmix}, and {Fe, Strain rate, B/G, ΔHmix}. Among these, the three-feature subset {Strain rate, B/G, ΔHmix} provides the best balance between predictive accuracy and model interpretability.
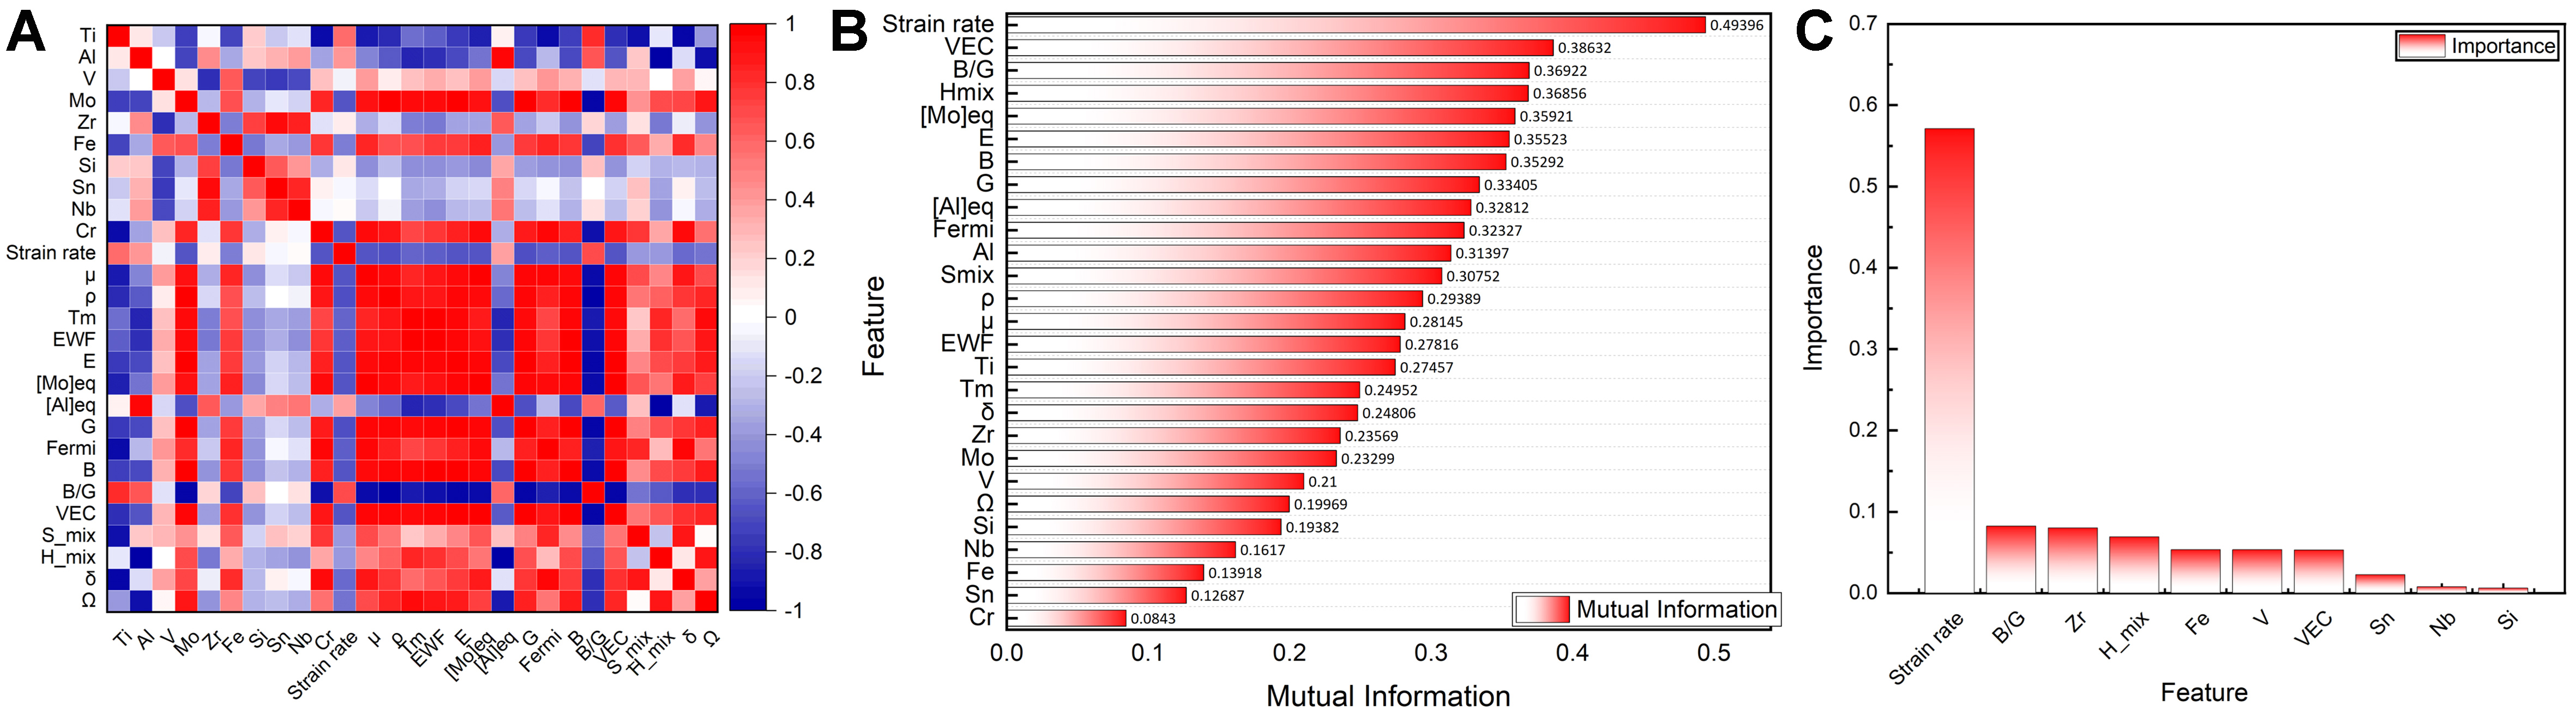
Figure 6. Preliminary screening results of plastic strain characteristic engineering. (A) Pearson correlation coefficient matrix among features; (B) MI between features and target variables; (C) Feature importance ranking based on the RF model. MI: Mutual information; RF: random forest; EWF: electron work function; B/G: bulk/shear modulus; VEC: valence electron concentration.
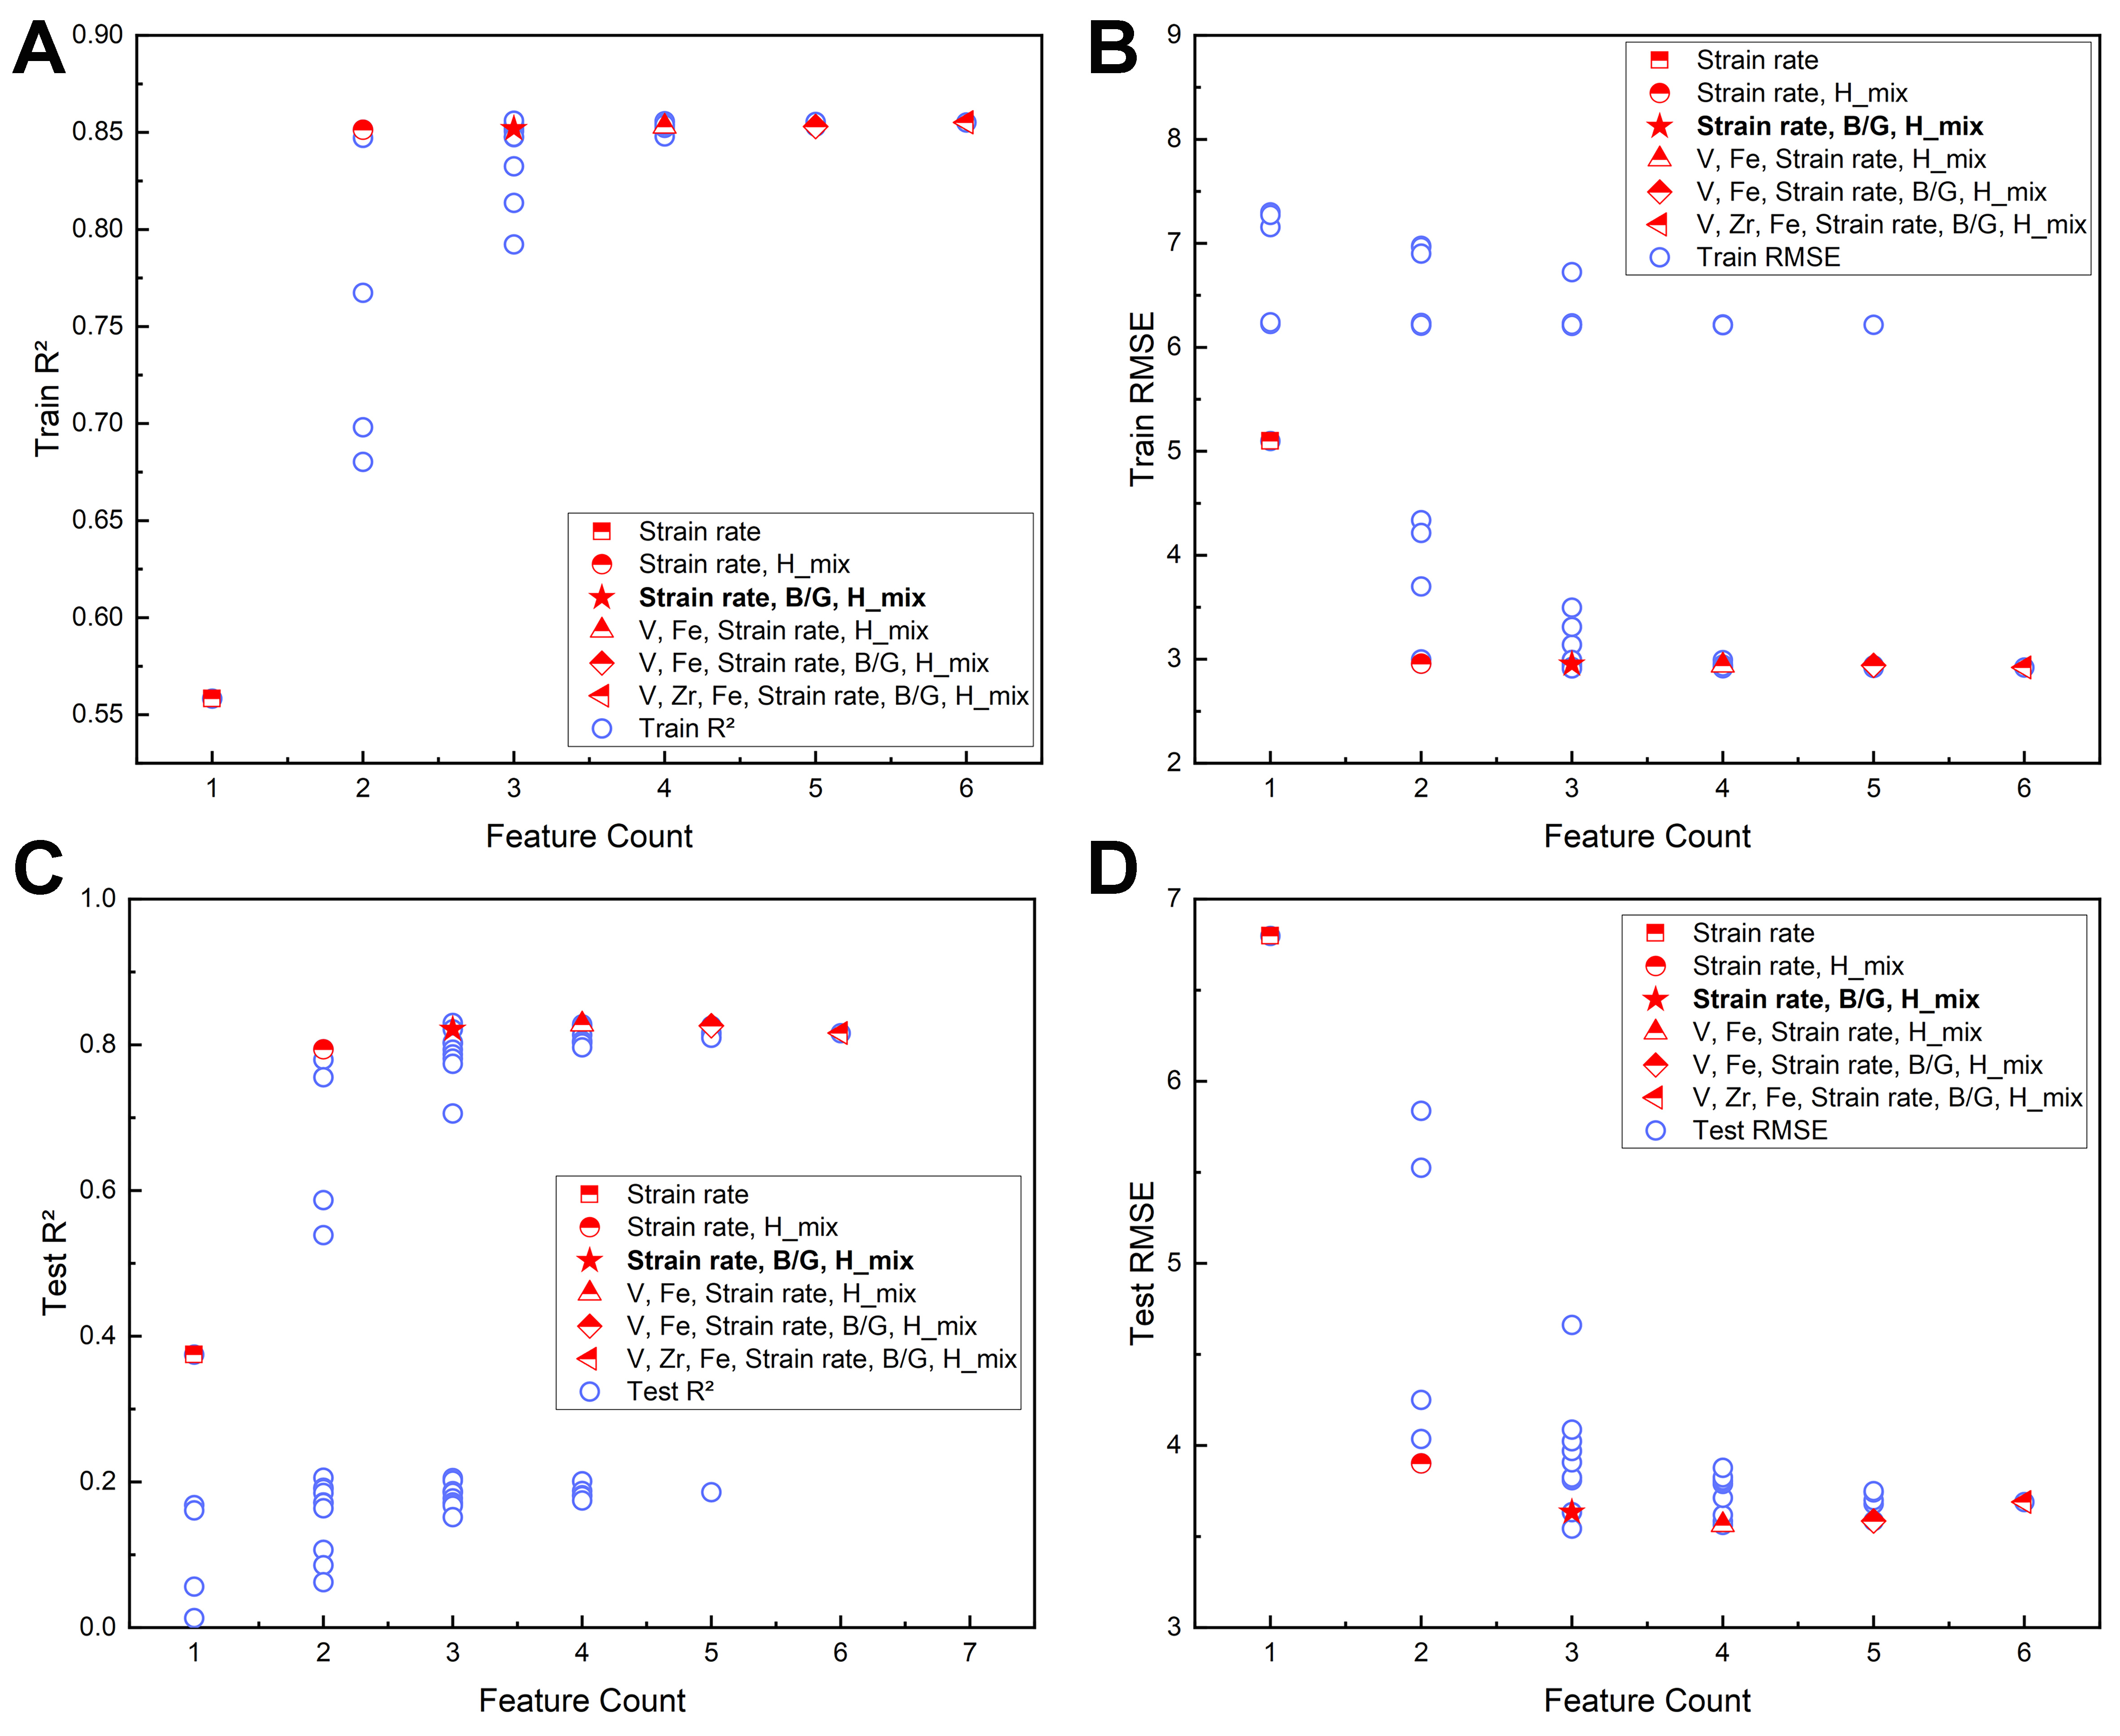
Figure 7. Exhaustive evaluation of plastic strain characteristics. All possible feature combinations were assessed through multiple iterations of training and prediction. By comparing the regression accuracy and error of the model, the subset of characteristic parameters with the greatest impact on target strength performance is determined. (A) Training set R2; (B) Training set RMSE; (C) Test set R2; (D) Test set RMSE. R2: The coefficient of determination; RMSE: root mean square error; B/G: bulk/shear modulus.
Summary of feature subset performance for the ductility dataset after exhaustive feature subset selection (feature count ≥ 3)
| Feature count | Feature subset | Train RMSE | Train R2 | Test RMSE | Test R2 |
| 3 | V, Strain rate, Hmix | 2.94 | 0.85 | 3.54 | 0.83 |
| 3 | Strain rate, B/G, Hmix | 2.95 | 0.85 | 3.63 | 0.82 |
| 3 | Fe, Strain rate, B/G | 3.00 | 0.85 | 3.81 | 0.80 |
| 3 | V, Zr, Strain rate | 3.14 | 0.83 | 3.82 | 0.80 |
| 3 | Fe, Strain rate, Hmix | 2.97 | 0.85 | 3.82 | 0.80 |
| 3 | V, Strain rate, B/G | 2.99 | 0.85 | 3.91 | 0.79 |
| 3 | Zr, Strain rate, B/G | 2.93 | 0.85 | 3.97 | 0.79 |
| 3 | Zr, Strain rate, Hmix | 2.91 | 0.86 | 4.02 | 0.78 |
| 3 | V, Fe, Strain rate | 3.50 | 0.79 | 4.09 | 0.77 |
| 3 | Zr, Fe, Strain rate | 3.31 | 0.81 | 4.66 | 0.71 |
| 3 | V, Zr, B/G | 6.22 | 0.34 | 7.66 | 0.21 |
| 3 | Zr, Fe, B/G | 6.22 | 0.34 | 7.68 | 0.20 |
| 3 | V, Zr, Hmix | 6.22 | 0.34 | 7.75 | 0.19 |
| 3 | V, Fe, B/G | 6.21 | 0.35 | 7.75 | 0.19 |
| 3 | Zr, B/G, Hmix | 6.22 | 0.34 | 7.76 | 0.19 |
| 3 | Zr, Fe, Hmix | 6.23 | 0.34 | 7.80 | 0.18 |
| 3 | V, Fe, Hmix | 6.22 | 0.34 | 7.82 | 0.17 |
| 3 | Fe, B/G, Hmix | 6.22 | 0.34 | 7.83 | 0.17 |
| 3 | V, B/G, Hmix | 6.22 | 0.34 | 7.85 | 0.17 |
| 3 | V, Zr, Fe | 6.72 | 0.23 | 7.92 | 0.15 |
| 4 | V, Fe, Strain rate, Hmix | 2.94 | 0.85 | 3.56 | 0.83 |
| 4 | V, Strain rate, B/G, Hmix | 2.93 | 0.85 | 3.58 | 0.83 |
| 4 | Fe, Strain rate, B/G, Hmix | 2.95 | 0.85 | 3.62 | 0.82 |
| 4 | V, Zr, Strain rate, Hmix | 2.91 | 0.86 | 3.71 | 0.81 |
| 4 | Zr, Fe, Strain rate, B/G | 2.92 | 0.86 | 3.79 | 0.81 |
| 4 | V, Fe, Strain rate, B/G | 2.99 | 0.85 | 3.79 | 0.81 |
| 4 | V, Zr, Fe, Strain rate | 2.95 | 0.85 | 3.80 | 0.80 |
| 4 | V, Zr, Strain rate, B/G | 2.93 | 0.85 | 3.81 | 0.80 |
| 4 | Zr, Strain rate, B/G, Hmix | 2.92 | 0.86 | 3.83 | 0.80 |
| 4 | Zr, Fe, Strain rate, Hmix | 2.93 | 0.85 | 3.88 | 0.80 |
| 4 | V, Zr, Fe, B/G | 6.21 | 0.34 | 7.69 | 0.20 |
| 4 | V, Zr, B/G, Hmix | 6.21 | 0.34 | 7.75 | 0.19 |
| 4 | V, Zr, Fe, Hmix | 6.22 | 0.34 | 7.78 | 0.18 |
| 4 | Zr, Fe, B/G, Hmix | 6.22 | 0.34 | 7.78 | 0.18 |
| 4 | V, Fe, B/G, Hmix | 6.22 | 0.34 | 7.81 | 0.17 |
| 5 | V, Fe, Strain rate, B/G, Hmix | 2.94 | 0.85 | 3.59 | 0.83 |
| 5 | V, Zr, Strain rate, B/G, Hmix | 2.93 | 0.85 | 3.68 | 0.82 |
| 5 | V, Zr, Fe, Strain rate, Hmix | 2.92 | 0.86 | 3.70 | 0.81 |
| 5 | V, Zr, Fe, Strain rate, B/G | 2.92 | 0.86 | 3.74 | 0.81 |
| 5 | Zr, Fe, Strain rate, B/G, Hmix | 2.92 | 0.86 | 3.75 | 0.81 |
| 5 | V, Zr, Fe, B/G, Hmix | 6.22 | 0.34 | 7.76 | 0.19 |
| 6 | V, Zr, Fe, Strain rate, B/G, Hmix | 2.92 | 0.86 | 3.69 | 0.82 |
Proactive exploration of optimal ML models and targeted optimization
Hyperparameter optimization directly influences the performance ceiling and generalization capability of ML algorithms, making it critical for achieving optimal task-specific performance.
Based on the above databases and the selected three-feature subset, twelve ML models were systematically evaluated, including AdaBoost, ANN, Bagging, DT, ExtraTrees, KNN, LightGBM, RF, Stacking, SVR, XGBoost, and GBRT [Figure 8]. Among these, the RF model achieved the optimal balance, with a test R2 of 0.89 and an RMSE of 99 MPa, indicating strong predictive performance and model stability. Although Bagging yielded a slightly lower RMSE (98 MPa), the feature randomness in RF enhanced ensemble diversity, providing higher explanatory power and reducing inter-tree correlation compared with Bagging. GBRT consistently underperformed RF, with an R2 of 0.87 and an RMSE of 107 MPa, demonstrating that the parallel ensemble structure of RF outperforms sequential boosting for this task. Moreover, RF reached peak performance without hyperparameter tuning, exhibiting minimal R2 divergence between training and test data, which confirms the model’s robustness without signs of overfitting or underfitting. For the RF model, hyperparameter optimization focused on four interdependent parameters [Figure 9A-D]. The parameter n_estimators specifies the number of DTs, determining the ensemble’s overall stability. Generally, a larger number of estimators reduces variance and improves prediction stability. The parameter max_depth controls the maximum depth of each DT, governing model complexity: deeper trees can capture more intricate relationships within the data, but excessive depth may result in overfitting. The parameters min_samples_split and min_samples_leaf jointly regulate the minimum number of samples required for node splitting and leaf formation, respectively. Increasing these thresholds limits tree growth, mitigates noise sensitivity, and enhances model generalization. Collectively, these parameters regulate the bias-variance trade-off by balancing forest size, tree complexity, and growth termination criteria. For example, shallow trees with a large number of estimators can reduce variance, whereas deeper trees with higher splitting thresholds can achieve a balance between bias and noise sensitivity, together, these hyperparameter settings are key factors in optimizing model generalization. Consequently, RF was selected as the preferred model for predicting the dynamic compressive strength of titanium alloys. The hyperparameter optimization ranges are shown in Table 6. The optimal configuration consists of a maximum depth of 15, a minimum of one sample per leaf, four samples required for node splitting, and 50 estimators, yielding a test R2 of 0.88, representing the highest predictive accuracy achieved [Figure 9E].
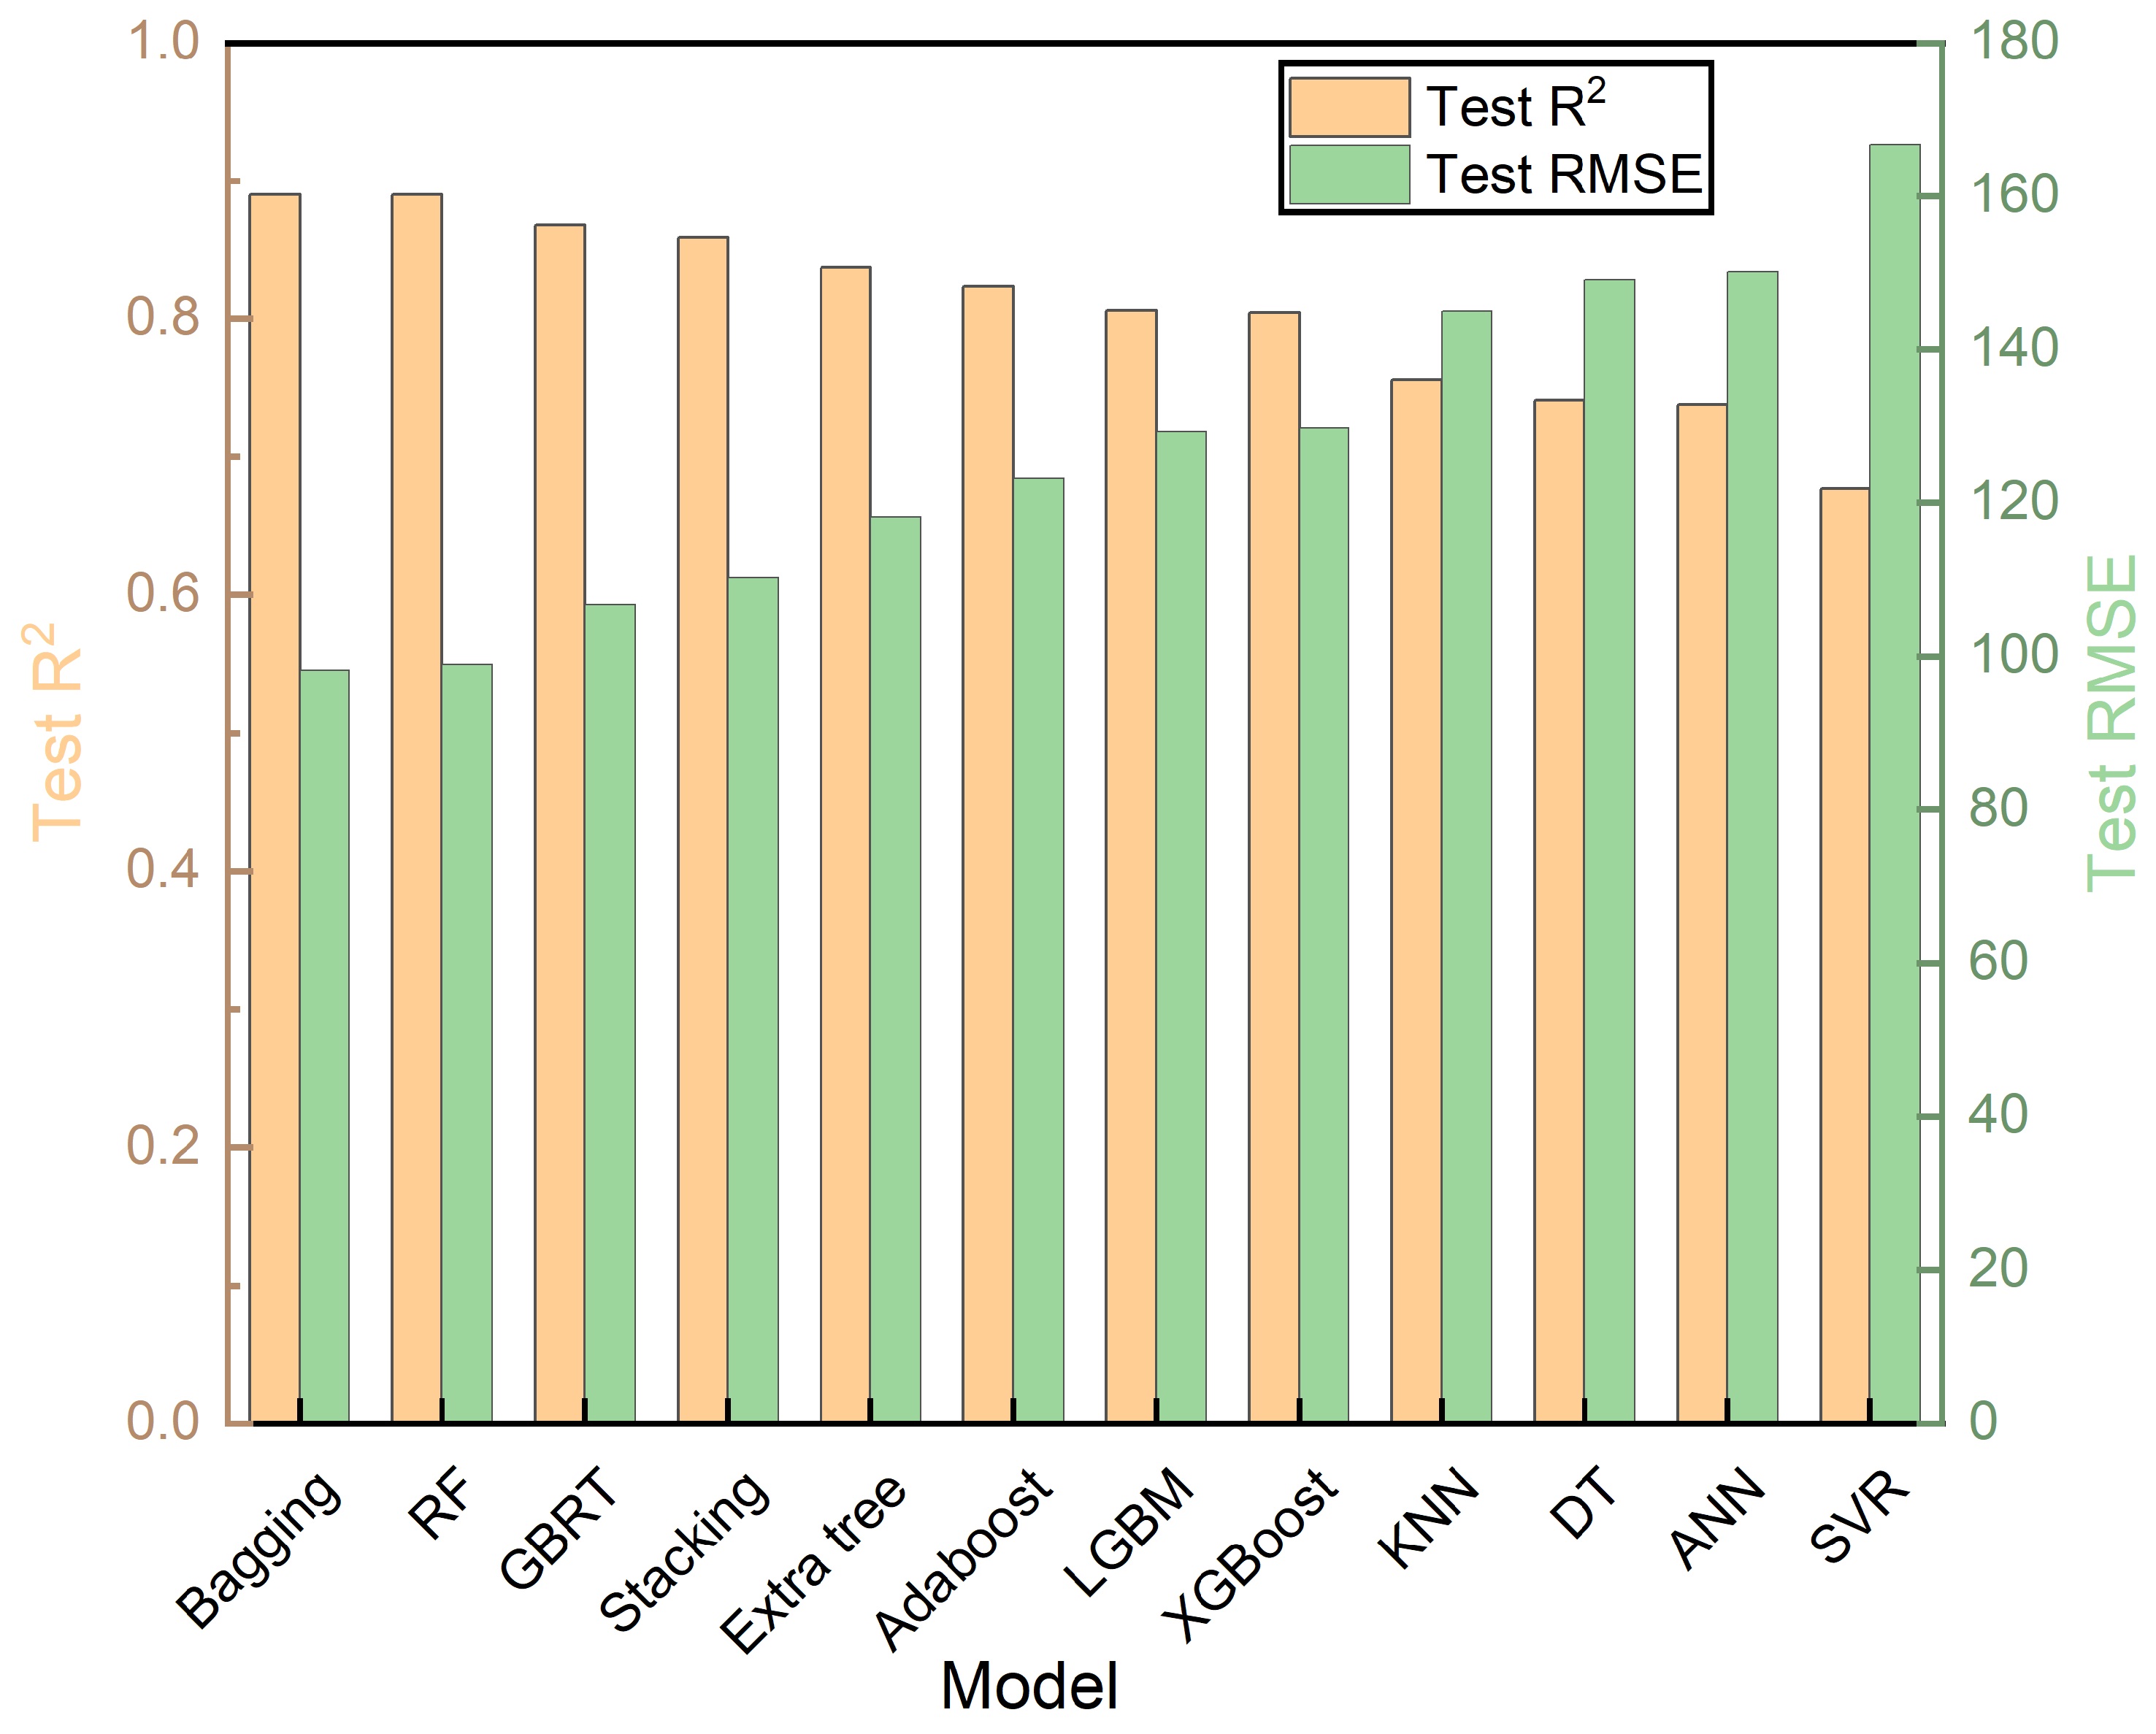
Figure 8. A performance comparison chart of 12 machine learning model test sets constructed based on the optimal strength feature subset. ML: Machine learning; R2: the coefficient of determination; RMSE: root mean square error; Bagging: bootstrap aggregating; RF: random forest; GBRT: gradient boosting regression tree; ExtraTree: extremely randomized tree; AdaBoost: adaptive boosting; LGBM: light gradient boosting machine; XGBoost: eXtreme gradient boosting; KNN: K-nearest neighbor; DT: decision tree; ANN: artificial neural network; SVR: support vector regression.
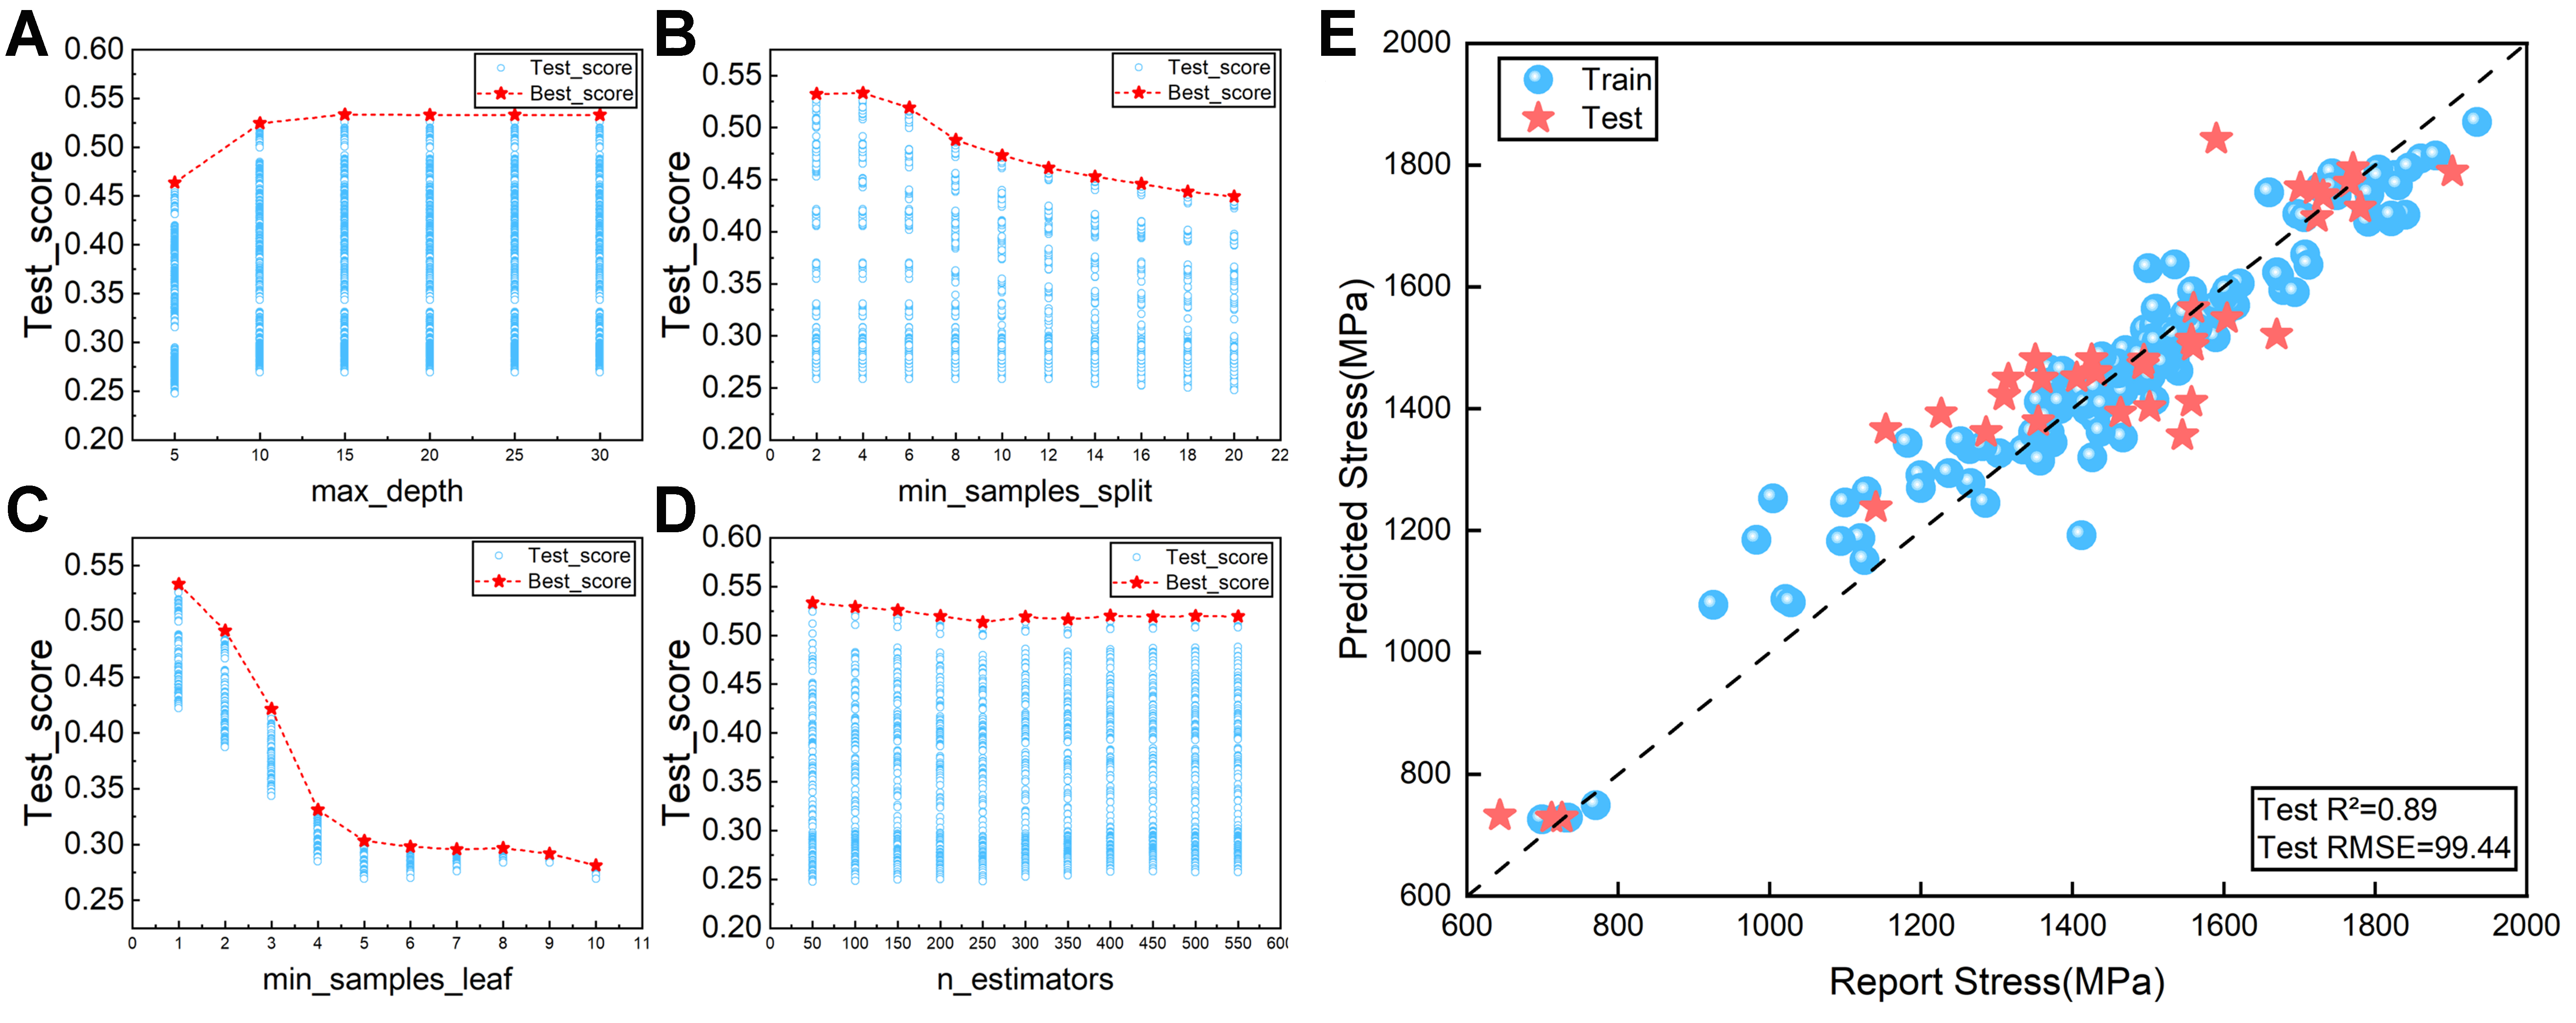
Figure 9. Four-parameter hyperparameter optimization was performed on the random forest model fitted to the strength dataset. (A) Maximum depth; (B) Minimum sample segmentation; (C) Minimum sample leaf; (D) n_estimators; (E) Strength prediction graph of the best RF model under the optimal combination of hyperparameters. RF: Random forest; R2: the coefficient of determination; RMSE: root mean square error.
Hyperparameter search ranges for the RF model
| Name | Parameter description | Min | Max | Step |
| n_estimators | The number of DTs in a RF | 50 | 550 | 50 |
| max_depth | The maximum depth of the DT | 0 | 30 | 5 |
| min_samples_split | The minimum number of samples required to split internal nodes | 2 | 20 | 2 |
| min_samples_leaf | The minimum number of samples required for leaf nodes | 1 | 10 | 1 |
For predicting ductility, the twelve ML models were applied to the three-feature subset {Strain rate, B/G, Hmix} [Figure 10]. The RF model consistently achieved high predictive accuracy across both training and testing datasets. Hyperparameter optimization results are presented in Figure 11. Under the optimal configuration - a tree depth of 15, a minimum of one sample per leaf, a minimum of two samples required for node splitting, and 50 DTs - the model achieved an R2 of 0.85 and an RMSE of 2.98% on the training dataset, and an R2 of 0.82 with an RMSE of 3.66% on the test dataset, confirming the robustness and high applicability of RF for predicting the ductility behavior of titanium alloys.
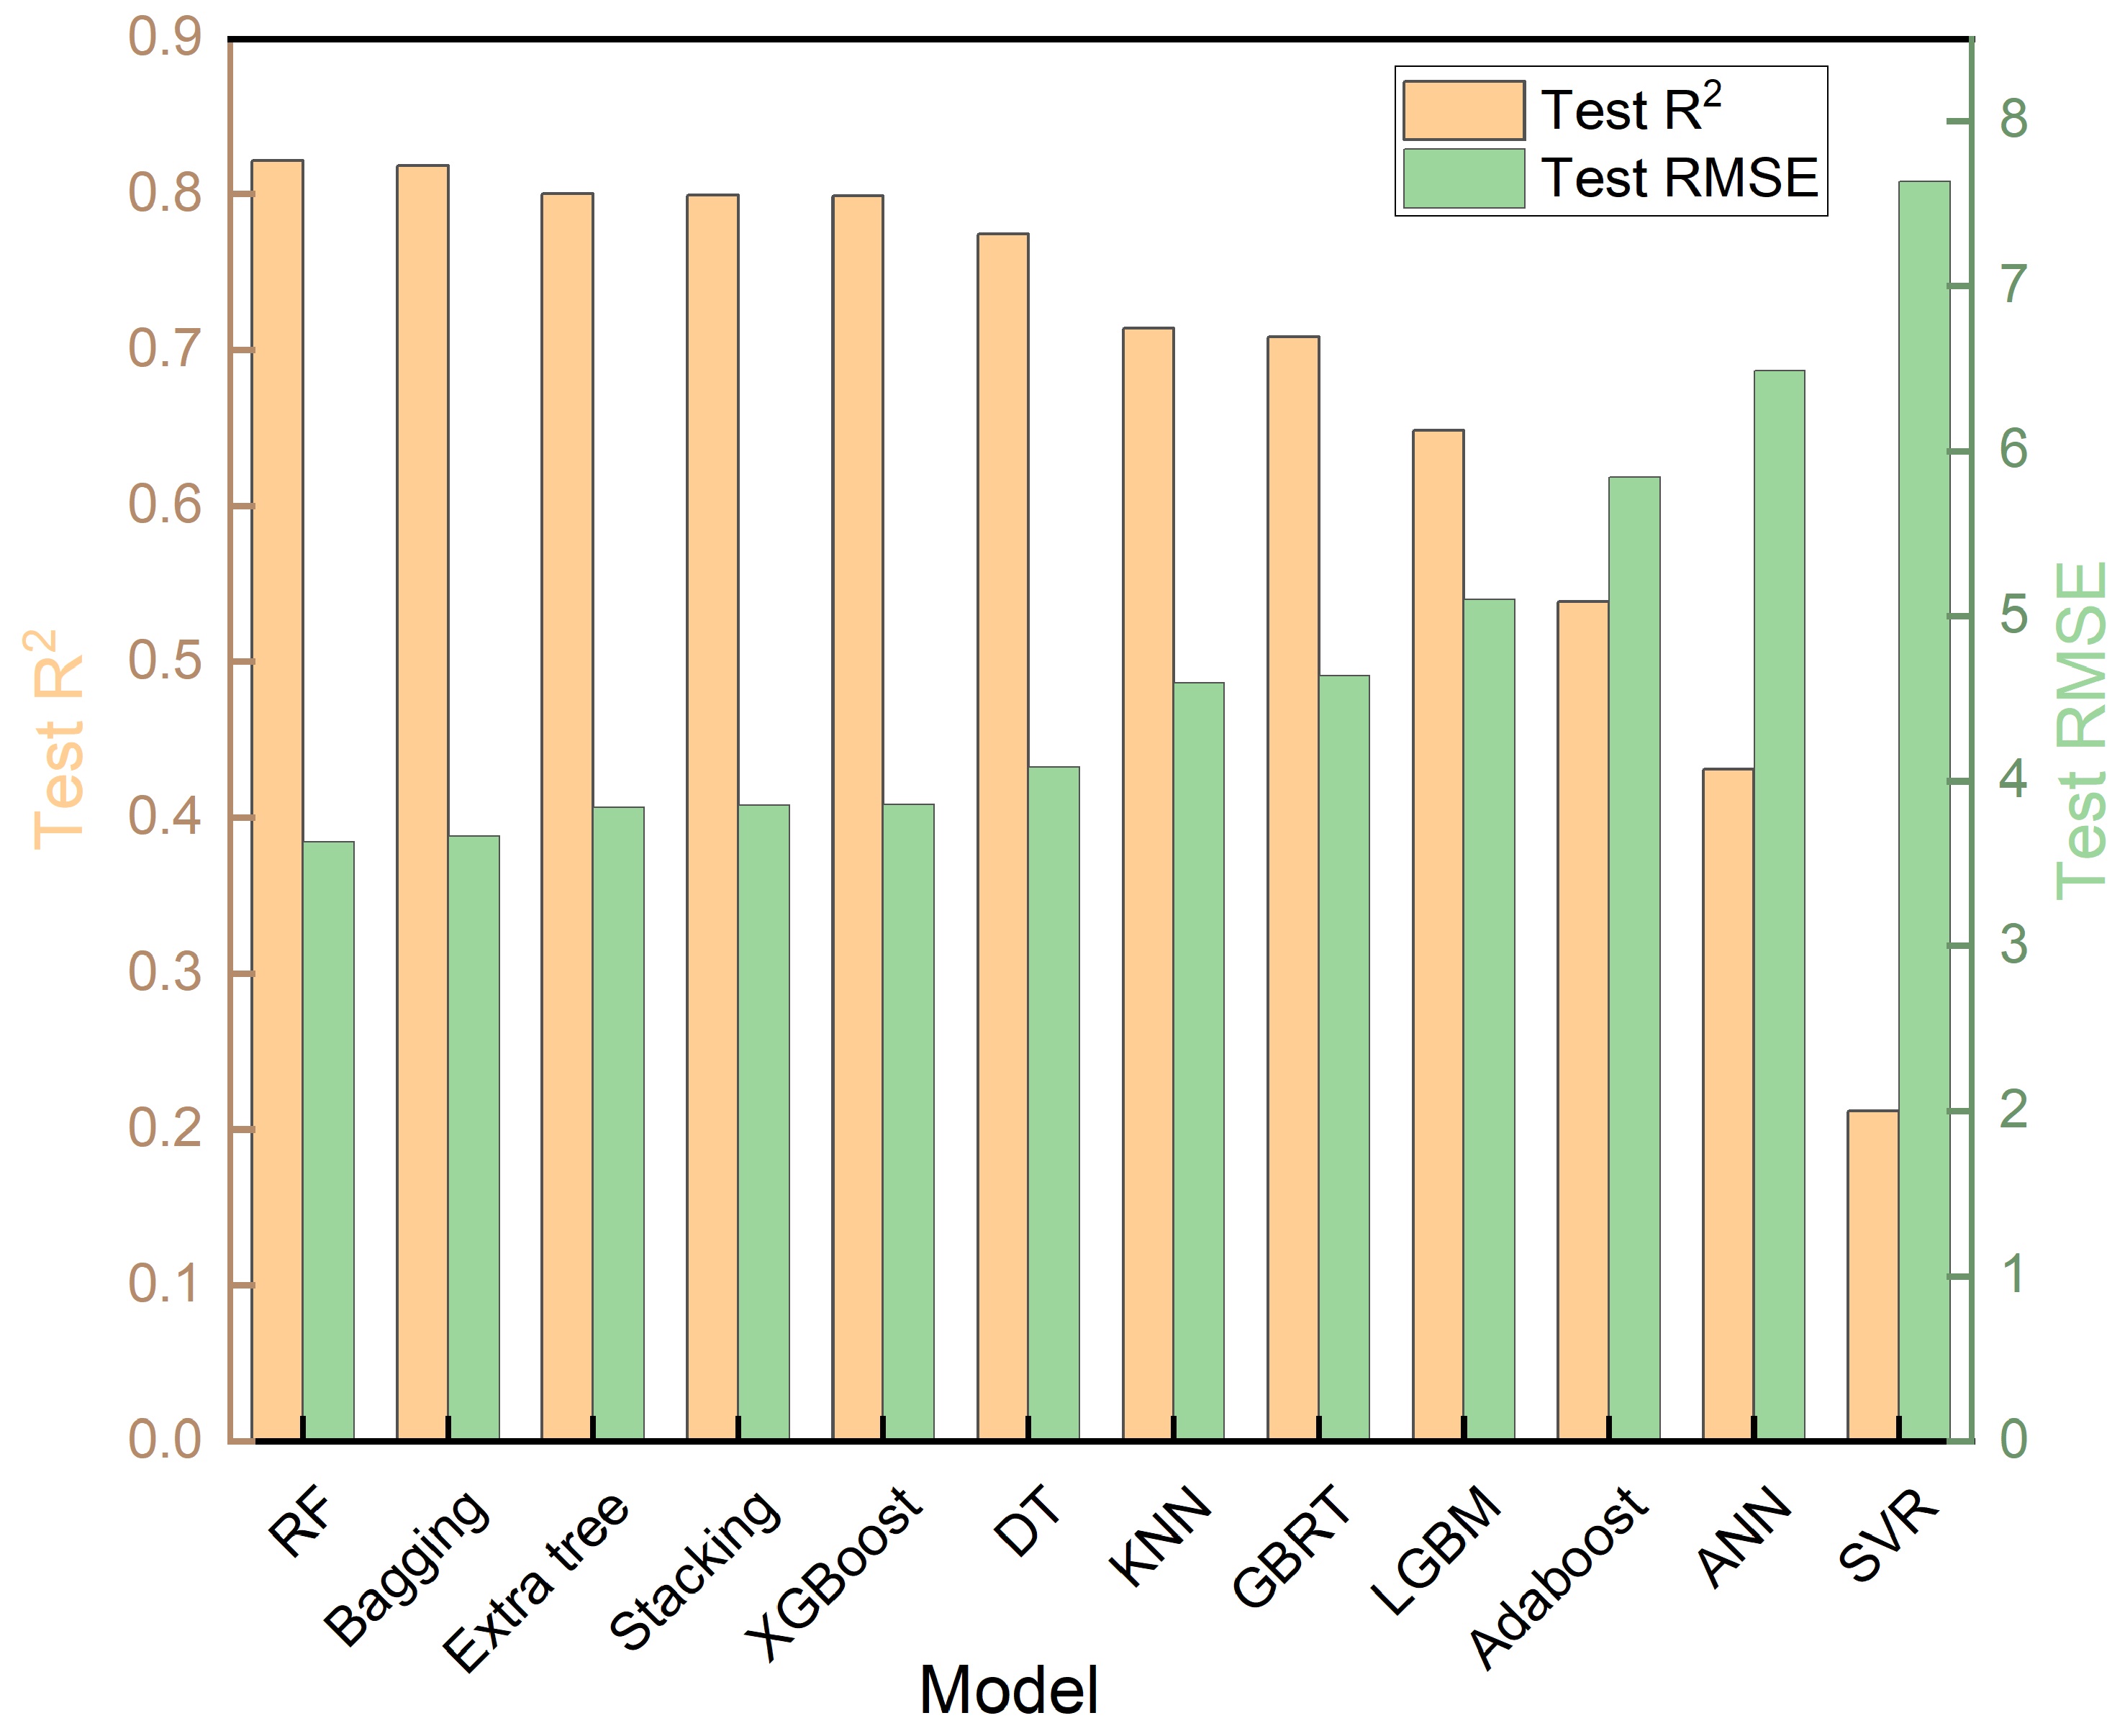
Figure 10. A performance comparison chart of 12 machine learning model test sets constructed based on the optimal plastic strain feature subset. ML: Machine learning; R2: the coefficient of determination; RMSE: root mean square error; RF: random forest; Bagging: bootstrap aggregating; ExtraTree: extremely randomized tree; XGBoost: eXtreme gradient boosting; DT: decision tree; KNN: K-nearest neighbor; GBRT: gradient boosting regression tree; LGBM: light gradient boosting machine; AdaBoost: adaptive boosting; ANN: artificial neural network; SVR: support vector regression.
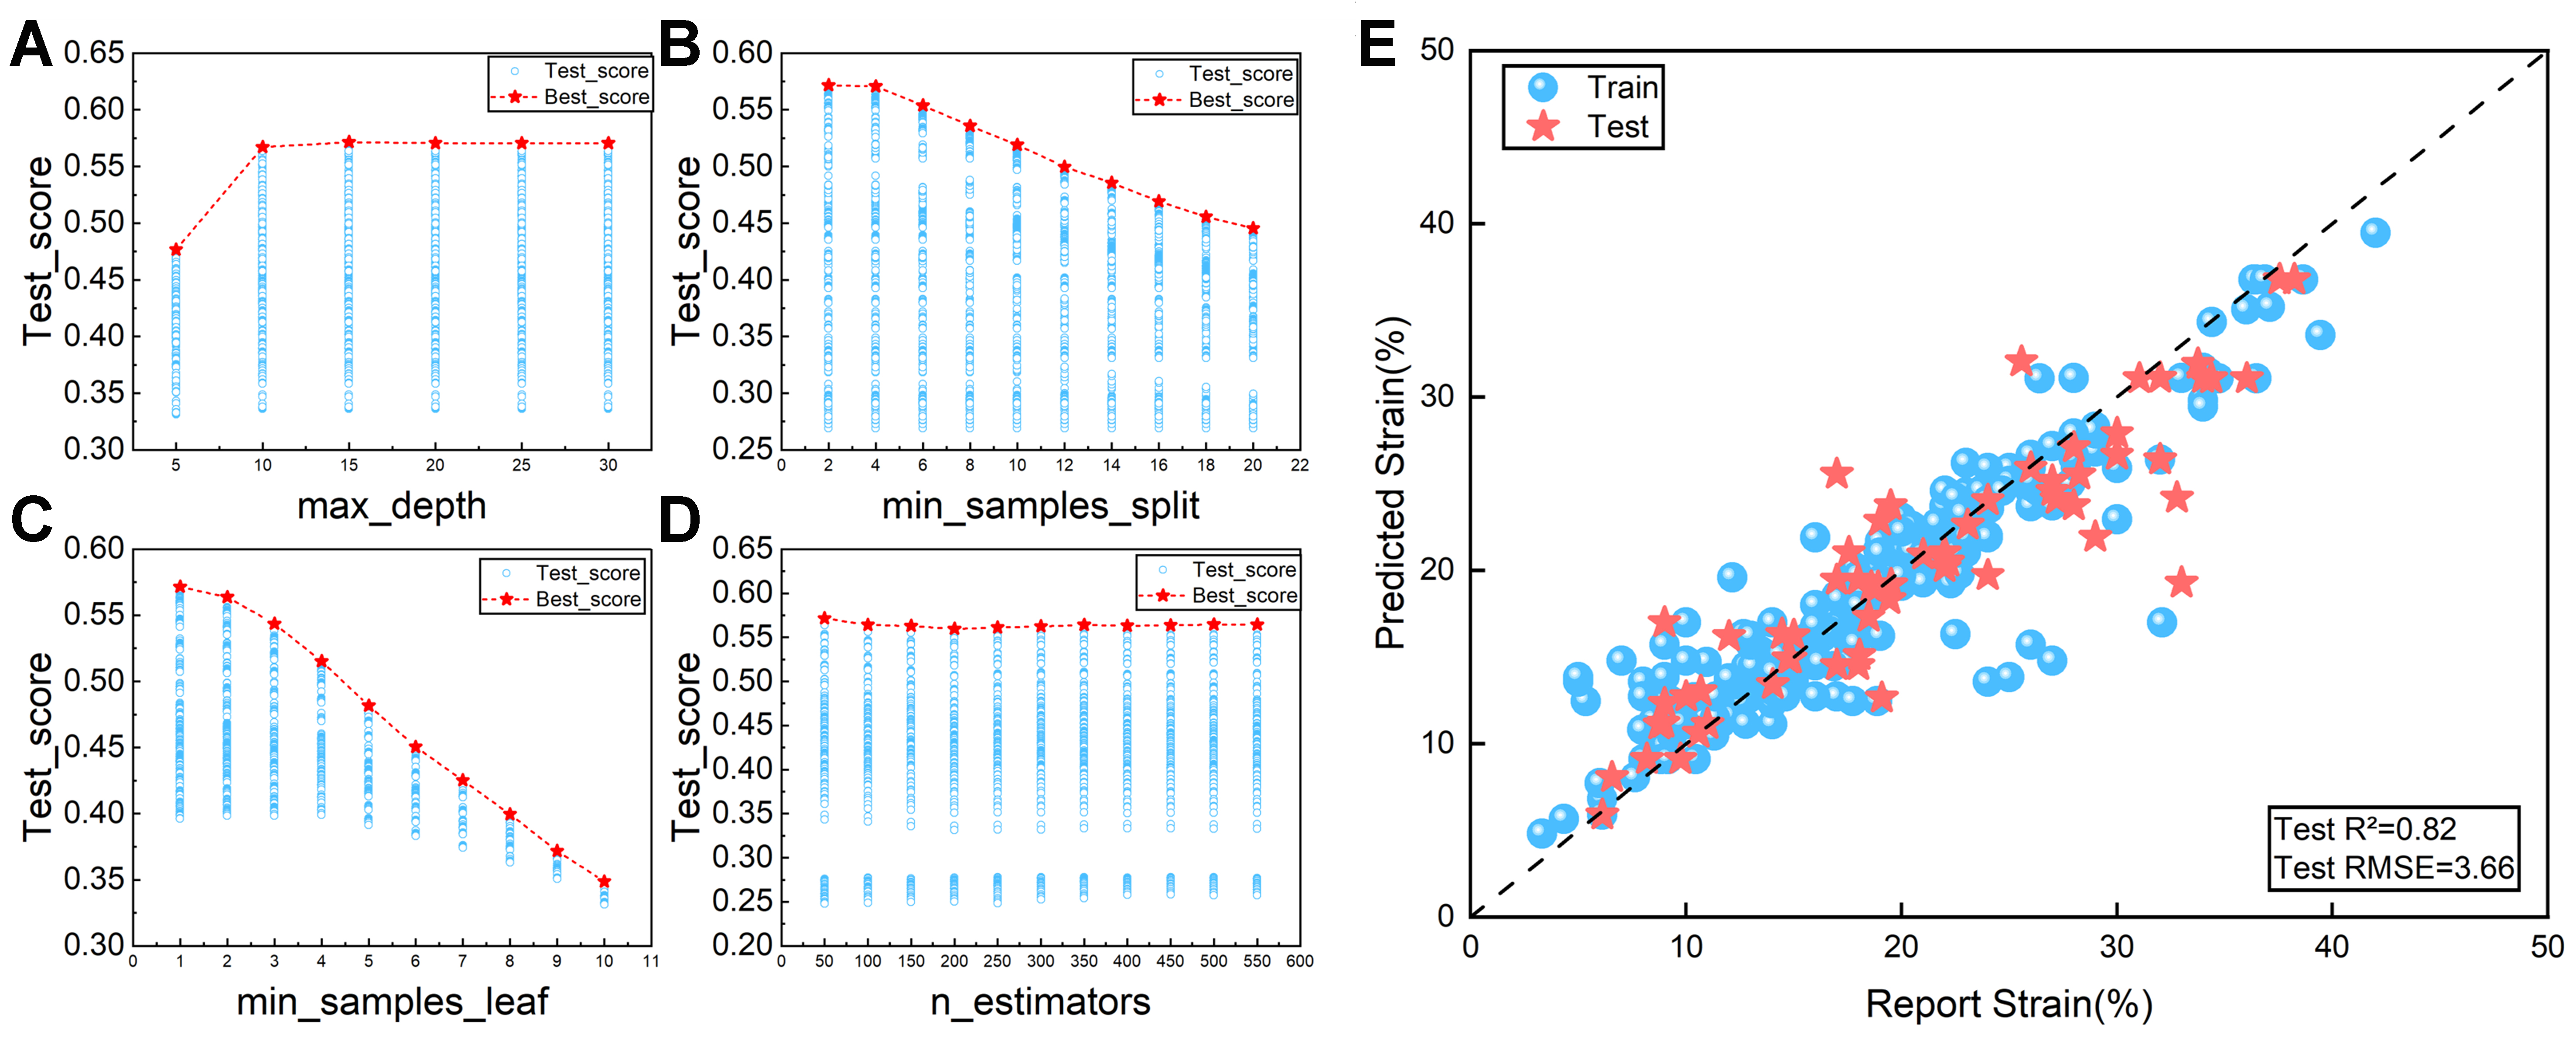
Figure 11. Four-parameter hyperparameter optimization was performed on the random forest model fitted to the plastic strain dataset. (A) Maximum depth; (B) Minimum samples segmentation; (C) Minimum sample leaf; (D) n_estimators; (E) Strength prediction graph of the best RF model under the optimal combination of hyperparameters. RF: Random forest; R2: the coefficient of determination; RMSE: root mean square error.
To verify model robustness and rule out potential overfitting, learning curves for both strength (GBRT) and ductility (RF) models were analyzed [Figure 12]. Both models exhibited rapid convergence, with test set errors stabilizing after approximately 50 iterations. Notably, despite the typical gap between training and testing errors inherent in ensemble methods, the test error curves remained flat without upward trends as model complexity increased. This behavior confirms that the models effectively learned the underlying composition-property relationships without overfitting to noise, ensuring their generalizability to unseen data.
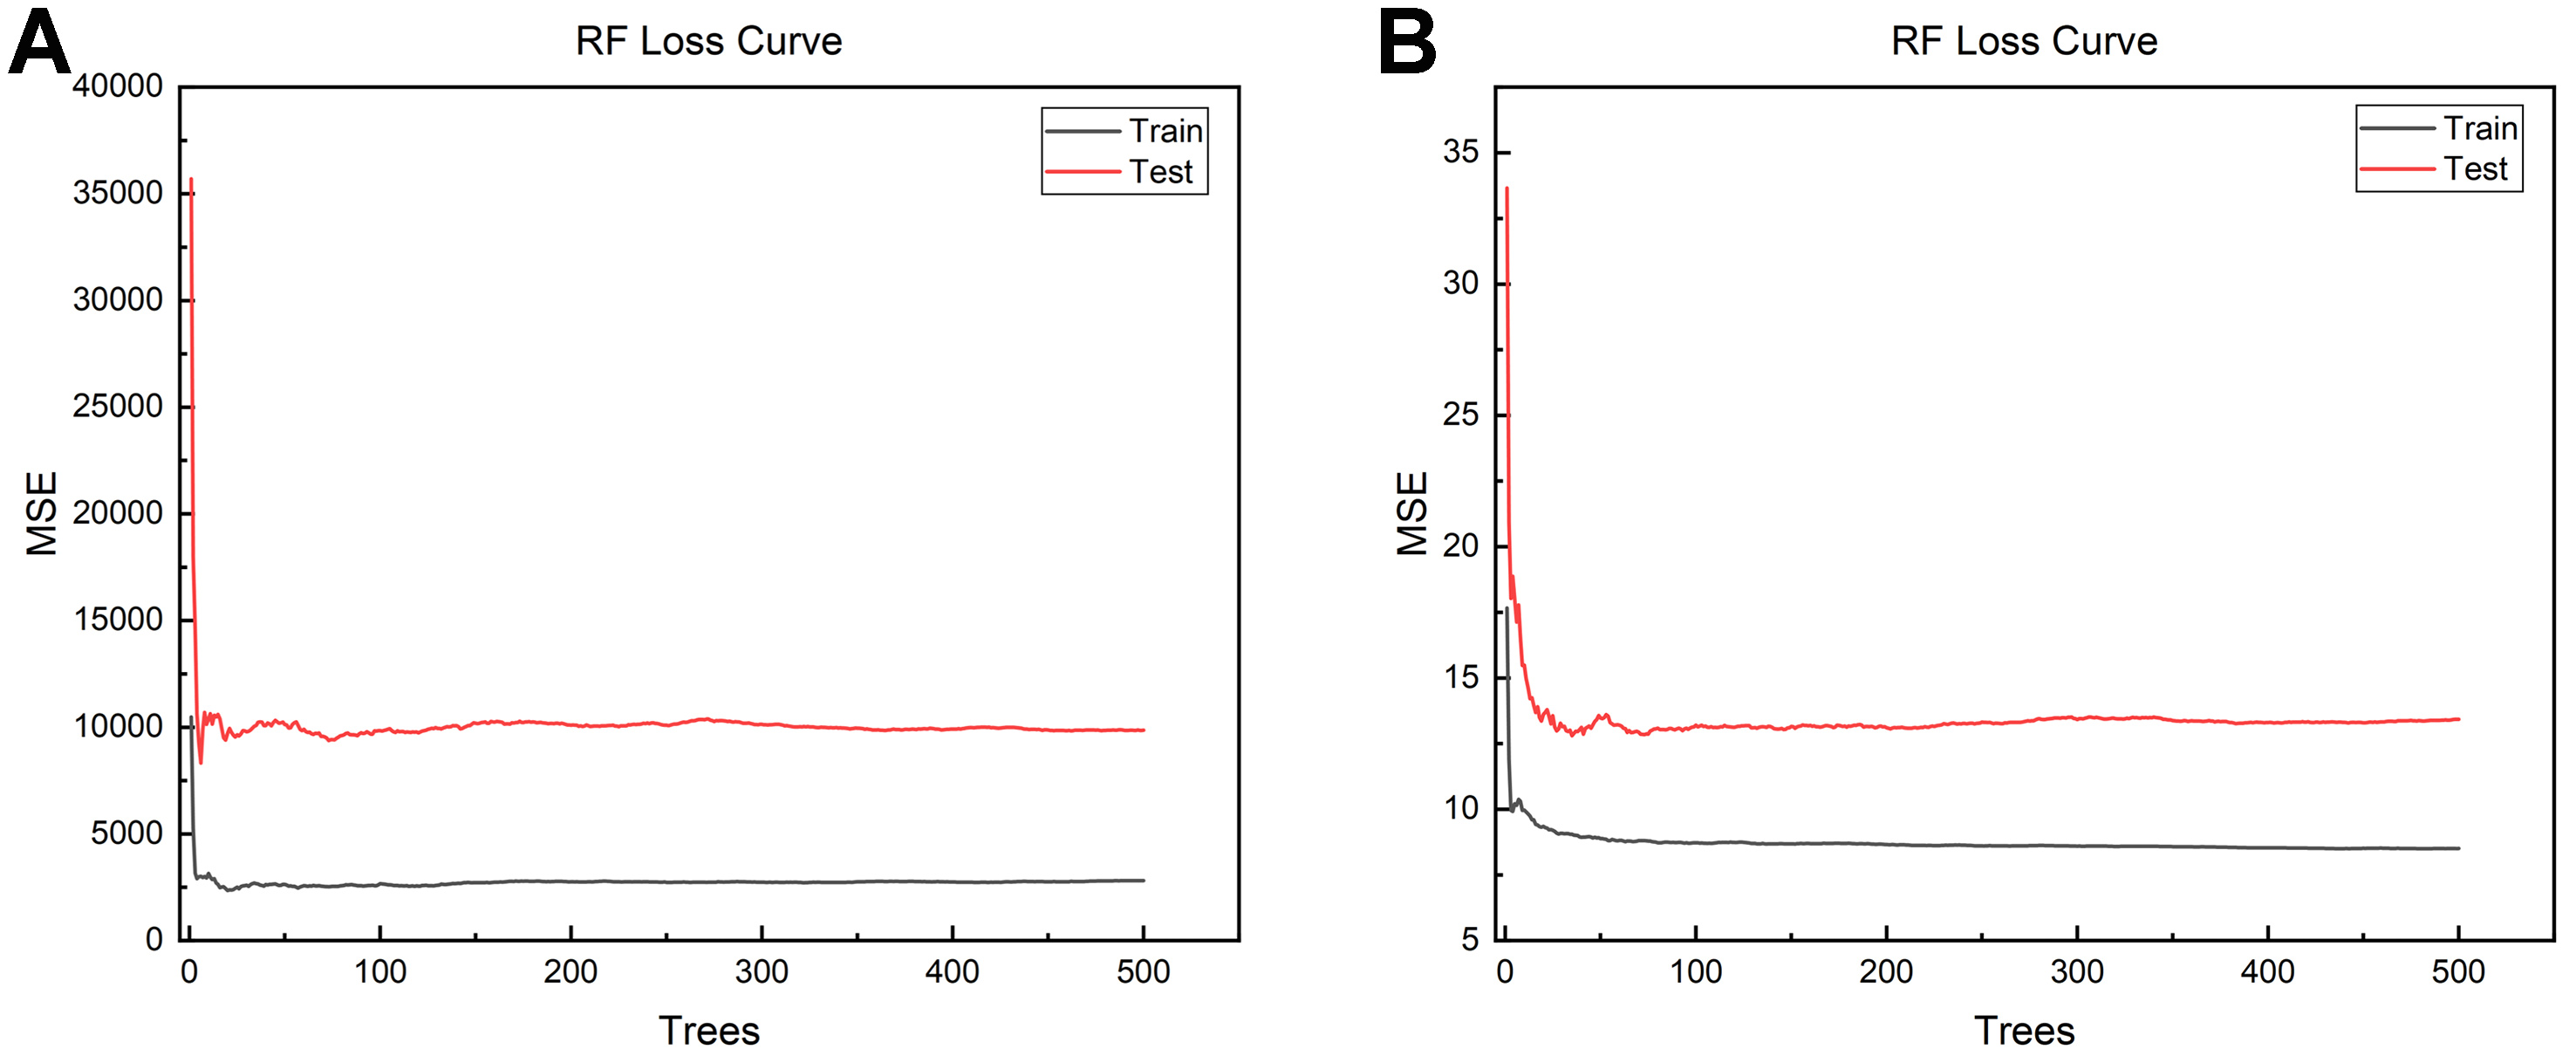
Figure 12. Loss curves of the RF models during KPP screening. (A) Strength model; (B) Ductility model. RF: Random forest; KPP: key performance parameter; MSE: mean squared error.
ML model construction for multi-objective optimization and SHapley Additive exPlanations importance analysis
To construct predictive models based on composition-domain knowledge features, proportional elemental contents are integrated with domain-derived key features to form composite descriptors. This integration not only satisfies the intrinsic requirements of genetic algorithms for multi-objective optimization, but also incorporates domain knowledge to enhance model accuracy and interpretability. To better fit the multi-objective optimization algorithm, model performance was compared across three datasets: “Composition”, “KPP”, and “omposition + KPP” [Table 7]. Compared with models trained solely on alloy composition, the “Composition + Domain Knowledge” feature set improves the test R2 for strength while maintaining a high test R2 for ductility, and simultaneously reduces overfitting. This confirms that introducing physics-informed descriptors is beneficial, even under limited data conditions.
Comparison of model performance trained on three datasets: “Composition”, “KPP”, and “Composition + KPP”
| Dataset | Target property | Model | Train | Test | ||
| R2 | RMSE | R2 | RMSE | |||
| Composition | Strength (MPa) | RF | 0.83 | 107.06 | 0.12 | 156.62 |
| Plasticity (%) | RF | 0.34 | 6.22 | 0.18 | 7.78 | |
| KPP | Strength (MPa) | RF | 0.95 | 51.85 | 0.89 | 98.96 |
| Plasticity (%) | RF | 0.85 | 2.95 | 0.82 | 3.63 | |
| Composition + KPP | Strength (MPa) | GBRT | 0.96 | 44.12 | 0.9 | 87.32 |
| Plasticity (%) | RF | 0.86 | 2.92 | 0.82 | 3.63 | |
Based on the KPPs governing the strength and ductility of titanium alloys, new datasets for each property were established. The strength dataset includes the features {alloy composition, strain rate, Fermi level, Ω}, whereas the ductility dataset comprises {alloy composition, strain rate, B/G ratio, ΔHmix}. The twelve previously defined ML models were then employed for model fitting, and SHapley Additive exPlanations (SHAP) value-based importance analyses were performed to evaluate the contribution of each feature to the predictions.
Figure 13 illustrates the screening results obtained from the new strength model, which integrates compositional and domain knowledge-based features. Figure 13A and B summarizes the performance of twelve ML models on both the training and testing datasets. The GBRT model demonstrates the best predictive performance on the testing dataset, with an R2 value of 0.91 and an RMSE of 87 MPa, while also maintaining strong fitting performance on the training dataset [Figure 13C]. Notably, this model attains higher predictive accuracy (R2 > 0.9) than models relying on domain knowledge-based features (R2 = 0.89), confirming the superior predictive capability of the combined “Composition + Domain Knowledge” feature set in strength modeling.
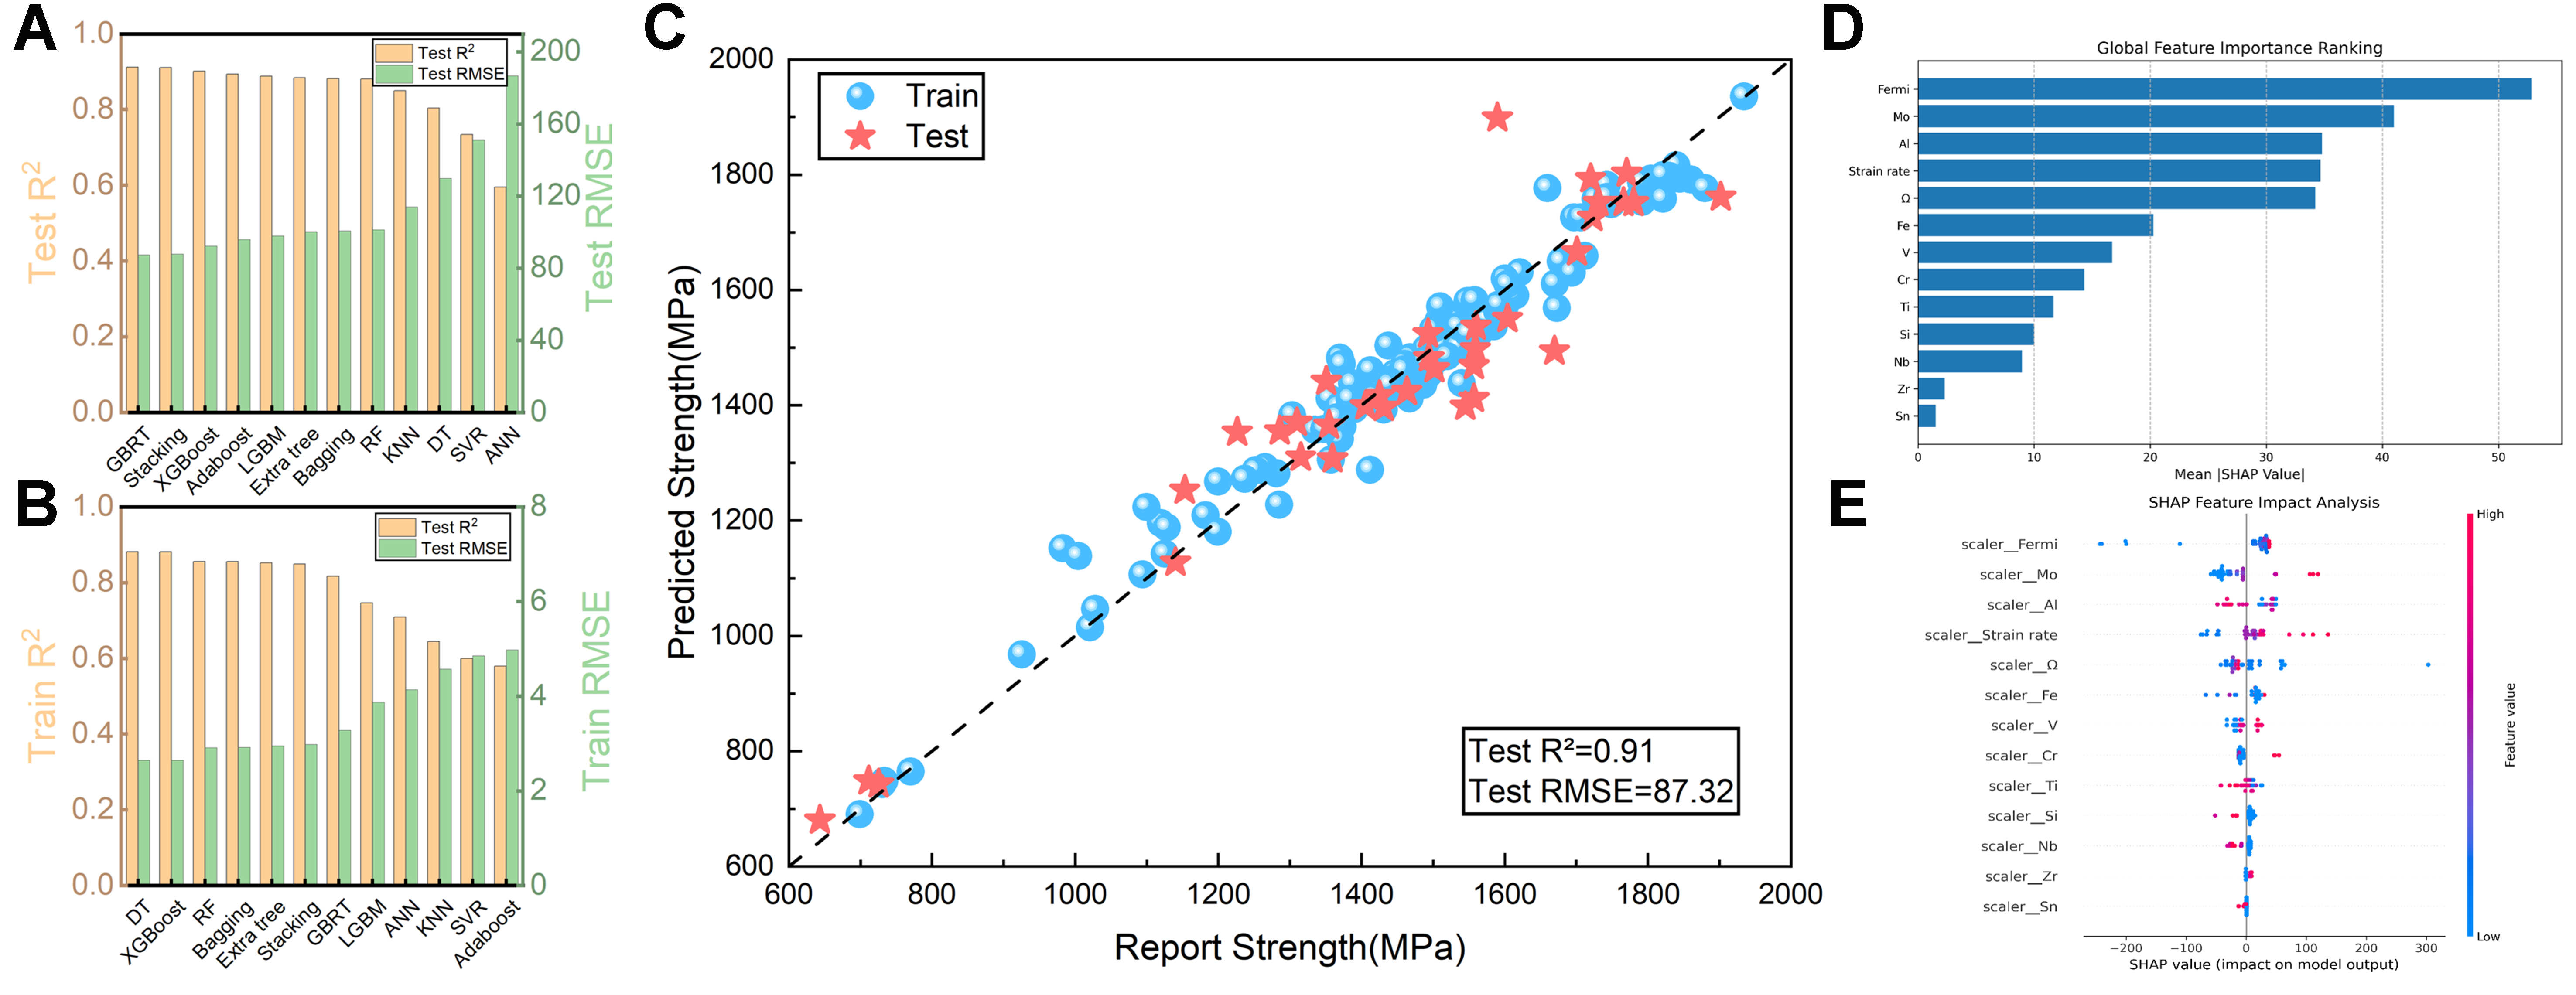
Figure 13. Performance comparison of 12 feature models in a new strength dataset constructed based on “components + domain knowledge” and analysis of the importance of SHAP values of the features. (A and B) are respectively the training set results and test set results of the 12 fitted machine learning models; (C) The optimal GBRT model fitting graph of the new strength dataset constructed based on “component + domain knowledge”; (D and E) are the bar charts and swarm charts for the importance analysis of the SHAP features of the new strength dataset constructed based on “component + domain knowledge”. SHAP: SHapley Additive exPlanations; GBRT: gradient boosting regression tree; R2: the coefficient of determination; RMSE: root mean square error; XGBoost: eXtreme gradient boosting; AdaBoost: adaptive boosting; LGBM: light gradient boosting machine; ExtraTree: extremely randomized tree; Bagging: bootstrap aggregating; RF: random forest; KNN: K-nearest neighbor; DT: decision tree; SVR: support vector regression; ANN: artificial neural network.
Figure 13D and E presents the SHAP value analysis for the dataset, encompassing both bar and beeswarm plots. Global SHAP feature analysis indicates that the Fermi energy level plays a dominant role in hindering dislocation motion and enhancing metallic bonding, serving as the principal parameter governing titanium alloy strength. Samples with high Fermi energy levels are concentrated in the positive SHAP region, whereas low-energy samples appear in the negative region, confirming a monotonic strengthening effect associated with the electronic structure. Molybdenum appears as the second most influential factor, exhibiting a narrow band-shaped distribution in the high SHAP region, which reflects a stable linear strengthening contribution from lattice distortion and dislocation pinning effects. The olive-shaped SHAP distribution for aluminum suggests the existence of an optimal compositional window where strengthening is maximized; outside this range, insufficient aluminum reduces age-hardening effects, while excessive aluminum promotes the precipitation of brittle phases. The strain rate exhibits a distinct threshold behavior, with samples subjected to high strain rates densely clustered in the positive SHAP region, indicating that strength enhancement primarily results from suppression of dynamic recovery and accumulation of dislocations. Below this threshold, static recovery dominates, leading to softening. Furthermore, Ω data points are densely concentrated in regions of high SHAP values, confirming a positive correlation between ordered Ω structures and the strengthening of titanium alloys.
The selection of the novel ductility model based on the combined “Composition + Domain Knowledge” framework is presented in Figure 14. Figure 14A and B summarizes the analytical outcomes for the training and testing results across twelve ML models. As illustrated in Figure 14C, the RF model exhibits the best predictive performance on the testing dataset, achieving an R2 value of 0.89 and an RMSE of 3.63%, while maintaining consistent accuracy on the training set. These results also substantiate that integrating compositional information as an additional feature, together with the optimal feature subset, does not lead to noticeable data degradation, as no significant reduction in accuracy is observed compared with models utilizing only domain knowledge-based features. Furthermore, SHAP value analysis, including both bar plots and beeswarm plots for the “Composition + Domain Knowledge” feature set [Figure 14D and E], provides additional validation for the reliability and interpretability of the proposed model.
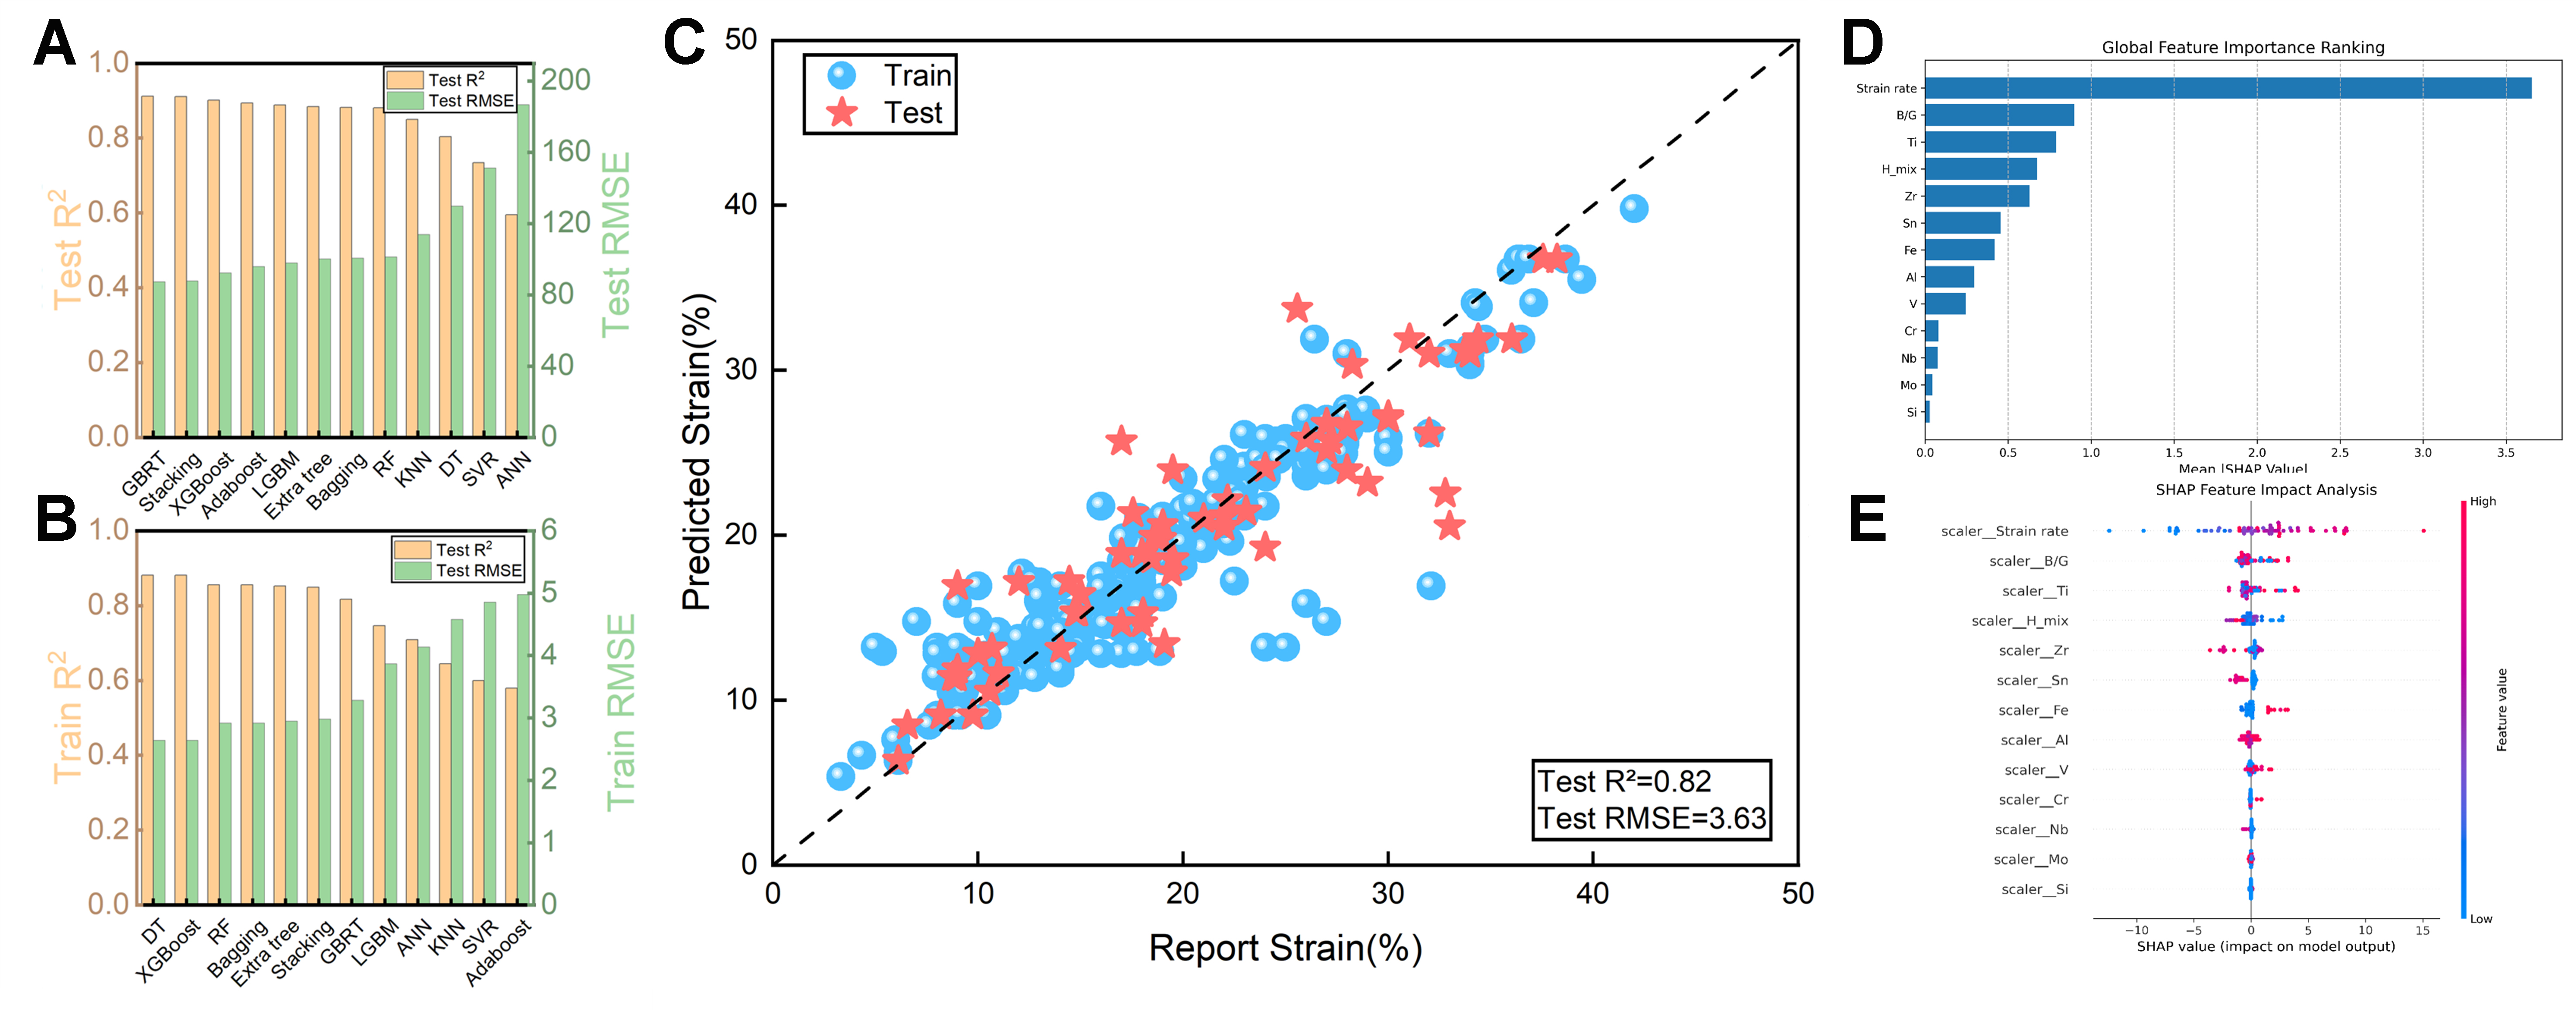
Figure 14. Performance comparison of 12 feature models in a new plastic strain dataset constructed based on “components + domain knowledge” and analysis of the importance of SHAP values of the features. (A and B) are respectively the training set results and test set results of the 12 fitted machine learning models; (C) The optimal RF model fitting graph of the new plastic dataset constructed based on “components + domain knowledge”; (D and E) are the bar charts and bee colony plots for the SHAP importance analysis of the new plastic strain dataset constructed based on “component + domain knowledge”. SHAP: SHapley Additive exPlanations; RF: random forest; R2: the coefficient of determination; RMSE: root mean square error; GBRT: gradient boosting regression tree; XGBoost: eXtreme gradient boosting; AdaBoost: adaptive boosting; LGBM: light gradient boosting machine; ExtraTree: extremely randomized tree; Bagging: bootstrap aggregating; KNN: K-nearest neighbor; DT: decision tree; SVR: support vector regression; ANN: artificial neural network.
SHAP analysis confirms that strain rate is the dominant regulator of ductility, validating its role as a critical process parameter. The B/G ratio ranks as the second key factor. Its high values are concentrated in the continuous spectrum distribution of the positive SHAP region, revealing a stable positive correlation with ductility and highlighting its intrinsic value for assessing material ductility. Titanium content exhibits an olive-shaped nonlinear distribution, with low titanium concentrations densely clustered in the negative SHAP region and high titanium concentrations concentrated in the positive SHAP region. This pattern reveals an optimal concentration window for titanium in high-performance titanium alloys. The mixing enthalpy exhibits clear monotonic behavior. Negative values indicate strengthened atomic bonding, enhancing ductility, whereas positive values correspond to weakened bonding capacity, reducing deformability and ductility. Notably, traditional alloying elements Mo and Si exert minimal influence, while samples with high Al content cluster in the negative SHAP region, suggesting embrittlement risks. Zr exhibits neutral effects, while the influence of Fe is highly dependent on compositional synergies. Swarm plots further reveal a critical threshold effect for strain rate: high strain rates enhance ductility through dislocation slip, while low strain rates cause embrittlement due to dislocation pile-up. Deviations from the optimal titanium concentration promote brittle phase formation. Collectively, these patterns prove that optimizing ductility requires avoiding embrittlement thresholds while precisely controlling the composition-process synergy.
To rigorously assess the reliability of the ML models, particularly under high strain rate conditions, the predictive uncertainty for both impact strength (GBRT model) and ductility (RF model) was quantified. The test data were categorized into three regimes based on strain rate: Low (< 2,000 s-1), Medium (2,000-4,000 s-1), and High (> 4,000 s-1). The prediction results with 95%CIs (estimated via quantile loss for GBRT and ensemble variance for RF) are illustrated in Figure 15. In the Medium regime (2,000-4,000 s-1), which encompasses the target design strain rate of 3,000 s-1, the strength model demonstrates excellent agreement between predicted and experimental values, with minimal uncertainty. The ductility model, reflecting the inherently higher stochasticity of plastic deformation, shows wider CIs but still effectively captures the experimental data points. These results confirm that 3,000 s-1 lies within the robust interpolation domain of the models. Conversely, in the High regime (> 4,000 s-1), a marked increase in predictive uncertainty is observed for both properties, characterized by significantly wider error bars and larger residuals. This quantitative evidence aligns with data scarcity under extreme conditions and justifies the design strategy adopted in this work: by limiting the optimization target to 3,000 s-1, the risks associated with extrapolation are effectively mitigated, ensuring that the designed alloys are based on high-confidence predictions.
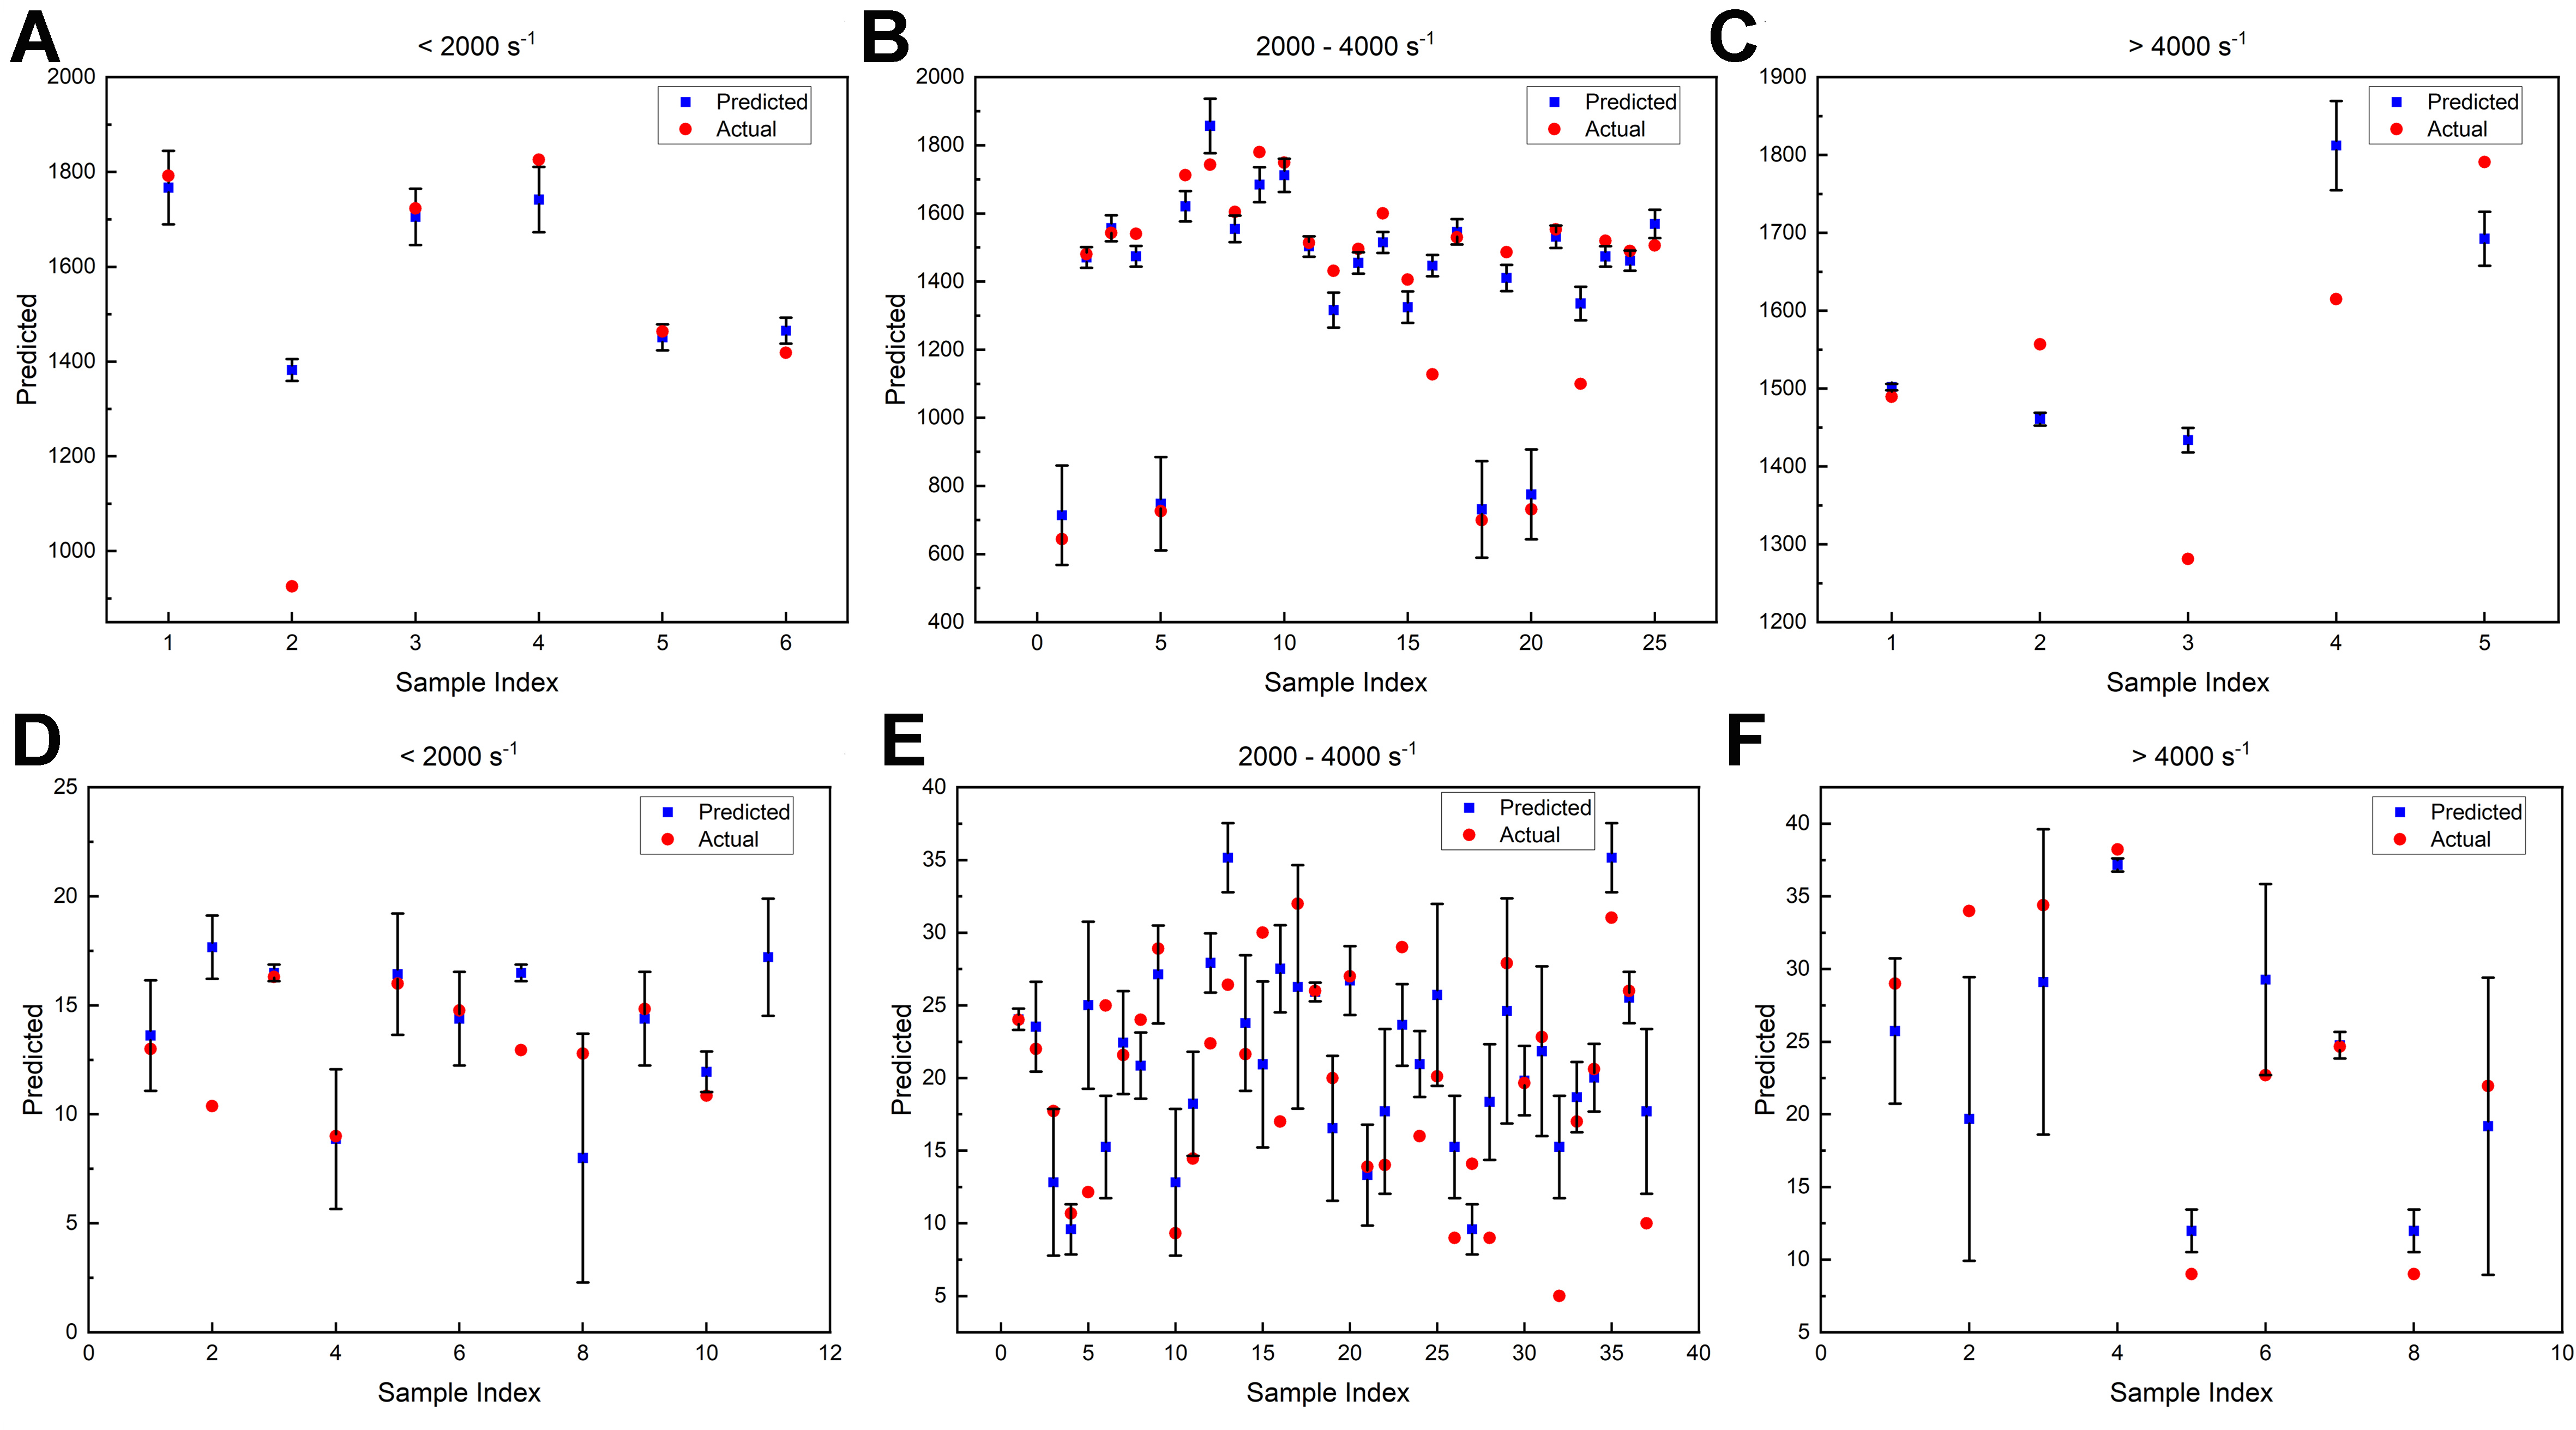
Figure 15. Confidence analysis using error bars for the GBRT strength model and RF plasticity model based on “KPP + Composition”. (A-C) CIs for the GBRT strength model; (D-F) CIs for the RF plasticity model. GBRT: Gradient boosting regression tree; RF: random forest; KPP: key performance parameter; CIs: confidence intervals.
As illustrated in Figure 16A, the GBRT model demonstrates a healthy learning process, where the test error decreases rapidly and stabilizes after approximately 100 iterations, showing no sign of divergence even as the training error continues to decrease. Similarly, Figure 16B confirms the stability of the RF model, with the test error converging quickly and remaining flat beyond 50 trees. The absence of an upward trend in the test loss curves for both models indicates that they effectively capture the underlying composition-property relationships without overfitting to noise, thereby ensuring strong generalizability.
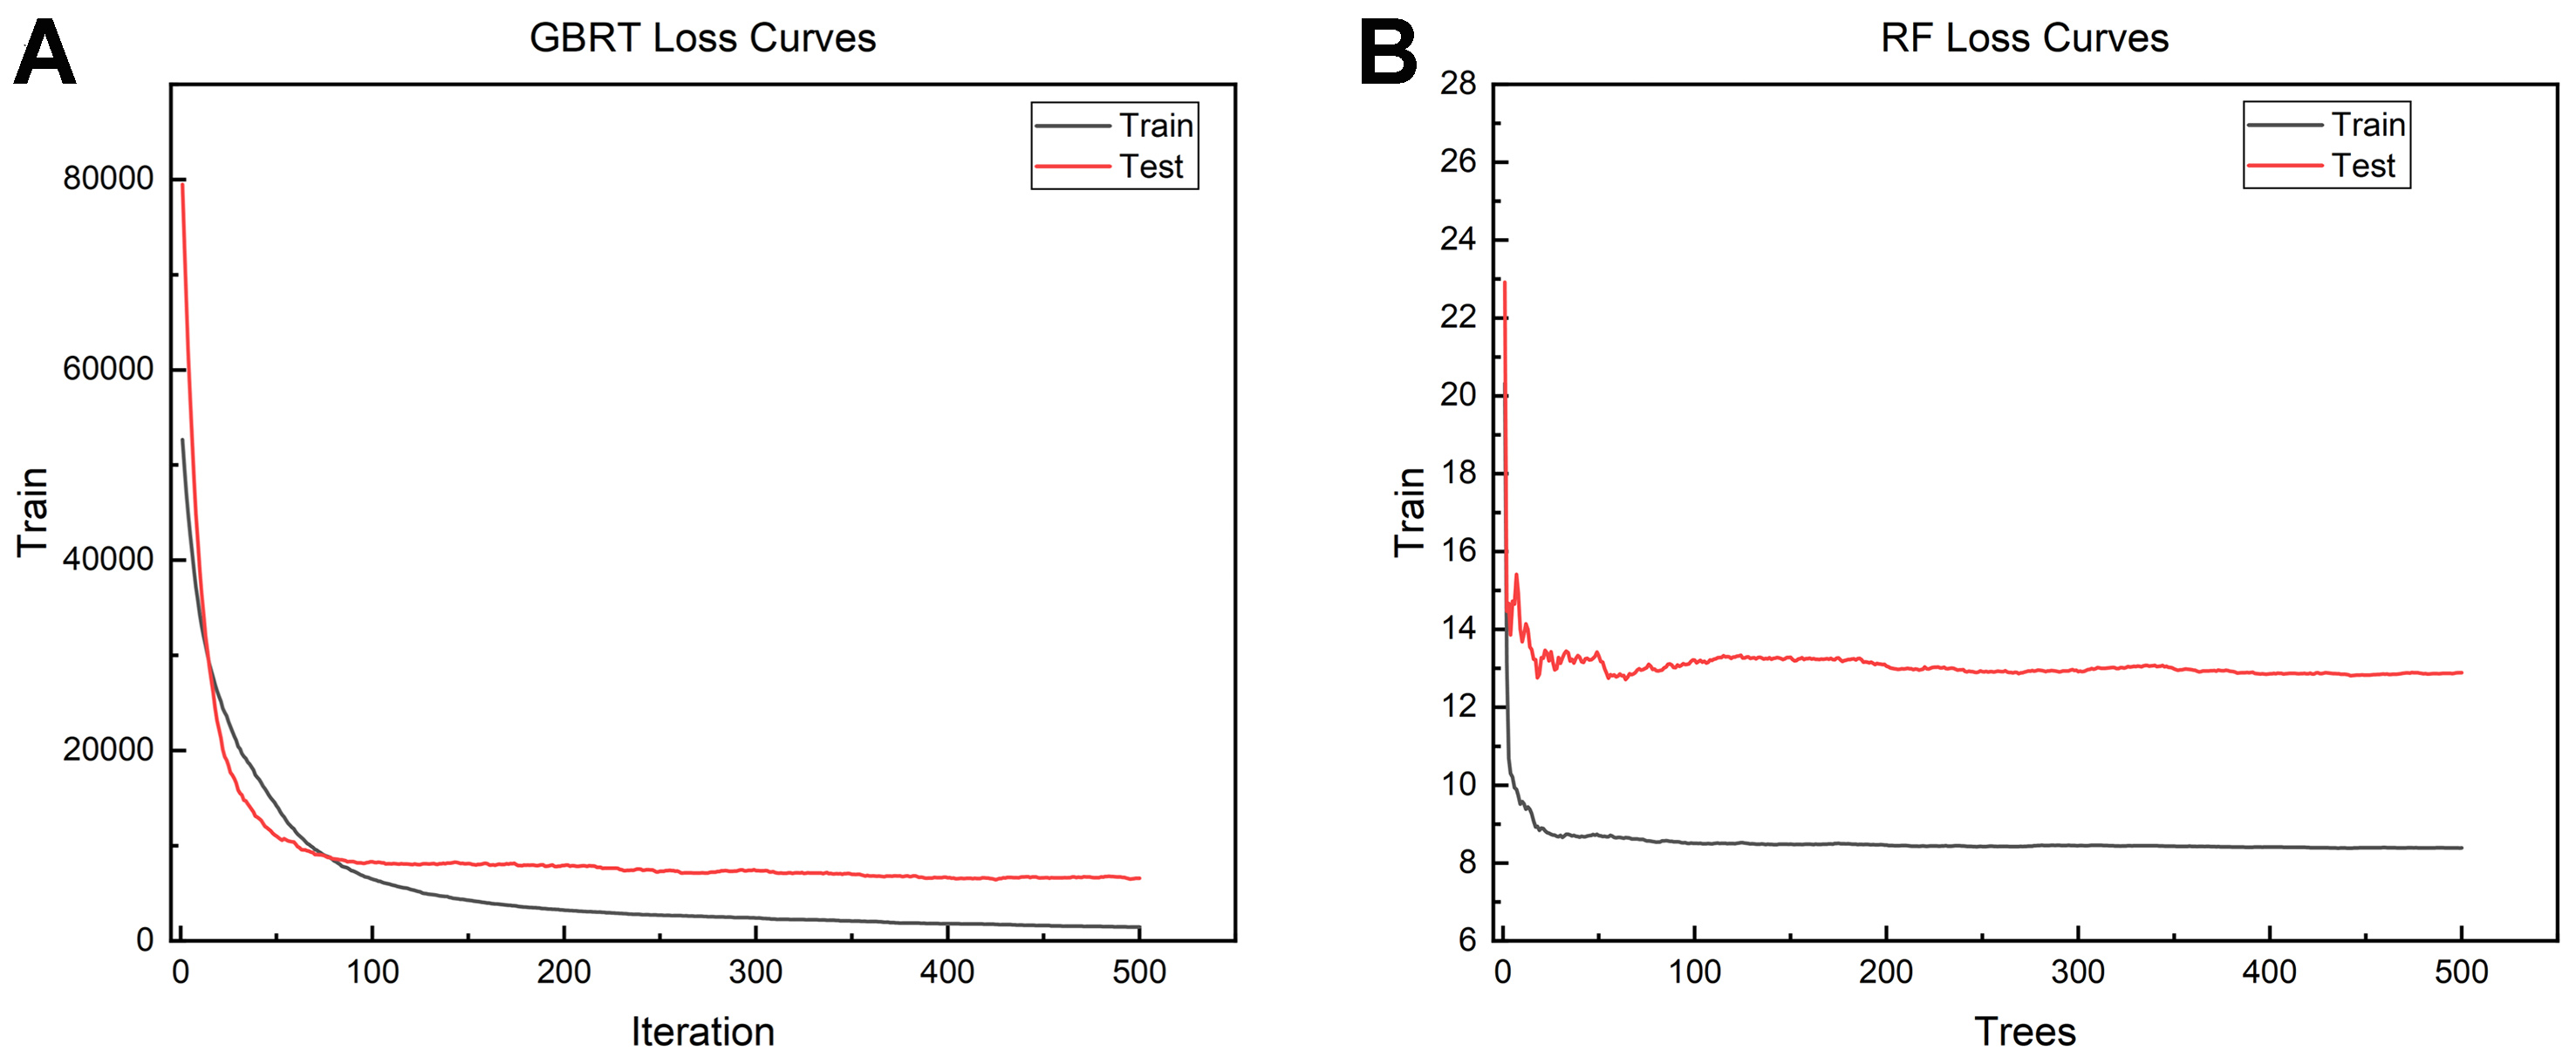
Figure 16. Learning curves of the optimal strength and ductility models during multi-objective optimization. (A) GBRT model for strength; (B) RF model for plasticity. GBRT: Gradient boosting regression tree; RF: random forest.
Exploring the proto frontier using the NSGA-II model and conducting theoretical verification
The optimal strength and ductility prediction models, developed by integrating domain knowledge and alloy composition, were incorporated into the NSGA-II multi-objective optimization framework. Design constraints consistent with near-α titanium alloy equivalence criteria were imposed to identify alloy compositions with superior performance at a strain rate of 3,000 s-1. As shown in Figure 17A, the explored population densely covers most of the feasible design space, while the population at the 500th generation forms a distinct convex Pareto front, confirming the intrinsic strength-ductility trade-off in titanium alloys and validating the predictive accuracy of the integrated models. Among the 228,516 alloy candidates satisfying the imposed constraints, fourteen Pareto-optimal solution sets were identified [Table 8]. These Pareto‑optimal alloys span a broad range of strength and ductility, reflecting different trade‑off preferences along the Pareto front: some solutions favor maximum strength at the expense of ductility, while others prioritize enhanced ductility with moderate strength. In this work, the alloy Ti-3.3Al-2V-1Mo-4.4Zr-2.1Sn-0.4Fe-0.2Nb-0.04Si (≈ 1,600 MPa, ≈ 26% ductility) is highlighted as a representative compromise solution for subsequent constitutive analysis, while the other Pareto points provide alternative design options. Most of these alloys belong to the Ti-Al-V-Mo-Zr-Sn near-α titanium alloy system. At a strain rate of 3,000 s-1, these alloys exhibit a favorable balance between strength and ductility. Among these, alloys located in the middle of the Pareto frontier maintain a stable compressive strength of approximately 1,600 MPa and exhibit a plastic strain rate of over 26%, significantly surpassing the mechanical properties of conventional titanium alloys. Moreover, comparison between Pareto-front alloys and existing TA- and TC-series titanium alloys shows that the latter are primarily distributed around a Mo equivalent of approximately 2.5 in [Figure 17B]. Notably, several Pareto-front alloys fall within the common TA alloy cluster, whereas others form a distinct cluster, highlighting the superior exploratory capacity of the multi-objective optimization strategy in discovering new alloy compositions. The calculated phase fractions of the eight most balanced Pareto-front alloys are presented in Figure 17C. Among these, Ti-3.3Al-2V-1Mo-4.4Zr-2.1Sn-0.4Fe-0.2Nb-0.04Si presents the most favorable balance between phase strength and ductility, while maintaining a moderate phase transformation temperature. Consequently, this alloy is identified as a promising candidate for subsequent experimental verification and constitutive model fitting.
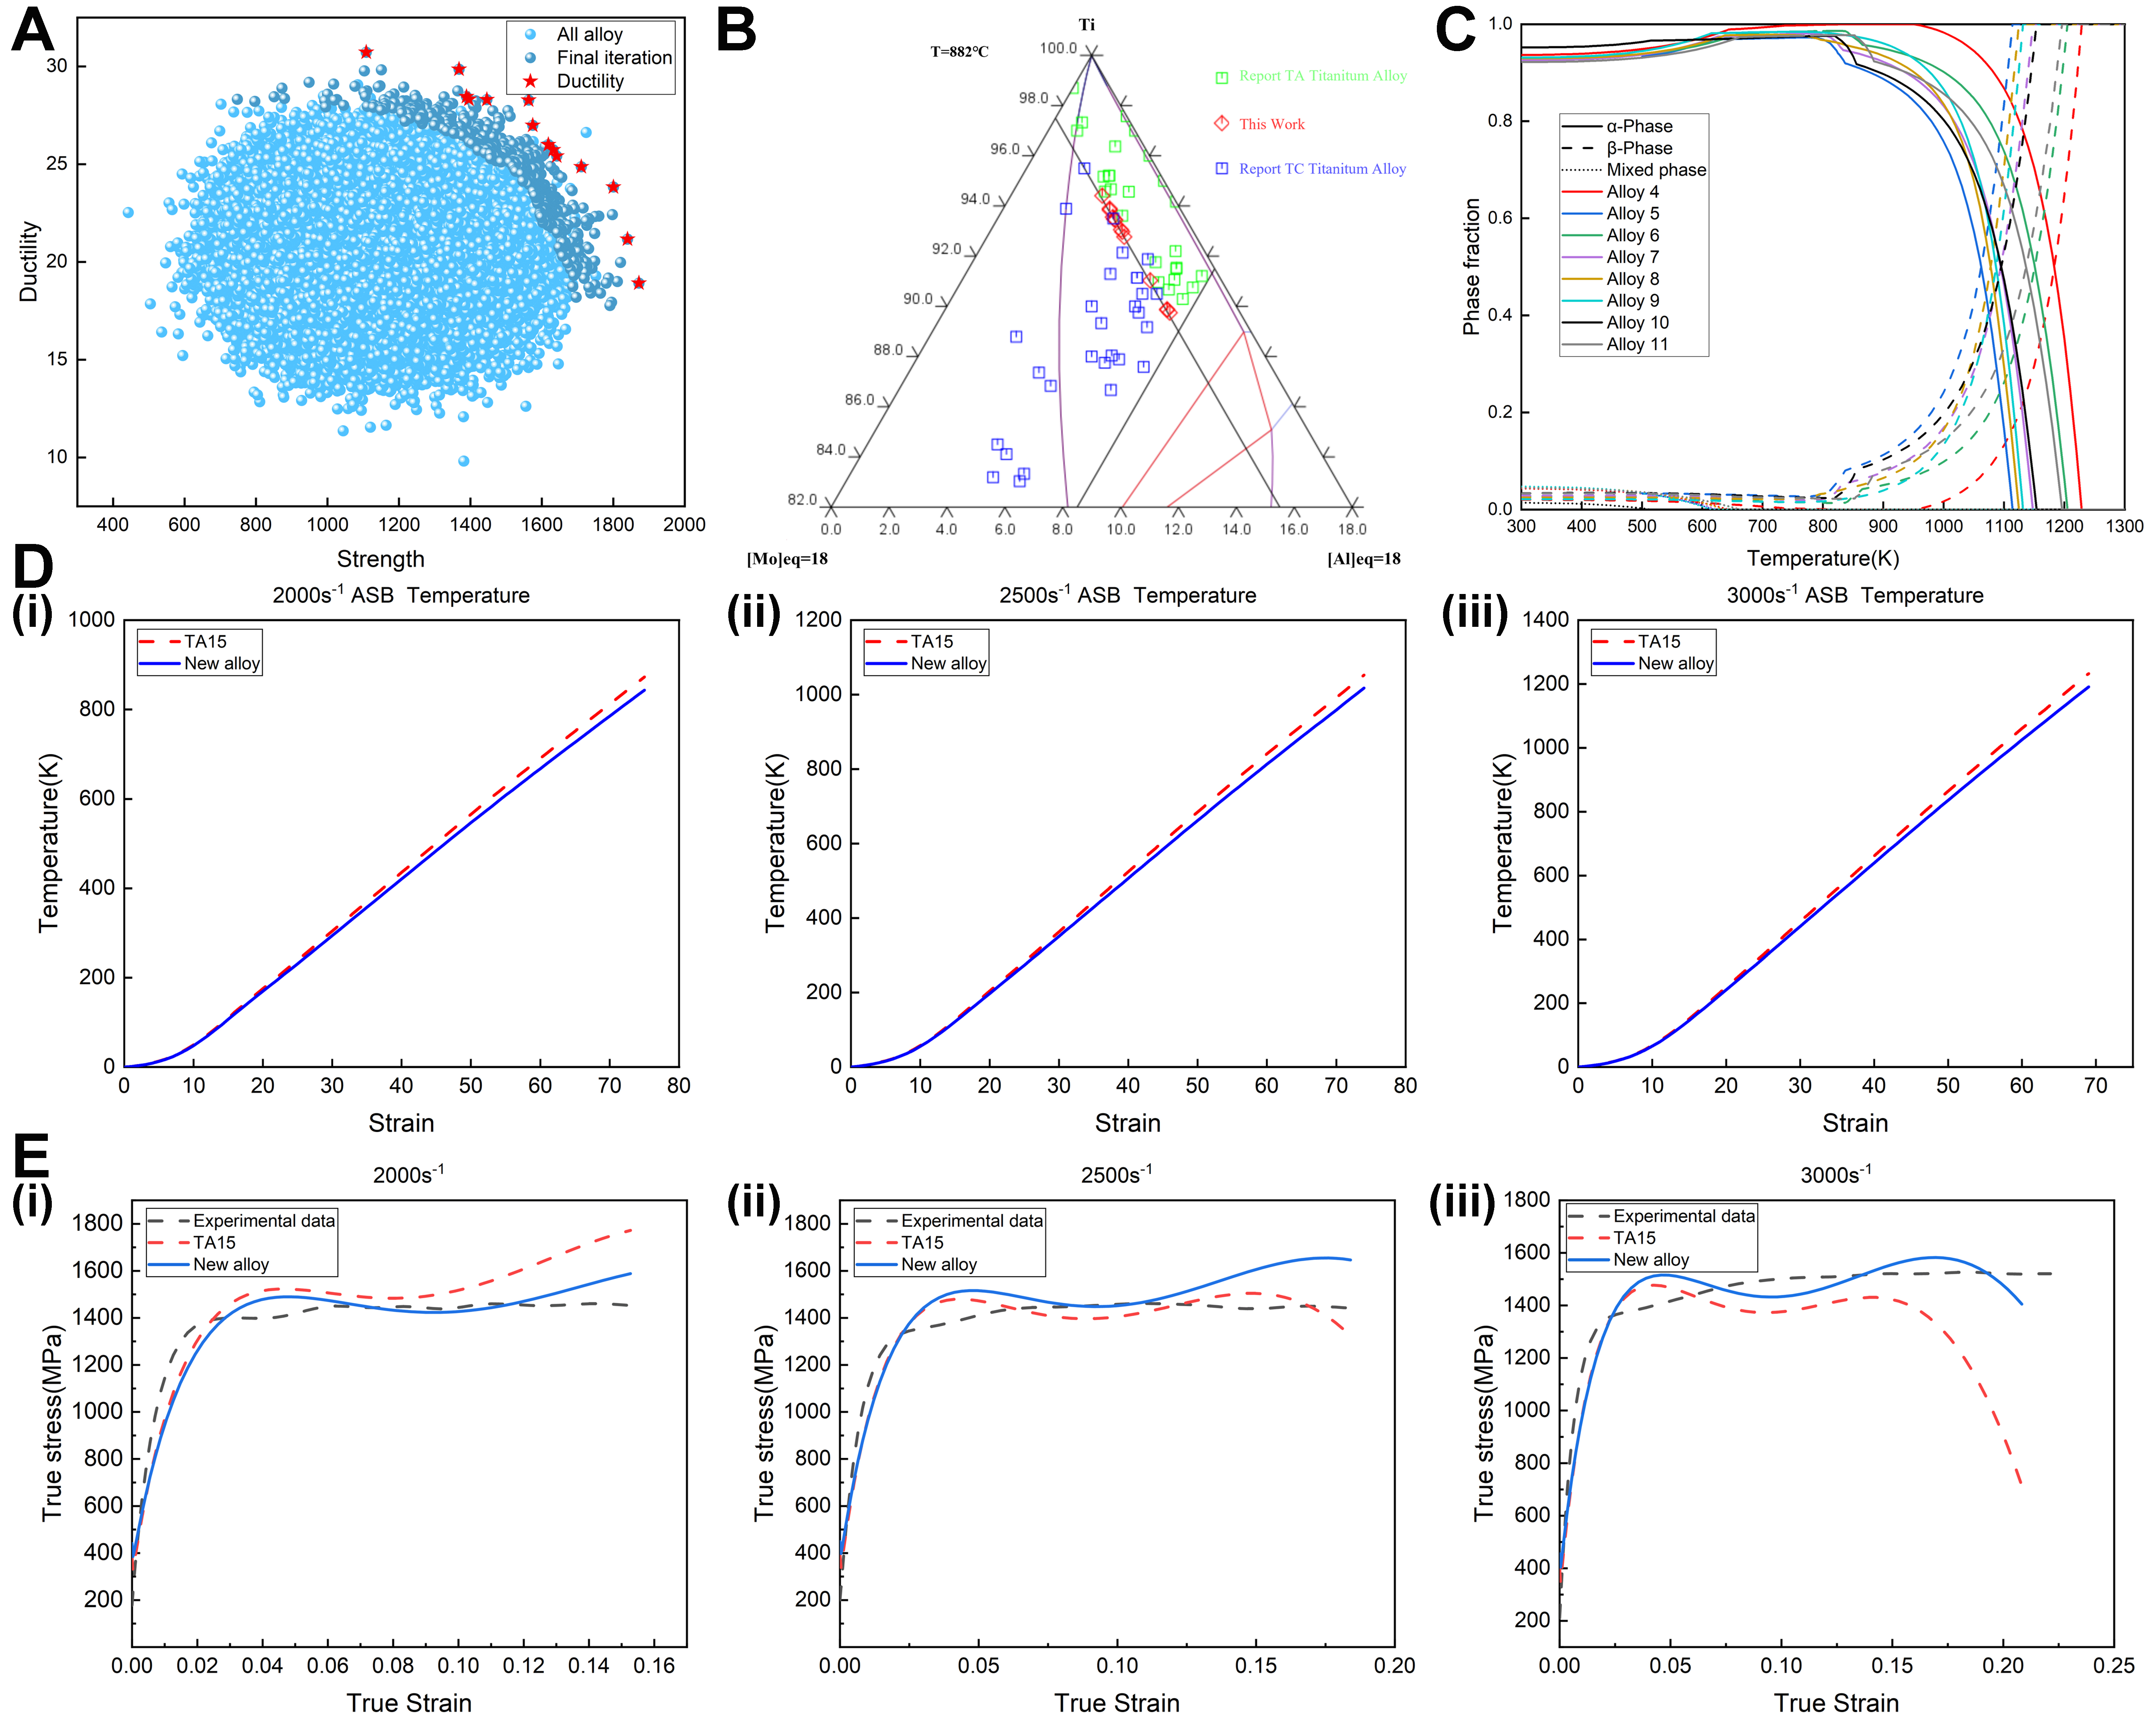
Figure 17. Results of multi-objective optimization, thermodynamic analysis, and constitutive modeling for the novel alloy and TA15 alloy. (A) Pareto front obtained using NSGA-II; (B) Phase distribution comparison between Pareto-optimal alloys and existing TA/TC alloys; (C) Thermodynamic phase fraction diagram of the 5-11 alloy; (D and E) Adiabatic temperature rise and true stress- strain curves of the optimized alloy and the TA15 alloy at different strain rates: (1) 2,000 s-1; (2) 2,500 s-1; (3) 3,000 s-1. NSGA-II: Nondominated sorting genetic algorithm II; TA: titanium alpha; TC: titanium composite; ASB: adiabatic shear band.
Pareto-optimal alloy compositions obtained after 500 generations with a population size of 500 using the multi-objective optimization algorithm
| Number | Ti | Al | V | Mo | Zr | Fe | Si | Sn | Nb | Cr | [Al]eq | [Mo]eq | Strength (MPa) | Ductility (%) |
| 1 | 84.93 | 5.1 | 2 | 1 | 4.4 | 0.38 | 0.09 | 2.0 | 0.1 | 0 | 6.51 | 2.46 | 1,871.45 | 18.92 |
| 2 | 86.32 | 2.1 | 2 | 1 | 4.3 | 0.67 | 0.01 | 3.4 | 0.2 | 0 | 3.95 | 2.49 | 1,839.68 | 21.17 |
| 3 | 89.09 | 2.2 | 2 | 1 | 4.3 | 0.68 | 0.03 | 0.7 | 0.0 | 0 | 3.16 | 2.43 | 1,800.20 | 23.83 |
| 4 | 84.16 | 6.4 | 2 | 1 | 4.3 | 0.02 | 0.02 | 2.1 | 0.0 | 0 | 7.82 | 2.43 | 1,710.39 | 24.87 |
| 5 | 87.16 | 2.1 | 2 | 1 | 4.4 | 0.61 | 0.03 | 2.6 | 0.1 | 0 | 3.71 | 2.46 | 1,641.62 | 25.41 |
| 6 | 82.89 | 5.8 | 2 | 1 | 4.4 | 0.38 | 0.03 | 3.4 | 0.1 | 0 | 7.67 | 2.46 | 1,631.74 | 25.74 |
| 7 | 86.56 | 3.3 | 2 | 1 | 4.4 | 0.40 | 0.04 | 2.1 | 0.2 | 0 | 4.74 | 2.49 | 1,618.26 | 26.00 |
| 8 | 86.71 | 2.2 | 2 | 1 | 4.4 | 0.16 | 0.03 | 3.3 | 0.2 | 0 | 4.04 | 2.49 | 1,574.51 | 26.99 |
| 9 | 88.00 | 2.2 | 2 | 1 | 4.6 | 0.03 | 0.07 | 2.1 | 0.0 | 0 | 3.68 | 2.43 | 1,563.12 | 28.28 |
| 10 | 89.64 | 3.3 | 2 | 1 | 1.4 | 0.77 | 0.09 | 1.7 | 0.1 | 0 | 4.10 | 2.46 | 1,446.11 | 28.31 |
| 11 | 82.52 | 5.8 | 2 | 1 | 4.4 | 0.75 | 0.03 | 3.4 | 0.1 | 0 | 7.67 | 2.46 | 1,395.75 | 28.32 |
| 12 | 88.97 | 3.6 | 2 | 1 | 2.6 | 0.04 | 0.09 | 1.6 | 0.1 | 0 | 4.57 | 2.46 | 1,388.99 | 28.46 |
| 13 | 83.13 | 5.8 | 2 | 1 | 4.4 | 0.12 | 0.05 | 3.4 | 0.1 | 0 | 7.67 | 2.46 | 1,368.26 | 29.86 |
| 14 | 86.07 | 2.6 | 2 | 1 | 4.1 | 0.52 | 0.01 | 3.6 | 0.1 | 0 | 4.49 | 2.46 | 1,108.44 | 30.72 |
To validate the potential of Ti-3.3Al-2V-1Mo-4.4Zr-2.1Sn-0.4Fe-0.2Nb-0.04Si, the J–C model was employed to predict its potential properties. The phase fractions and specific heat capacity of the newly designed alloy were calculated using Thermo-Calc thermodynamic software [Figure 17C]. The results show a melting point of 1,901.27 K, a specific heat capacity of 25.32 J/(mol·K), and a density of 4.54 g/cm3. Experimental data for the TA15 titanium alloy at strain rates of 2,000, 2,500, and 3,000 s-1 were used as reference data for fitting the JC-P4 constitutive model. The newly designed alloy was subsequently fitted for comparative analysis, with the results presented in Figure 17D(i)-E(iii). Figure 17D(i)-(iii) illustrates the adiabatic temperature rise of both TA15 and the new alloy under the three strain rates. The adiabatic temperature rise of the new alloy remains consistently lower than that of TA15 across all strain rates, indicating reduced heat generation from irreversible inelastic work during high-strain-rate deformation. This reduction effectively mitigates the tendency of adiabatic shear localization or holds the potential to decrease the adiabatic shear sensitivity. Figure 17E(i)-(iii) displays the fitted mechanical responses of both materials, revealing highly consistent trends. At a strain rate of 2,000 s-1, both alloys exhibit an initial hardening stage, followed by thermal softening and subsequent re-hardening, reflecting the interplay between strain-rate strengthening and thermal effects. However, at 2,500 and 3,000 s-1, the designed alloy achieves markedly higher strength levels than the TA15 alloy, demonstrating its potential as a superior alternative material for high-strain-rate applications. It should be noted that the present “calculation-validation-calculation” strategy introduces a degree of circularity, as the JC-P4 prediction for the new alloy partially depends on machine learning-based strength estimates. Consequently, the JC-P4 results should be regarded as a consistency check within a physics-informed modeling framework rather than as conclusive evidence of alloy performance. Future work should include direct high-strain-rate mechanical testing of the designed alloy for validation.
CONCLUSIONS
This study develops an interpretable multi-objective design framework for optimizing high-performance α-titanium alloys by integrating domain knowledge with data-driven ML approaches. By extracting critical physical descriptors - such as Fermi energy and strain rate - to construct high-precision RF models, and subsequently integrating these models into an NSGA-II optimization framework, over 200,000 candidate compositions were efficiently screened to identify a Pareto-optimal set of near-α Ti-Al-V-Mo-Zr-Sn alloys. These optimized compositions demonstrate superior dynamic strength and reduced adiabatic temperature rise compared to the benchmark TA15 alloy. Overall, this work establishes an effective and interpretable paradigm for accelerating the discovery of advanced alloys, offering a strategic pathway to address the strength-ductility trade-off under extreme conditions.
DECLARATIONS
Acknowledgments
This research was supported by the National Key Research and Development Program Project (No. 2024YFE0213600). The authors gratefully acknowledge this funding, which was instrumental in the study’s design, data collection, and analysis.
Authors’ contributions
Conceptualization, methodology, data curation, investigation, formal analysis, writing - original draft preparation: Liu, S.
Writing - original draft preparation, supervision, methodology, editing, validation, project administration, funding acquisition: Wang, W. Y.; Li, P.; Song, H.; Gao, X.
Data curation, investigation, formal analysis, writing - original draft preparation: Fan, X.; Ye, H.
Conceptualization, methodology, editing, project administration: Ibragim, M.
Conceptualization, supervision, methodology, editing, validation, project administration: Yar-Mukhamedova, G.; Zellele, D.
Supervision, conceptualization, methodology, editing, project administration, funding acquisition: Li, J.; Wang, W. Y.
All authors have read and agreed to the published version of the manuscript.
Availability of data and materials
The original contributions presented in this study are included in the article. Further inquiries can be directed to the corresponding authors.
AI and AI-assisted tools statement
Not applicable.
Financial support and sponsorship
This research was supported by the National Key Research and Development Program Project (No. 2024YFE0213600).
Conflicts of interest
Wang, W. Y. is an Editor on the Junior Editorial Board of the Journal of Materials Informatics. Wang, W. Y. was not involved in any steps of editorial processing, notably including the selection of reviewers, manuscript handling, and decision-making. The other authors declare that there are no conflicts of interest.
Ethical approval and consent to participate
Not applicable.
Consent for publication
Not applicable.
Copyright
© The Author(s) 2026.
REFERENCES
1. Clouet, E.; Caillard, D.; Chaari, N.; Onimus, F.; Rodney, D. Dislocation locking versus easy glide in titanium and zirconium. Nat. Mater. 2015, 14, 931-6.
3. Yu, Q.; Shan, Z. W.; Li, J.; et al. Strong crystal size effect on deformation twinning. Nature 2010, 463, 335-8.
4. Banerjee, D.; Williams, J. Perspectives on titanium science and technology. Acta. Mater. 2013, 61, 844-79.
5. Chen, R.; Tan, C.; You, Z.; et al. Effect of α phase on high-strain rate deformation behavior of laser melting deposited Ti-6.5Al-1Mo-1V-2Zr titanium alloy. Mater. Sci. Eng. A. 2019, 750, 81-90.
6. Zong, X.; Li, Z.; Li, J.; et al. High strain rate response of Ti-6.5Al-3.5Mo-1.5Zr-0.3Si titanium alloy fabricated by laser additive manufacturing. J. Alloys. Compd. 2019, 781, 47-55.
7. Huang, B.; Miao, X.; Luo, X.; Yang, Y.; Zhang, Y. Microstructure and texture evolution near the adiabatic shear band (ASB) in TC17 titanium alloy with starting equiaxed microstructure studied by EBSD. Mater. Charact. 2019, 151, 151-65.
8. Hao, F.; Liu, X.; Du, Y.; et al. Excellent dynamic mechanical properties of a newly developed titanium alloy with bimodal structure. J. Alloys. Compd. 2023, 961, 170980.
9. Tiamiyu, A.; Odeshi, A.; Szpunar, J. Multiple strengthening sources and adiabatic shear banding during high strain-rate deformation of AISI 321 austenitic stainless steel: effects of grain size and strain rate. Mater. Sci. Eng. A. 2018, 711, 233-49.
10. Li, Z.; Wang, B.; Zhao, S.; Valiev, R. Z.; Vecchio, K. S.; Meyers, M. A. Dynamic deformation and failure of ultrafine-grained titanium. Acta. Mater. 2017, 125, 210-8.
11. Arab, A.; Chen, P.; Guo, Y. Effects of microstructure on the dynamic properties of TA15 titanium alloy. Mech. Mater. 2019, 137, 103121.
12. Chen, B.; Sun, W. Transitional structure of {332}<113>β twin boundary in a deformed metastable β-type Ti-Nb-based alloy, revealed by atomic resolution electron microscopy. Scr. Mater. 2018, 150, 115-9.
13. Qi, Y.; Zhou, Y.; Yu, X.; Chu, Z.; Ding, X.; Sun, J. Strengthening mechanisms of a near-α titanium alloy with high strength and impact resistance. J. Mater. Res. Technol. 2025, 38, 1664-74.
14. Wang, H.; Tu, X.; Guo, P.; et al. Impact toughness and its deformation behavior of a novel low-cost titanium alloy. J. Mater. Res. Technol. 2025, 35, 4412-26.
15. Tang, S.; Su, J.; Li, L.; Han, Y.; Sing, S. L.; Fan, J. Achieving superior high-temperature strength and ductility in near-α titanium alloys by in-situ silicide modulation. J. Mater. Sci. Technol. 2025, 237, 38-53.
16. Dai, J.; Tang, B.; Wang, C.; et al. Deciphering the impact toughening mechanism of α+β titanium alloy with lamellar microstructure: from crack initiation and propagation perspectives. J. Mater. Sci. Technol. 2026, 249, 214-29.
17. Shi, W.; Li, J.; Wang, C. Study on action mechanisms of alloy element for adiabatic shearing sensitivity. AIP. Adv. 2019, 9, 095043.
18. Li, D.; Hui, S.; Ye, W.; Li, C. Microstructure and mechanical properties of a new high‐strength and high‐toughness titanium alloy. Rare. Met. 2023, 42, 281-7.
19. Lu, H.; Ji, P.; Li, B.; et al. Mechanical properties and deformation mechanism of a novel metastable β-type Ti–4V–2Mo–2Fe alloy. Mater. Sci. Eng. A. 2022, 848, 143376.
20. Li, X.; Wang, X.; Liu, K.; et al. Hierarchical structure and deformation behavior of a novel multicomponent β titanium alloy with ultrahigh strength. J. Mater. Sci. Technol. 2022, 107, 227-42.
21. Zhu, X.; Fan, Q.; Wang, D.; et al. Influence of twins found in adiabatic shear bands on dynamic recrystallization of a near β Ti-5.5Mo-7.2Al-4.5Zr-2.6Sn-2.1Cr alloy. Mater. Sci. Eng. A. 2022, 842, 143084.
22. Xu, G.; Zhao, X.; Xia, W.; et al. A review on microstructure design, processing, and strengthening mechanism of high-strength titanium alloys. Prog. Nat. Sci. Mater. Int. 2025, 35, 258-77.
23. Wang, W. Y.; Li, G.; Liu, Z.; et al. Materials genome engineering and intelligent science: the endless frontier in AI+ era. Sci. Technol. Rev. 2025, 43, 93-109.
24. Xie, J. Prospects of materials genome engineering frontiers. Mater. Genome. Eng. Adv. 2023, 1, e17.
26. Xie, M.; Gan, Y.; Wang, H. Research on new material power strategy by 2035. Chin. J. Eng. Sci. 2020, 22, 1.
27. Xie, J.; Su, Y.; Zhang, D.; Feng, Q. A vision of materials genome engineering in China. Engineering 2022, 10, 10-2.
28. Liu, Z. Building materials genome from ground‐state configuration to engineering advance. Mater. Genome. Eng. Adv. 2023, 1, e15.
29. Geng, X.; Wang, F.; Wu, H.; et al. Data‐driven and artificial intelligence accelerated steel material research and intelligent manufacturing technology. Mater. Genome. Eng. Adv. 2023, 1, e10.
30. Lv, S.; Peng, L.; Wu, W.; Yao, Y.; Jiao, S.; Hu, W. Bridging language models and computational materials science: a prompt‐driven framework for material property prediction. Mater. Genome. Eng. Adv. 2025, 3, e70013.
31. Shang, Y.; Xiong, Z.; An, K.; Hauch, J. A.; Brabec, C. J.; Li, N. Materials genome engineering accelerates the research and development of organic and perovskite photovoltaics. Mater. Genome. Eng. Adv. 2024, 2, e28.
32. Xu, D.; Zhang, Q.; Huo, X.; Wang, Y.; Yang, M. Advances in data‐assisted high‐throughput computations for material design. Mater. Genome. Eng. Adv. 2023, 1, e11.
34. Wang, W. Y.; Li, J.; Liu, W.; Liu, Z. Integrated computational materials engineering for advanced materials: a brief review. Comput. Mater. Sci. 2019, 158, 42-8.
35. Li, W.; Wang, Z.; Zhao, M.; et al. Symbolic regression accelerates the discovery of quantitative relationships in rubber material aging. J. Mater. Inf. 2025, 5, 29.
36. Pan, J.; Shi, R.; Zhang, Z.; et al. Composition-deformation mechanism-property machine learning model for strength-ductility improvement of β-type titanium alloys. Int. J. Plast. 2025, 194, 104461.
37. Zou, C.; Li, J.; Wang, W. Y.; et al. Integrating data mining and machine learning to discover high-strength ductile titanium alloys. Acta. Mater. 2021, 202, 211-21.
38. Tan, Y.; Dong, R.; Duan, Z.; Li, H.; Hou, H.; Zhao, Y. Machine learning coupled with an improved exhaustive method-assisted design of a low cost Ti-Al-Cr-Fe-Si series titanium alloy. Mater. Design. 2025, 257, 114526.
39. Liu, X.; Niu, H.; Zhao, S.; et al. Microstructural evolution and prediction of TC18 titanium alloys by high-throughput technology and machine learning. J. Alloys. Compd. 2025, 1017, 179202.
40. Zhan, Z.; Hu, W.; Meng, Q. Data-driven fatigue life prediction in additive manufactured titanium alloy: a damage mechanics based machine learning framework. Eng. Fract. Mech. 2021, 252, 107850.
41. Paturi, U. M. R.; Palakurthy, S. T.; Cheruku, S.; Vidhya Darshini, B.; Reddy, N. Role of machine learning in additive manufacturing of titanium alloys - a review. Arch. Computat. Methods. Eng. 2023, 30, 5053-69.
42. Lu, T.; Li, M.; Lu, W.; Zhang, T. Recent progress in the data-driven discovery of novel photovoltaic materials. J. Mater. Inf. 2022, 2, 7.
43. Shi, B.; Lookman, T.; Xue, D. Multi‐objective optimization and its application in materials science. Mater. Genome. Eng. Adv. 2023, 1, e14.
44. Zhou, C.; Yin, G.; Hu, X. Multi-objective optimization of material selection for sustainable products: artificial neural networks and genetic algorithm approach. Mater. Design. 2009, 30, 1209-15.
45. Ashby, M. Multi-objective optimization in material design and selection. Acta. Mater. 2000, 48, 359-69.
46. Ashjari, M.; Khoshravan, M. R. Multi-objective optimization of a functionally graded sandwich panel under mechanical loading in the presence of stress constraint. J. Mech. Behav. Mater. 2017, 26, 79-93.
47. Hwang, Y.; Lim, D. Y. Dual cone gradient descent for training physics-informed neural networks. arXiv 2024, arXiv:2409.18426. Available online: https://doi.org/10.48550/arXiv.2409.18426. (accessed 24 Mar 2026).
48. Malashin, I.; Tynchenko, V.; Gantimurov, A.; Nelyub, V.; Borodulin, A. A multi-objective optimization of neural networks for predicting the physical properties of textile polymer composite materials. Polymers 2024, 16, 1752.
49. Liu, Q.; Chu, M.; Thuerey, N. ConFIG: towards conflict-free training of physics informed neural networks. arXiv 2024, arXiv:2408.11104. Available online: https://doi.org/10.48550/arXiv.2408.11104. (accessed 24 Mar 2026).
50. Sidhu, S. S.; Singh, H.; Gepreel, M. A. A review on alloy design, biological response, and strengthening of β-titanium alloys as biomaterials. Mater. Sci. Eng. C. Mater. Biol. Appl. 2021, 121, 111661.
51. Zou, H.; Tian, Y.; Zhang, L.; et al. Integrating machine learning and CALPHAD method for exploring low‐modulus near‐β‐Ti alloys. Rare. Met. 2024, 43, 309-23.
52. Chen, C.; Zuo, Y.; Ye, W.; Li, X.; Deng, Z.; Ong, S. P. A critical review of machine learning of energy materials. Adv. Energy. Mater. 2020, 10, 1903242.
53. Deringer, V. L.; Caro, M. A.; Csányi, G. Machine learning interatomic potentials as emerging tools for materials science. Adv. Mater. 2019, 31, e1902765.
54. Schmidt, J.; Marques, M. R. G.; Botti, S.; Marques, M. A. L. Recent advances and applications of machine learning in solid-state materials science. npj. Comput. Mater. 2019, 5, 221.
55. Zhang, Y.; Ren, K.; Wang, W. Y.; et al. Discovering the ultralow thermal conductive A2B2O7-type high-entropy oxides through the hybrid knowledge-assisted data-driven machine learning. J. Mater. Sci. Technol. 2024, 168, 131-42.
56. Yang, Y.; Yang, S.; Wang, H. Effects of microstructure on the evolution of dynamic damage of Fe50Mn30Co10Cr10 high entropy alloy. Mater. Sci. Eng. A. 2021, 802, 140440.
57. Maresca, F.; Curtin, W. A. Theory of screw dislocation strengthening in random BCC alloys from dilute to “High-Entropy” alloys. Acta. Mater. 2020, 182, 144-62.
58. Qi, Y.; Chen, Y.; Ren, X.; Meng, X.; Pang, B.; Li, Y. Microstructures and dynamic compression properties of a WTaTiCrV refractory high-entropy alloys as an energetic structural materials. Int. J. Refract. Met. Hard. Mater. 2025, 130, 107178.
59. Zhu, C.; Li, C.; Wu, D.; et al. A titanium alloys design method based on high-throughput experiments and machine learning. J. Mater. Res. Technol. 2021, 11, 2336-53.
60. Luo, Y.; Tang, Y.; Chung, T. F.; et al. Electron work function: an indicative parameter towards a novel material design methodology. Sci. Rep. 2021, 11, 11565.
61. Pant, D.; Aidhy, D. S. Electronic density of states as the descriptor of elastic bond strength, ductility, and local lattice distortion in BCC refractory alloys. Mater. Design. 2025, 253, 113885.
62. Yang, F.; Zhao, W.; Ru, Y.; et al. Transfer learning enables the rapid design of single crystal superalloys with superior creep resistances at ultrahigh temperature. npj. Comput. Mater. 2024, 10, 1349.
63. Khatamsaz, D.; Vela, B.; Singh, P.; Johnson, D. D.; Allaire, D.; Arróyave, R. Multi-objective materials bayesian optimization with active learning of design constraints: design of ductile refractory multi-principal-element alloys. Acta. Mater. 2022, 236, 118133.
64. Greaves, G. N.; Greer, A. L.; Lakes, R. S.; Rouxel, T. Poisson’s ratio and modern materials. Nat. Mater. 2011, 10, 823-37.
65. Meredig, B.; Agrawal, A.; Kirklin, S.; et al. Combinatorial screening for new materials in unconstrained composition space with machine learning. Phys. Rev. B. 2014, 89, 094104.
66. Hastie, T.; Tibshirani, R.; Friedman, J. The elements of statistical learning: data mining, inference, and prediction, 2nd ed.; Springer New York, 2009.
67. Zhang, R.; Wang, W. Y.; Fan, Y.; et al. Knowledge-enabled data-driven smart design advanced high-entropy alloys with attractive dynamic mechanical properties. J. Mater. Sci. 2025, 60, 567-87.
68. Morales-Hernández, A.; Van Nieuwenhuyse, I.; Rojas Gonzalez, S. A survey on multi-objective hyperparameter optimization algorithms for machine learning. Artif. Intell. Rev. 2023, 56, 8043-93.
69. Bobbili, R.; Madhu, V. Constitutive modeling of dynamic flow behavior of Ti-5553 alloy. J. Alloys. Compd. 2019, 787, 260-6.
70. Li, Q. Mechanical properties and microscopic deformation mechanism of polycrystalline magnesium under high-strain-rate compressive loadings. Mater. Sci. Eng. A. 2012, 540, 130-4.
71. Zhan, H.; Wang, G.; Kent, D.; Dargusch, M. Constitutive modelling of the flow behaviour of a β titanium alloy at high strain rates and elevated temperatures using the Johnson–Cook and modified Zerilli–Armstrong models. Mater. Sci. Eng. A. 2014, 612, 71-9.
72. Johnson, G. R.; Cook, W. H. A constitutive model and data for metals subjected to large strains, high strain rates and high temperatures. Eng. Fract. Mech. 1983, 21, 541-8. https://ia800406.us.archive.org/4/items/AConstitutiveModelAndDataForMetals/A%20constitutive%20model%20and%20data%20for%20metals_text.pdf. (accessed 24 Mar 2026).
73. Johnson, G. R.; Cook, W. H. Fracture characteristics of three metals subjected to various strains, strain rates, temperatures and pressures. Eng. Fract. Mech. 1985, 21, 31-48.
74. Zerilli, F. J.; Armstrong, R. W. Dislocation-mechanics-based constitutive relations for material dynamics calculations. J. Appl. Phys. 1987, 61, 1816-25.
Cite This Article
How to Cite
Download Citation
Export Citation File:
Type of Import
Tips on Downloading Citation
Citation Manager File Format
Type of Import
Direct Import: When the Direct Import option is selected (the default state), a dialogue box will give you the option to Save or Open the downloaded citation data. Choosing Open will either launch your citation manager or give you a choice of applications with which to use the metadata. The Save option saves the file locally for later use.
Indirect Import: When the Indirect Import option is selected, the metadata is displayed and may be copied and pasted as needed.
About This Article
Special Topic
Copyright

Data & Comments
Data
0


Comments
Comments must be written in English. Spam, offensive content, impersonation, and private information will not be permitted. If any comment is reported and identified as inappropriate content by OAE staff, the comment will be removed without notice. If you have any queries or need any help, please contact us at [email protected].