


Physically synthesized data for deep learning-based visual scratch inspection of aerospace alloys with complex geometries
 0
0 Abstract
Aerospace alloys often operate under extreme conditions. Accurate defect segmentation in images of aerospace components is the key to quantifying the defects and evaluating their impact for part lifespan. The components usually have complex free-form surfaces, leading to uneven light distribution in images. The variable image presentations pose a great challenge for accurate segmentation, especially with limited data. Generative adversarial networks and other training-based methods are commonly used for image generation, but they still rely on sufficient high-quality training data. In this paper, a physical-based image generation method is proposed to create any possible scratches according to physical laws to improve the scratch segmentation capability with limited data. First, an efficient scratched blade surface image generation pipeline is developed. Then, a systematic strategy to maximize the effect of physical synthetic scratch images is presented. The experiments show that the segmentation intersection-over-union could be improved from 0.66 to 0.83 with only 20 real images for training, and reveal the influences of network structure, image and label quality, data fusion strategy on segmentation performance.
Keywords
INTRODUCTION
Aerospace alloys including Titanium alloys and superalloys are often designed with complex geometries for optimum performance and working under extreme conditions. A typical example is aero-engines blades, which are designed with free-form surfaces for optimum aerodynamic performance [Figure 1]. As they are usually working under very high pressure and rotational speed, minor surface defects may cause unexpected fracture and threaten flight safety[1-4]. Therefore, it is important to effectively detect defects such as scratches and dents and evaluate their potential impact on the part lifespan.
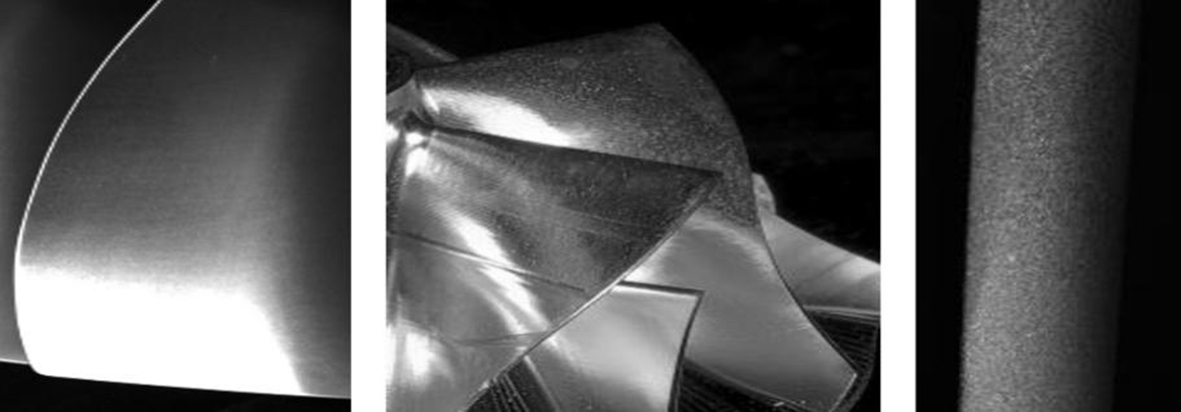
Figure 1. Various aero-engine blades with free-form surfaces. Photograph taken by the authors.
It is still common to manually inspect the parts and identify the defects with naked eyes in the industry, which is not reliable under fatigue[5,6]. Meanwhile, the inspectors can only provide a qualitative judgment on the defect existence, missing the quantitative measurement to evaluate further treatment. With the rapid development on artificial intelligence in the material area[7,8], deep learning approaches have shown promising performance on the automated visual inspection (AVI) of aerospace alloy surface[9-12]. The convolutional neural networks (CNNs) are one of the most popular structures[13,14]. Semantic guidance has also been introduced to improve the detection performance[5,15]. The graph neural network is found useful for the identification of irregular defects[16]. Transformer-based networks have also been applied for this problem and show promising performance[17]. However, these studies defined defect detection as an object detection problem, where the contour of defects is ignored.
As the aerospace alloys are expensive, and their working condition is severe, it is crucial to accurately calculate the geometrical parameters of defects to evaluate their impact and inform treatment decisions[18-20]. A transformer-based network for defect segmentation on aero-engine blade is proposed, showing the potential to obtain the accurate shape of the defects for further evaluation[6]. However, segmentation tasks usually have a high requirement for training datasets. For the complex situation such as aero-engine blades [Figure 2], it is very difficult to obtain comprehensive data that covers the possible defect presentation distributions. In manufacturing stage, the defects are rare, making it more challenging to train a robust network. How to tackle this situation is still an open question for aerospace alloy inspection.
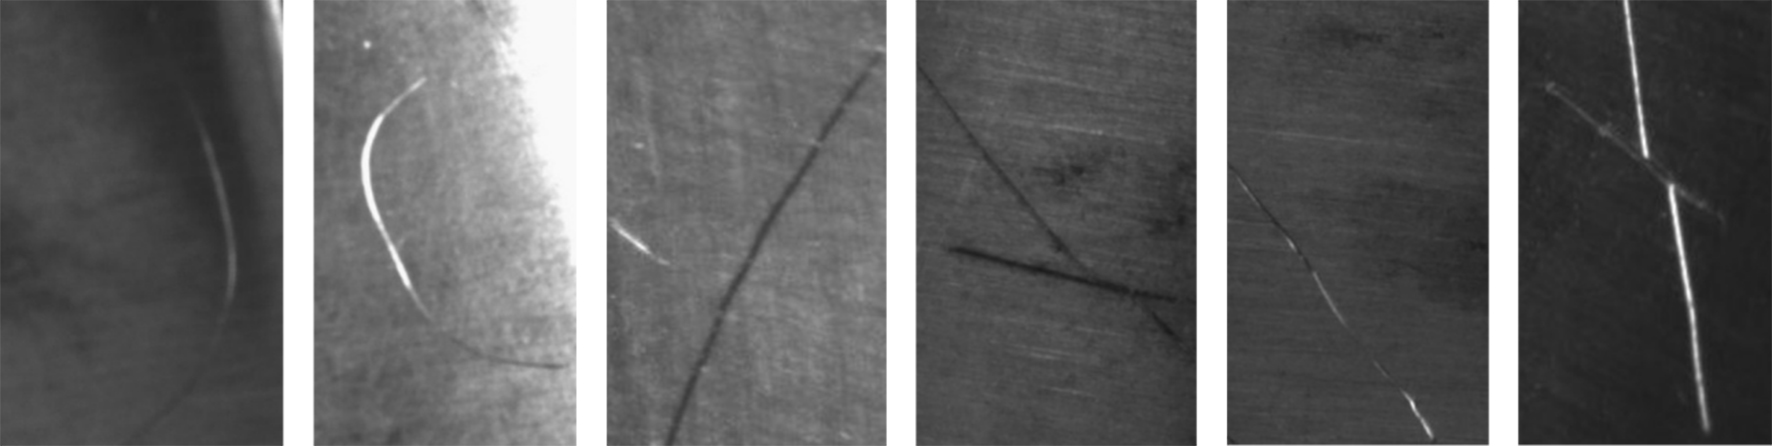
Figure 2. Variety of scratches presentations in images. They may look bright, or dark, and often continuously change at different areas on complex surfaces.
The performance of deep learning-based models highly depends on the training datasets. However, data scarcity remains a main challenge for complex parts[10]. First, the curvature may change frequently all over the surface[21]. As a result, the same scratch may appear completely different in different areas and under varying lighting and camera settings [Figure 2]. Combining the variety of scratch shapes, the possible image distribution space is very huge. It is difficult to capture comprehensive datasets to cover this distribution. Meanwhile, the defect is still a rare situation in practice, especially in the manufacturing process. For the segmentation problems, labeling is also very time-consuming and difficult to maintain high quality[11].
Synthetic image generation is one of the main strategies to improve data quality and quantity for AVI. Data-driven methods have dominated this area in recent years. Generative adversarial networks (GANs) are among the most widely used methods[22,23]. More recently, diffusion model-based approaches have been emerging rapidly[24]. However, the development of these models requires high-quality data, and the generated image distribution still follows the existing real datasets. Therefore, the model’s performance can easily saturate as the volume of generated data increases[25]. For defect detection of aerospace alloys, as their distribution is very broad, adding possible image presentations outside the distribution of the existing datasets is critical to improve the robustness of the segmentation.
Physical-based image generation relies solely on simulating the lighting and imaging processes to generate images using computer graphics. Because it can simulate all possible imaging conditions and complex geometries without being limited by existing datasets, it has recently emerged as a promising solution for defect image generation. The procedures for defect modeling in AVI have been developed[26-30], and the performance of physical synthetic data for AVI across various objects has also been evaluated[31,32]. These studies demonstrate that the approach works well in certain defect detection scenarios. However, most studies have focused on image classification or object detection. How to define scratches, generate, and utilize physical synthetic data for high-accuracy scratch segmentation on aerospace alloys with complex geometries still requires further investigation.
In this paper, we introduce the physical synthetic data into the surface inspection of aerospace alloy scenarios and investigate its influence on the performance of defect segmentation. Aero-engine blades, among the most complex parts made from aerospace alloys, are selected as the verification object, and scratches, one of the most common defect types on aerospace components[1,5], are chosen as the defect type. First, an efficient pipeline for generating scratch images on free-form surfaces is developed to quickly produce synthetic defect images. Then, an application strategy for using physical synthetic data in scratch segmentation model construction is proposed, based on trends revealed by a series of experiments. The main contributions of this paper are:
• Introducing physical synthetic data for scratch segmentation of complex aerospace alloy parts.
• Developing an efficient image generation pipeline, with results showing that synthetic data can evidently improve segmentation performance with limited real data.
MATERIALS AND METHODS
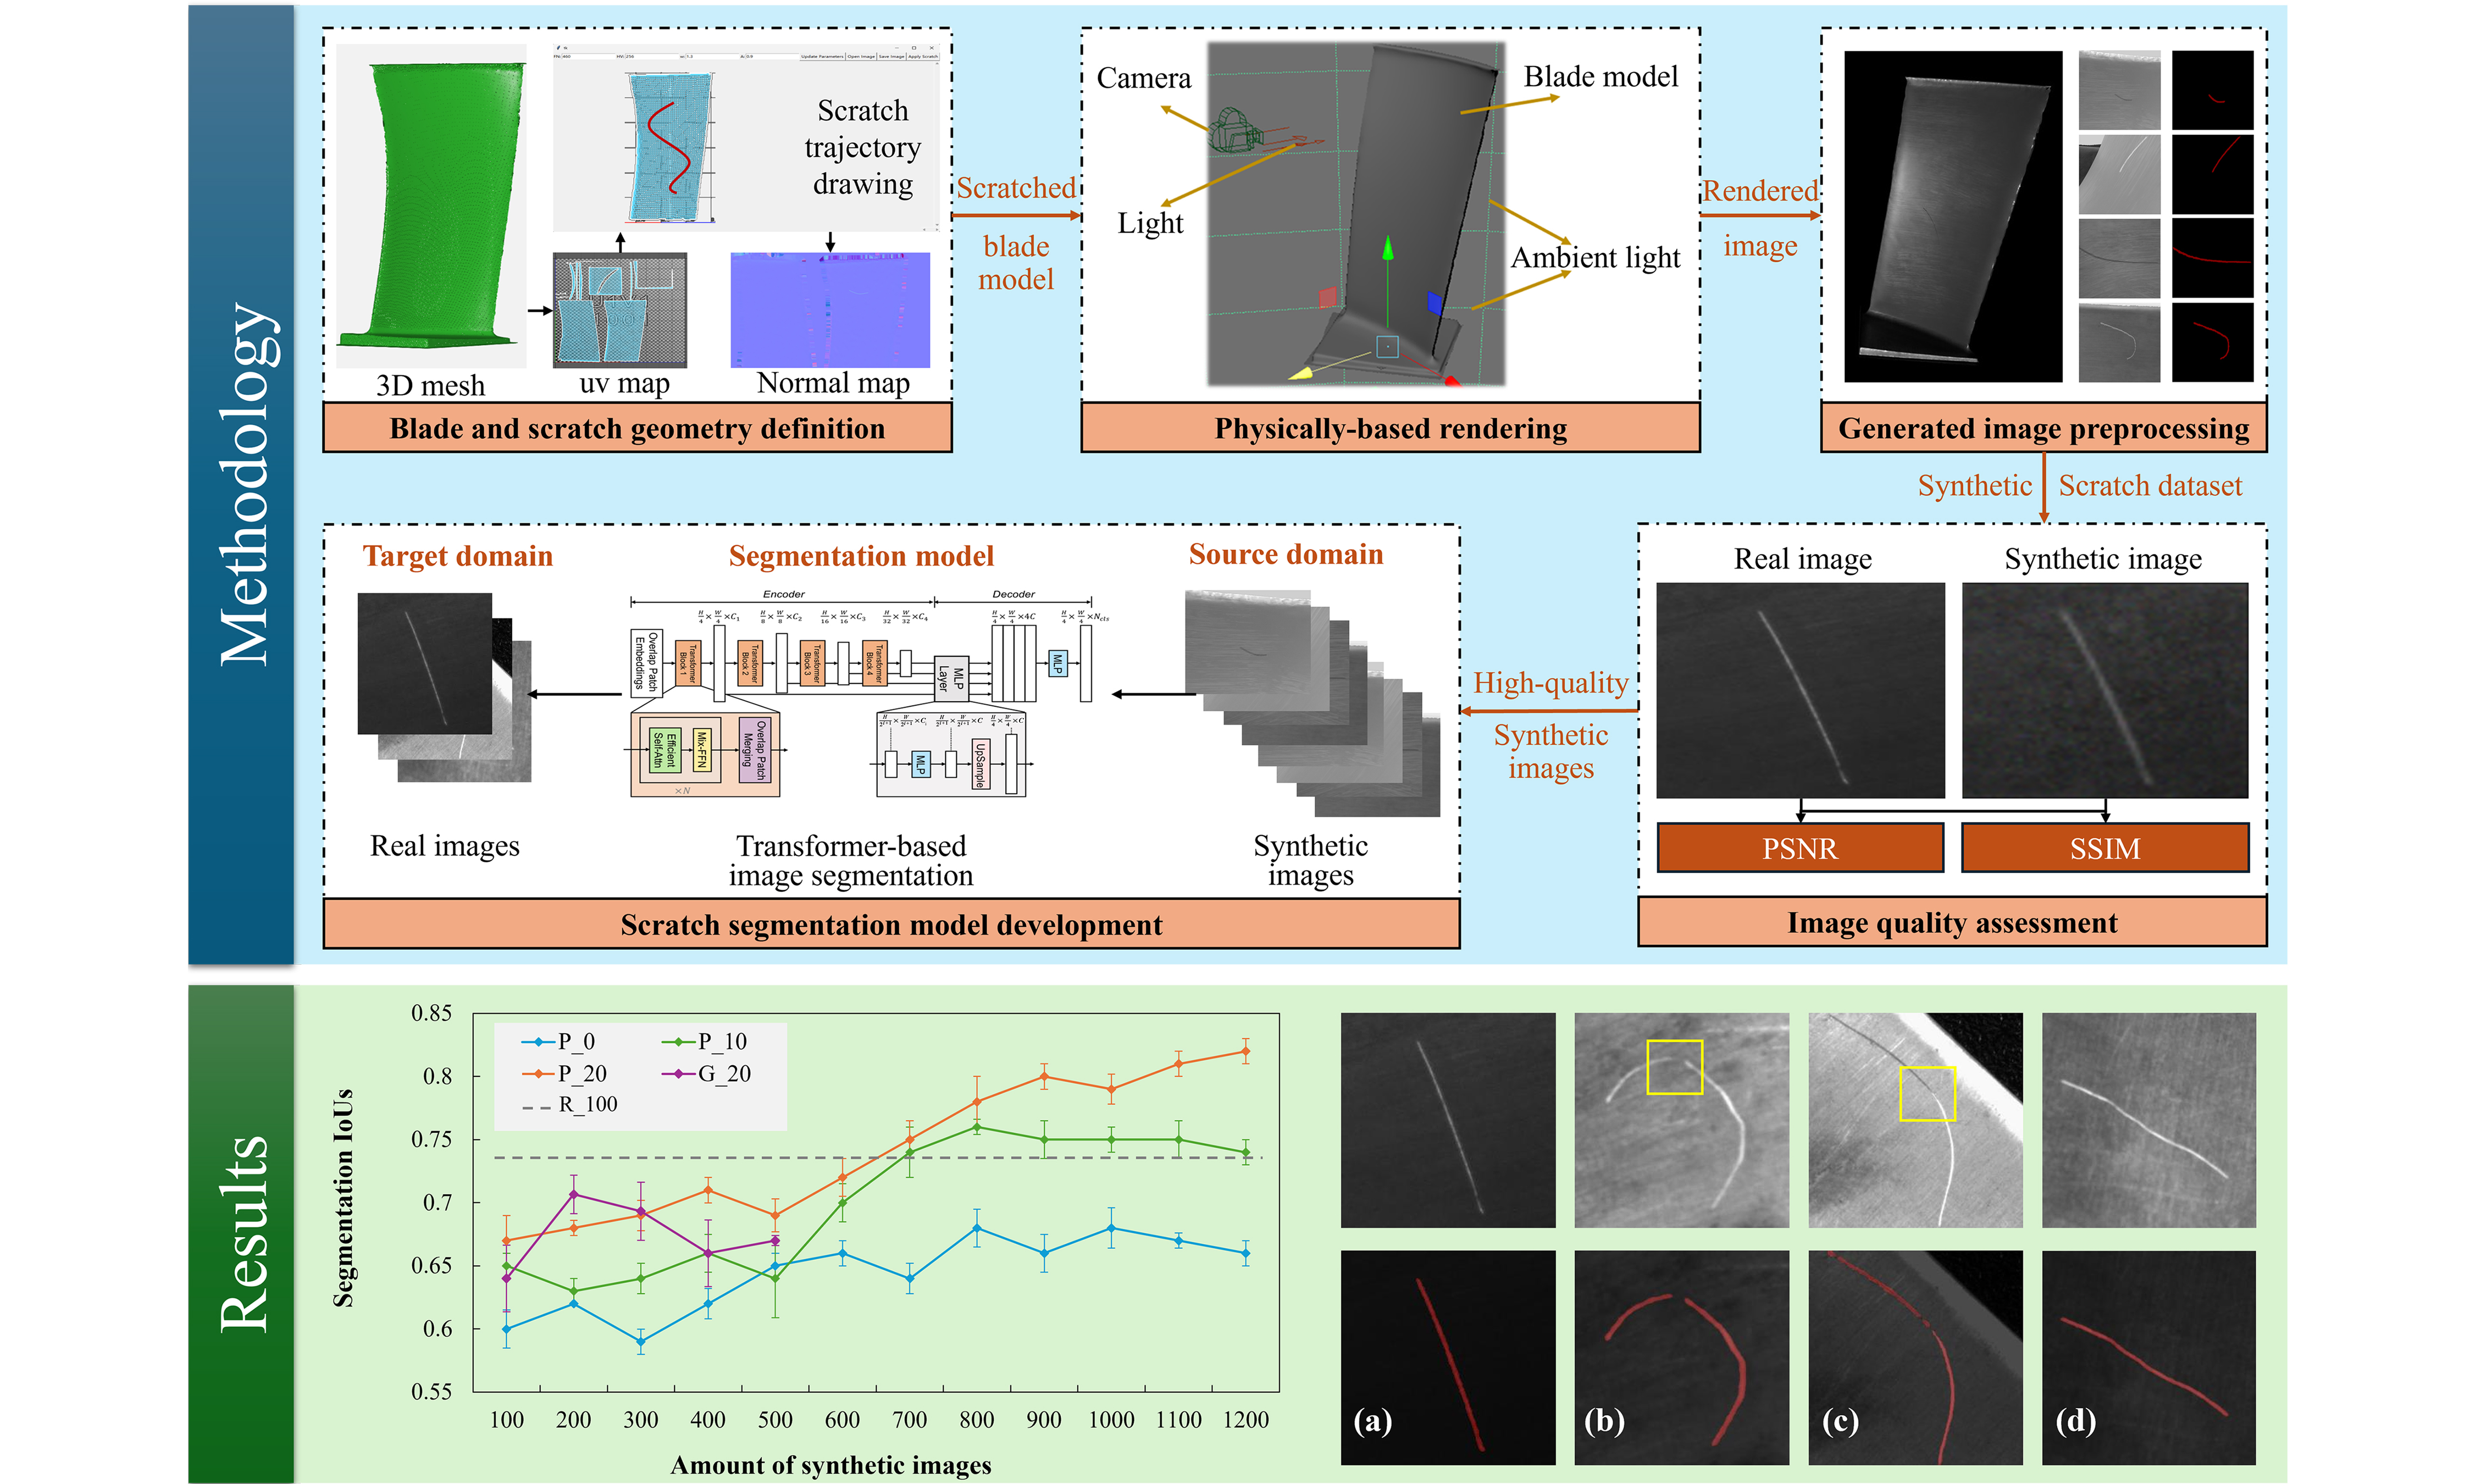
The workflow of generating and using physical synthetic images for scratch segmentation of aero-engine blades is presented in Figure 3. First, the imaging characteristics of a complex product are mainly determined by its 3D geometry and surface textures, which are the subtle geometrical changes on a smaller scale. Therefore, both aspects should be modeled in the image generation process. The geometry can be described by 3D meshes. For textures, it is difficult to directly define it on complex surfaces. In practice, the 3D mesh can be projected onto 2D images (called maps) using through UV mapping, a common strategy for rendering tasks. In this way, each pixel in the 2D images can be linked to a specific location in the 3D model. Color maps, metallic maps, roughness maps, normal maps, and other maps can then be defined to describe different aspects of the surface texture. Scratches are typical textural features, where the surface normal of scratched areas is altered, producing their visual effects. Therefore, scratches can be represented on the normal maps. Based on this approach, a scratch generation tool is developed, allowing users to draw random lines as scratch trajectories on the normal map, which are then projected onto the blade surface for rendering. Second, with the geometry and texture model of the aero-engine blades, the camera, light, and ambient light are defined for rendering purposes. As the purpose of rendering is to generate images close to real ones, the rendering scene should mimic actual shooting conditions. The settings can also be customized to cover different practical scenarios. As the rendering pipeline is well-developed in commercial software such as Autodesk Maya, we directly use it to generate rendered images. Third, the generated rendered images are preprocessed by cropping the scratched areas and performing pixel-level labeling. Fourth, the rendered image quality should be assessed before the training process, as it influences segmentation performance. Finally, with sufficient high-quality synthetic images, the segmentation model can be trained. A transformer-based network is chosen because it captures global feature connections better than convolution-based models[6]. Meanwhile, transfer learning is applied instead of directly mixing real and synthetic images to achieve better performance on real scratch images. The key steps are detailed as follows.
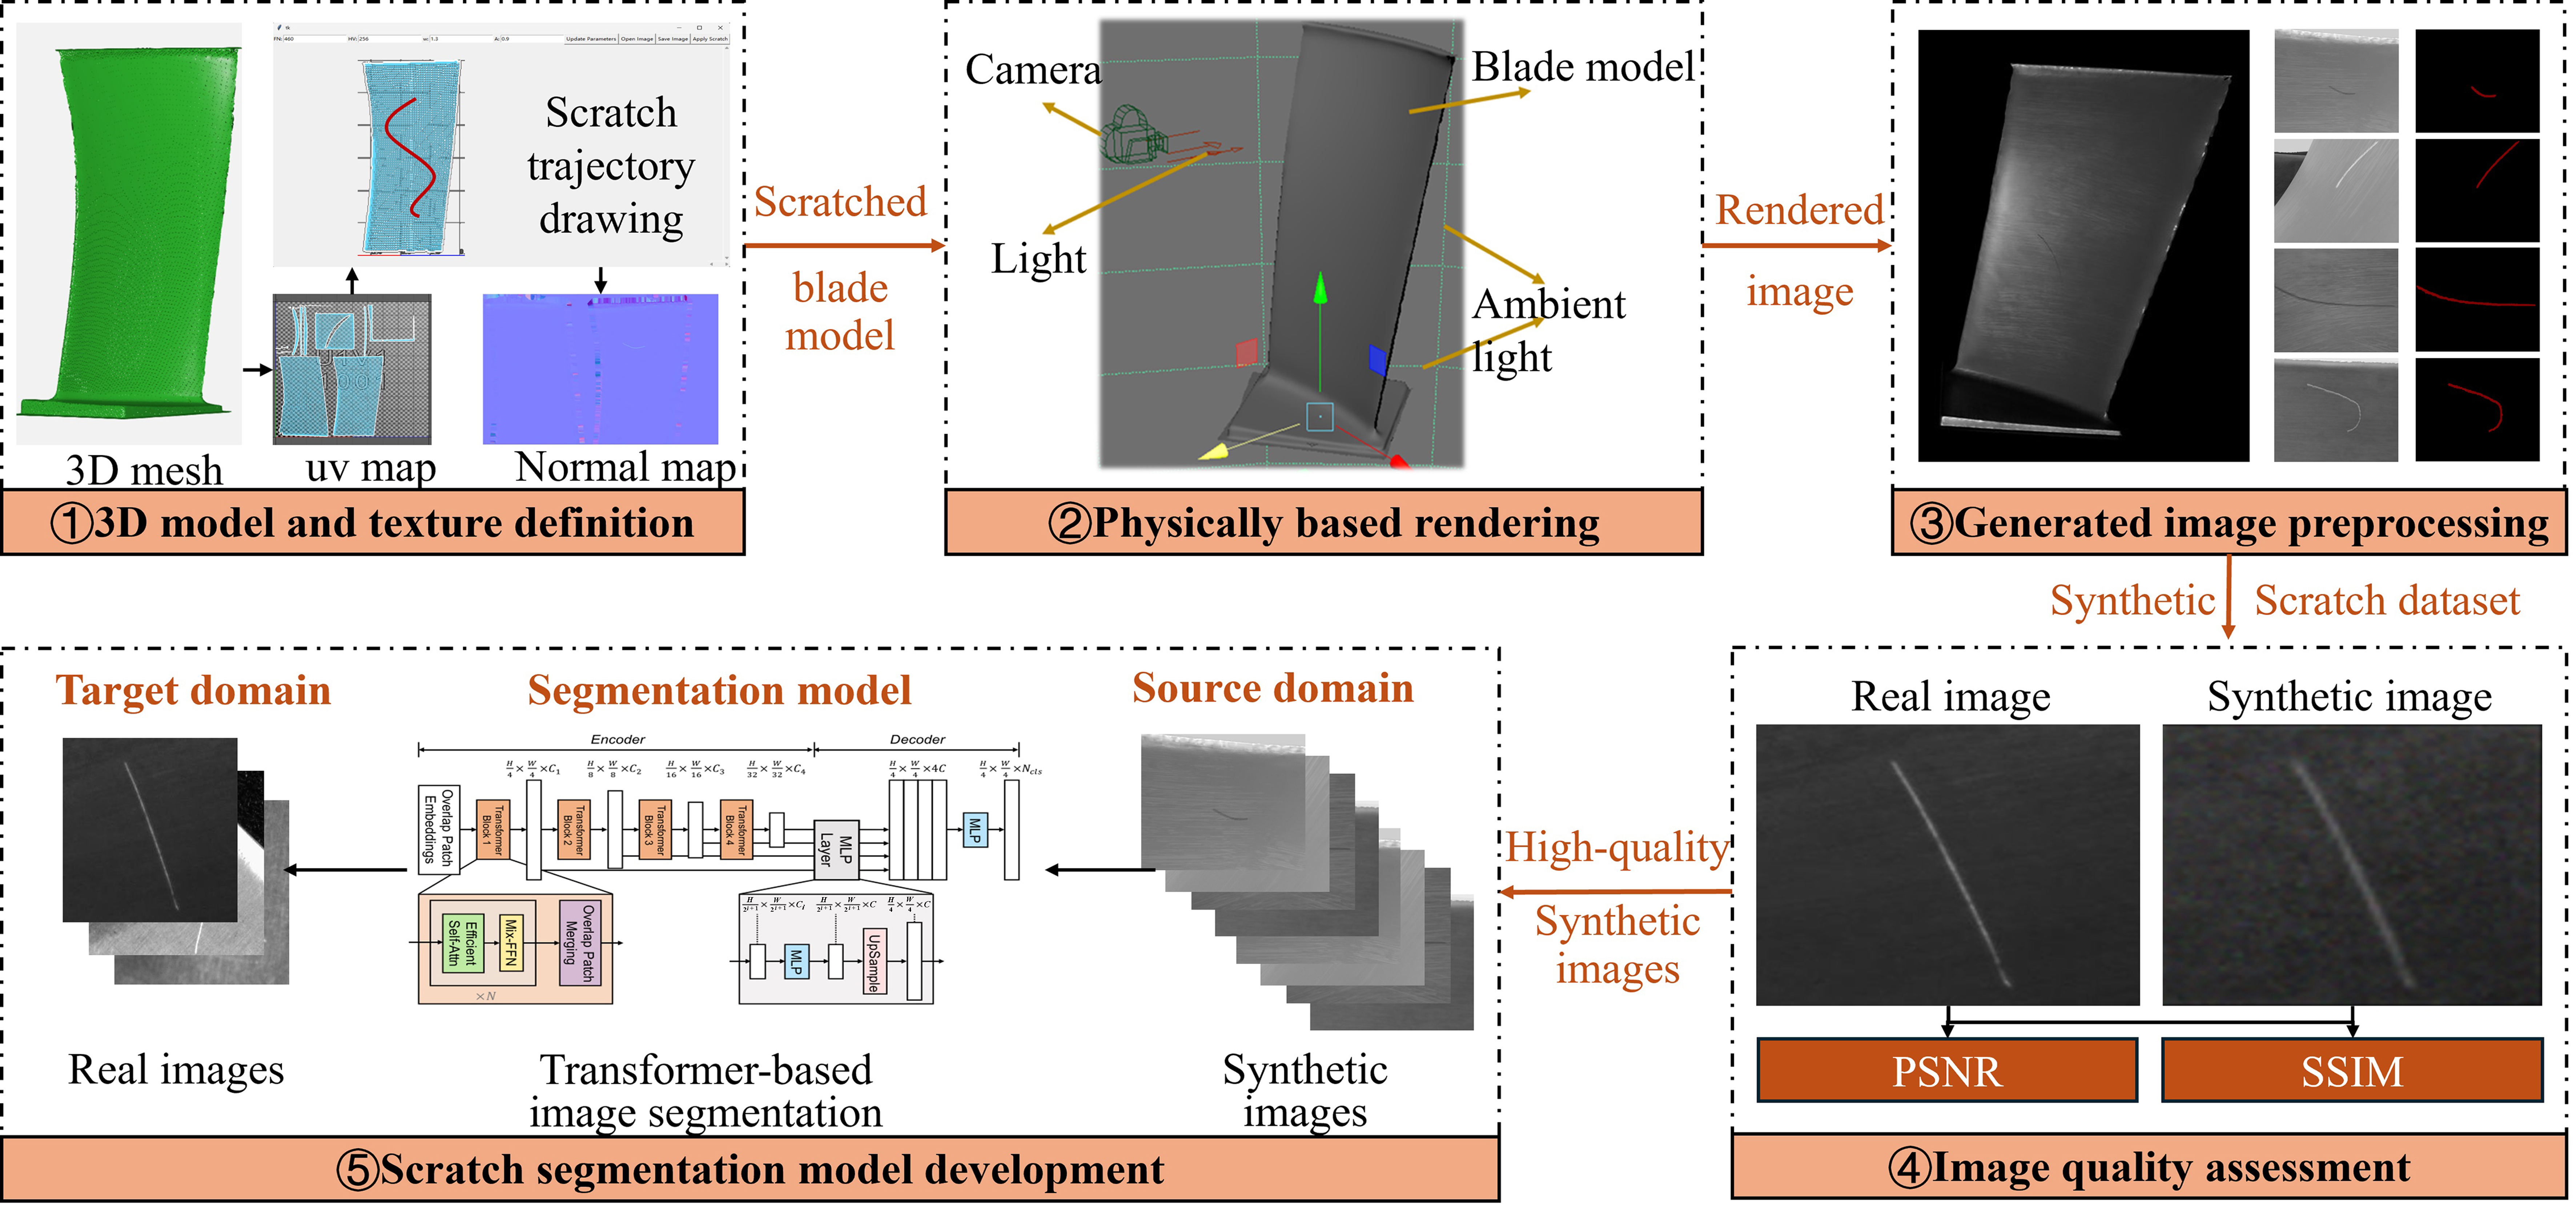
Figure 3. Workflow of the proposed physical synthetic image generation and utilization method, including 3D model and texture definition, physically based rendering, generated image processing, image quality assessment, and segmentation model development. PSNR: Peak signal-to-noise ratio; SSIM: structural similarity index metric.
Scratch generation
As scratches are usually shallow and do not alter the geometry of the blade, they can be represented as changes to the mesh normals of a local region while keeping vertex positions unchanged. These subtle surface variations can be described as pixel-wise changes of the normals in the scratch areas, which are recorded in the normal map file during rendering. In this way, the normal map can be projected onto the 3D model through uv mapping. Two main issues arise: (1) how to define the geometry of the scratch cross-section; and (2) how to connect a series of cross-sections into a continuous scratch along a given trajectory.
First, the scratch cross-section can be described as two peaks and a groove[33]. The key geometric parameters of the cross-section are shown in Figure 4: p represents the depth of the groove, h is the height of the peak, w is the width of the groove, wi and we denote the widths of the inner and outer zones of the peak, respectively. These parameters can be calculated as follows:
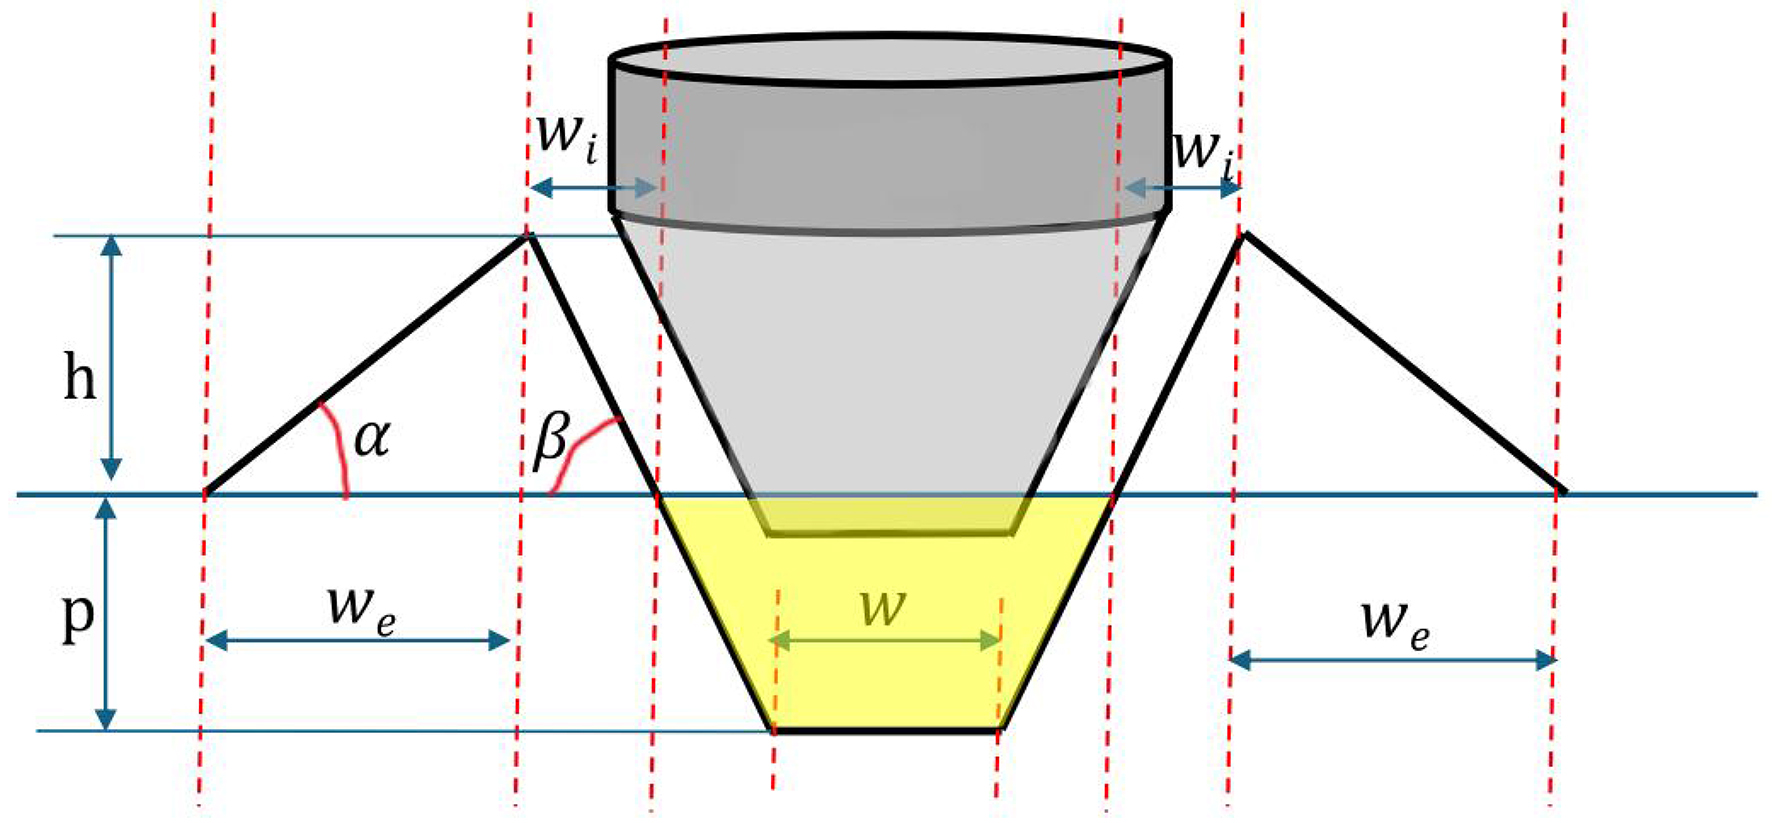
Figure 4. Key parameters of the scratch cross-section. The yellow-shaded area represents the groove cross-section area, A.
where FN is the force that causes the scratch, HV is the Vickers hardness of the aerospace alloy, A is the groove cross-section area, α and β are the internal and external angles of the peak, and 0.182, 0.0055, and 0.014 are mainly the empirical parameters generated from experiments[33]. FN, HV, w, and A are the four necessary parameters to be defined to determine the complete geometry of the cross-section. Their values can be determined by observing real scratch distributions. These parameters can then be further randomized to mimic different scratching scenarios based on experience with how scratches typically appear. As the geometry of the cross-section is obtained, the normal direction of each point on it could be calculated. However, the cross section can only represent one slice of the scratch. A continuous scratch description is required for rendering purposes, and this is done in the next step.
Second, the normal of the scratch cross-section needs to be allocated to the normal map. In the normal map, the pixel value represents the direction of the normals of the corresponding area on 3D mesh. To increase the diversity of the scratch geometry, the location and trajectory of the scratch can be defined manually by drawing random lines on the normal uv map of the 3D mesh. In this way, various scratches can be defined on 2D images and directly projected onto the aerospace alloy surface. The scratch texture generation method is presented in Figure 5. As the cause of the scratch features in images is the normal change of the surface, we are mainly working on the normal map of the texture. The dark orange pixels in Figure 5 represent the randomly drawn scratch trajectories. At each pixel, a scratch cross-section is assigned, with the depth (Z direction) oriented perpendicular to the map surface. As a result, a cross-section is projected as a line in the normal map, and each pixel on the line stores the normal direction, as defined in Figure 4. The pixel values (i.e., normal directions) can be calculated based on the geometry defined using Equations (1)-(4). As the trajectories are usually not straight lines, there will be overlapping and uncovered areas, as shown in Figure 5, where the trajectory direction changes. For the overlapped pixels, the average values are used. For uncovered pixels within the scratch areas, linear interpolation is applied to calculate their values. In this way, the minor changes of the part surface textures such as scratches and other features can be defined in a 2D normal map and projected to its 3D models for rendering purposes.
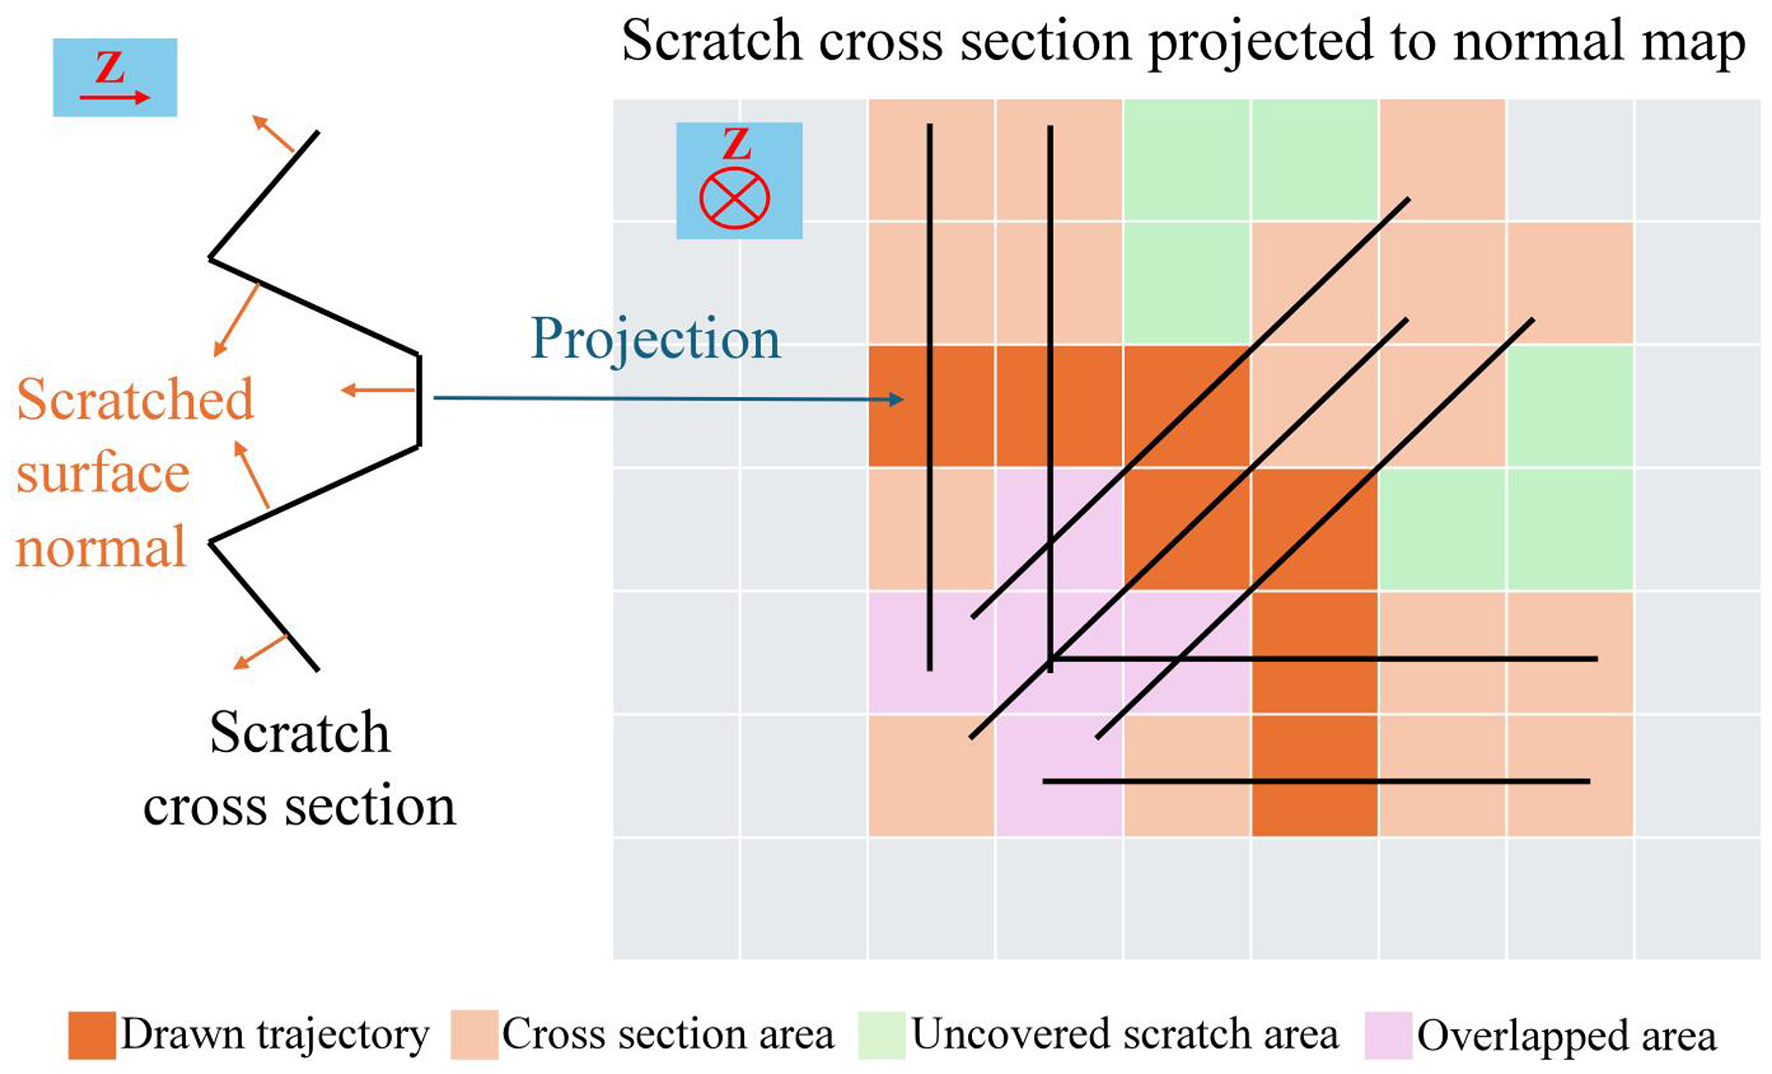
Figure 5. Scratch texture generation. The dark orange areas are the scratch trajectory randomly drawn by the operators. Following the trajectory, the cross-section of the scratch is vertically distributed in the image. Therefore, they are projected as straight lines at each pixel of the trajectory, forming the light orange areas. The pixel values of these areas, which are the original surface normals, are replaced by the scratched surface normals. As the trajectory may randomly turn in different directions at different places, the projected cross-section areas may be overlapped as the pink areas or skip some pixels as the green areas. The pixel values are replaced by averaged normals or interpolated normals.
The scratch trajectory is drawn manually in a random manner, allowing a wider range of scratch distributions to be considered. However, humans introduce bias and personal preferences, which may differ from actual scratch distributions. Therefore, an experienced inspector is preferred for this task, as they have a better understanding of real-world distributions.
Image quality assessment
The rendering quality influences the segmentation performance of scratch segmentation models. Therefore, it is necessary to develop a quality assessment method for physical synthetic images. As the purpose of the synthetic images is simulating the real ones, the full-reference (FR) type of metric is adopted to objectively assess the generated image quality[34]. As the image style and scratch similarity are the key assessing aspects, the peak signal-to-noise ratio (PSNR) and structural similarity index metric (SSIM) are used. PSNR measures the pixel-wise differences between real and synthetic images, providing a quantitative evaluation in terms of overall brightness, contrast and other image styles. The SSIM mainly measures structural similarity, including the texture and scratch structures. Both PSNR and SSIM evaluate the similarity of synthetic images with corresponding real images through pixel-wise and statistical comparison. They can be calculated as follows:
where MSE means mean squared error; Ii and Ri are the values of the ith pixel in the tested and reference images, respectively; N is the total number of pixels; L is the maximum pixel value; μI and μR are the mean pixel values of the tested and reference images; σI and σR are the corresponding standard deviations; and c1 and c2 are constants. Both PSNR and SSIM (ranging from 0 to 1) prefer larger values.
The FR methods require a real image for each assessed synthetic image with exactly the same imaging scene. However, synthetic images are randomly generated, and it is very time-consuming to set the same real imaging scene for every synthetic image. As the shooting position, lighting condition, and part geometry are relatively easy to control in rendering environment, the closeness of the real and synthetic images is mainly influenced by the texture settings. Therefore, we make a reasonable assumption here that different texture settings will cause different generated image quality. In this way, we only sample a small group of synthetic images with the same texture settings to indicate all the synthetic images with the same settings.
The proposed image quality assessment procedure is depicted in Figure 6. As the physics of lighting and imaging and the geometry of the part is relatively well-established in our case, the rendered quality is mainly influenced by the settings of the textures. The textures are defined as a set of maps including color maps, metallic maps, roughness maps, and normal maps in image format to define the imaging characteristics of the surface. These maps can be projected to the 3D model through uv mapping. To reveal the influence of the synthetic image quality on the scratch segmentation results, we need to create synthetic images with different qualities by changing the texture settings. We first establish different texture settings as in Figure 6 including different colors, roughness, and metallic degrees, while maintaining the same normal maps to guarantee the scratches are the same to generate synthetic images with different qualities. Afterwards, we create a physical imaging scene to capture real images and a corresponding digital rendering scene to acquire synthetic images with different texture settings. Then, PSNR and SSIM are used as the quality metrics to quantify the difference of the real images and the corresponding synthetic images. The calculated quality metrics for different texture settings are used to categorize the synthetic images into three quality levels from high quality to low quality. With these datasets, we could compare segmentation performance using synthetic images with different quality levels.
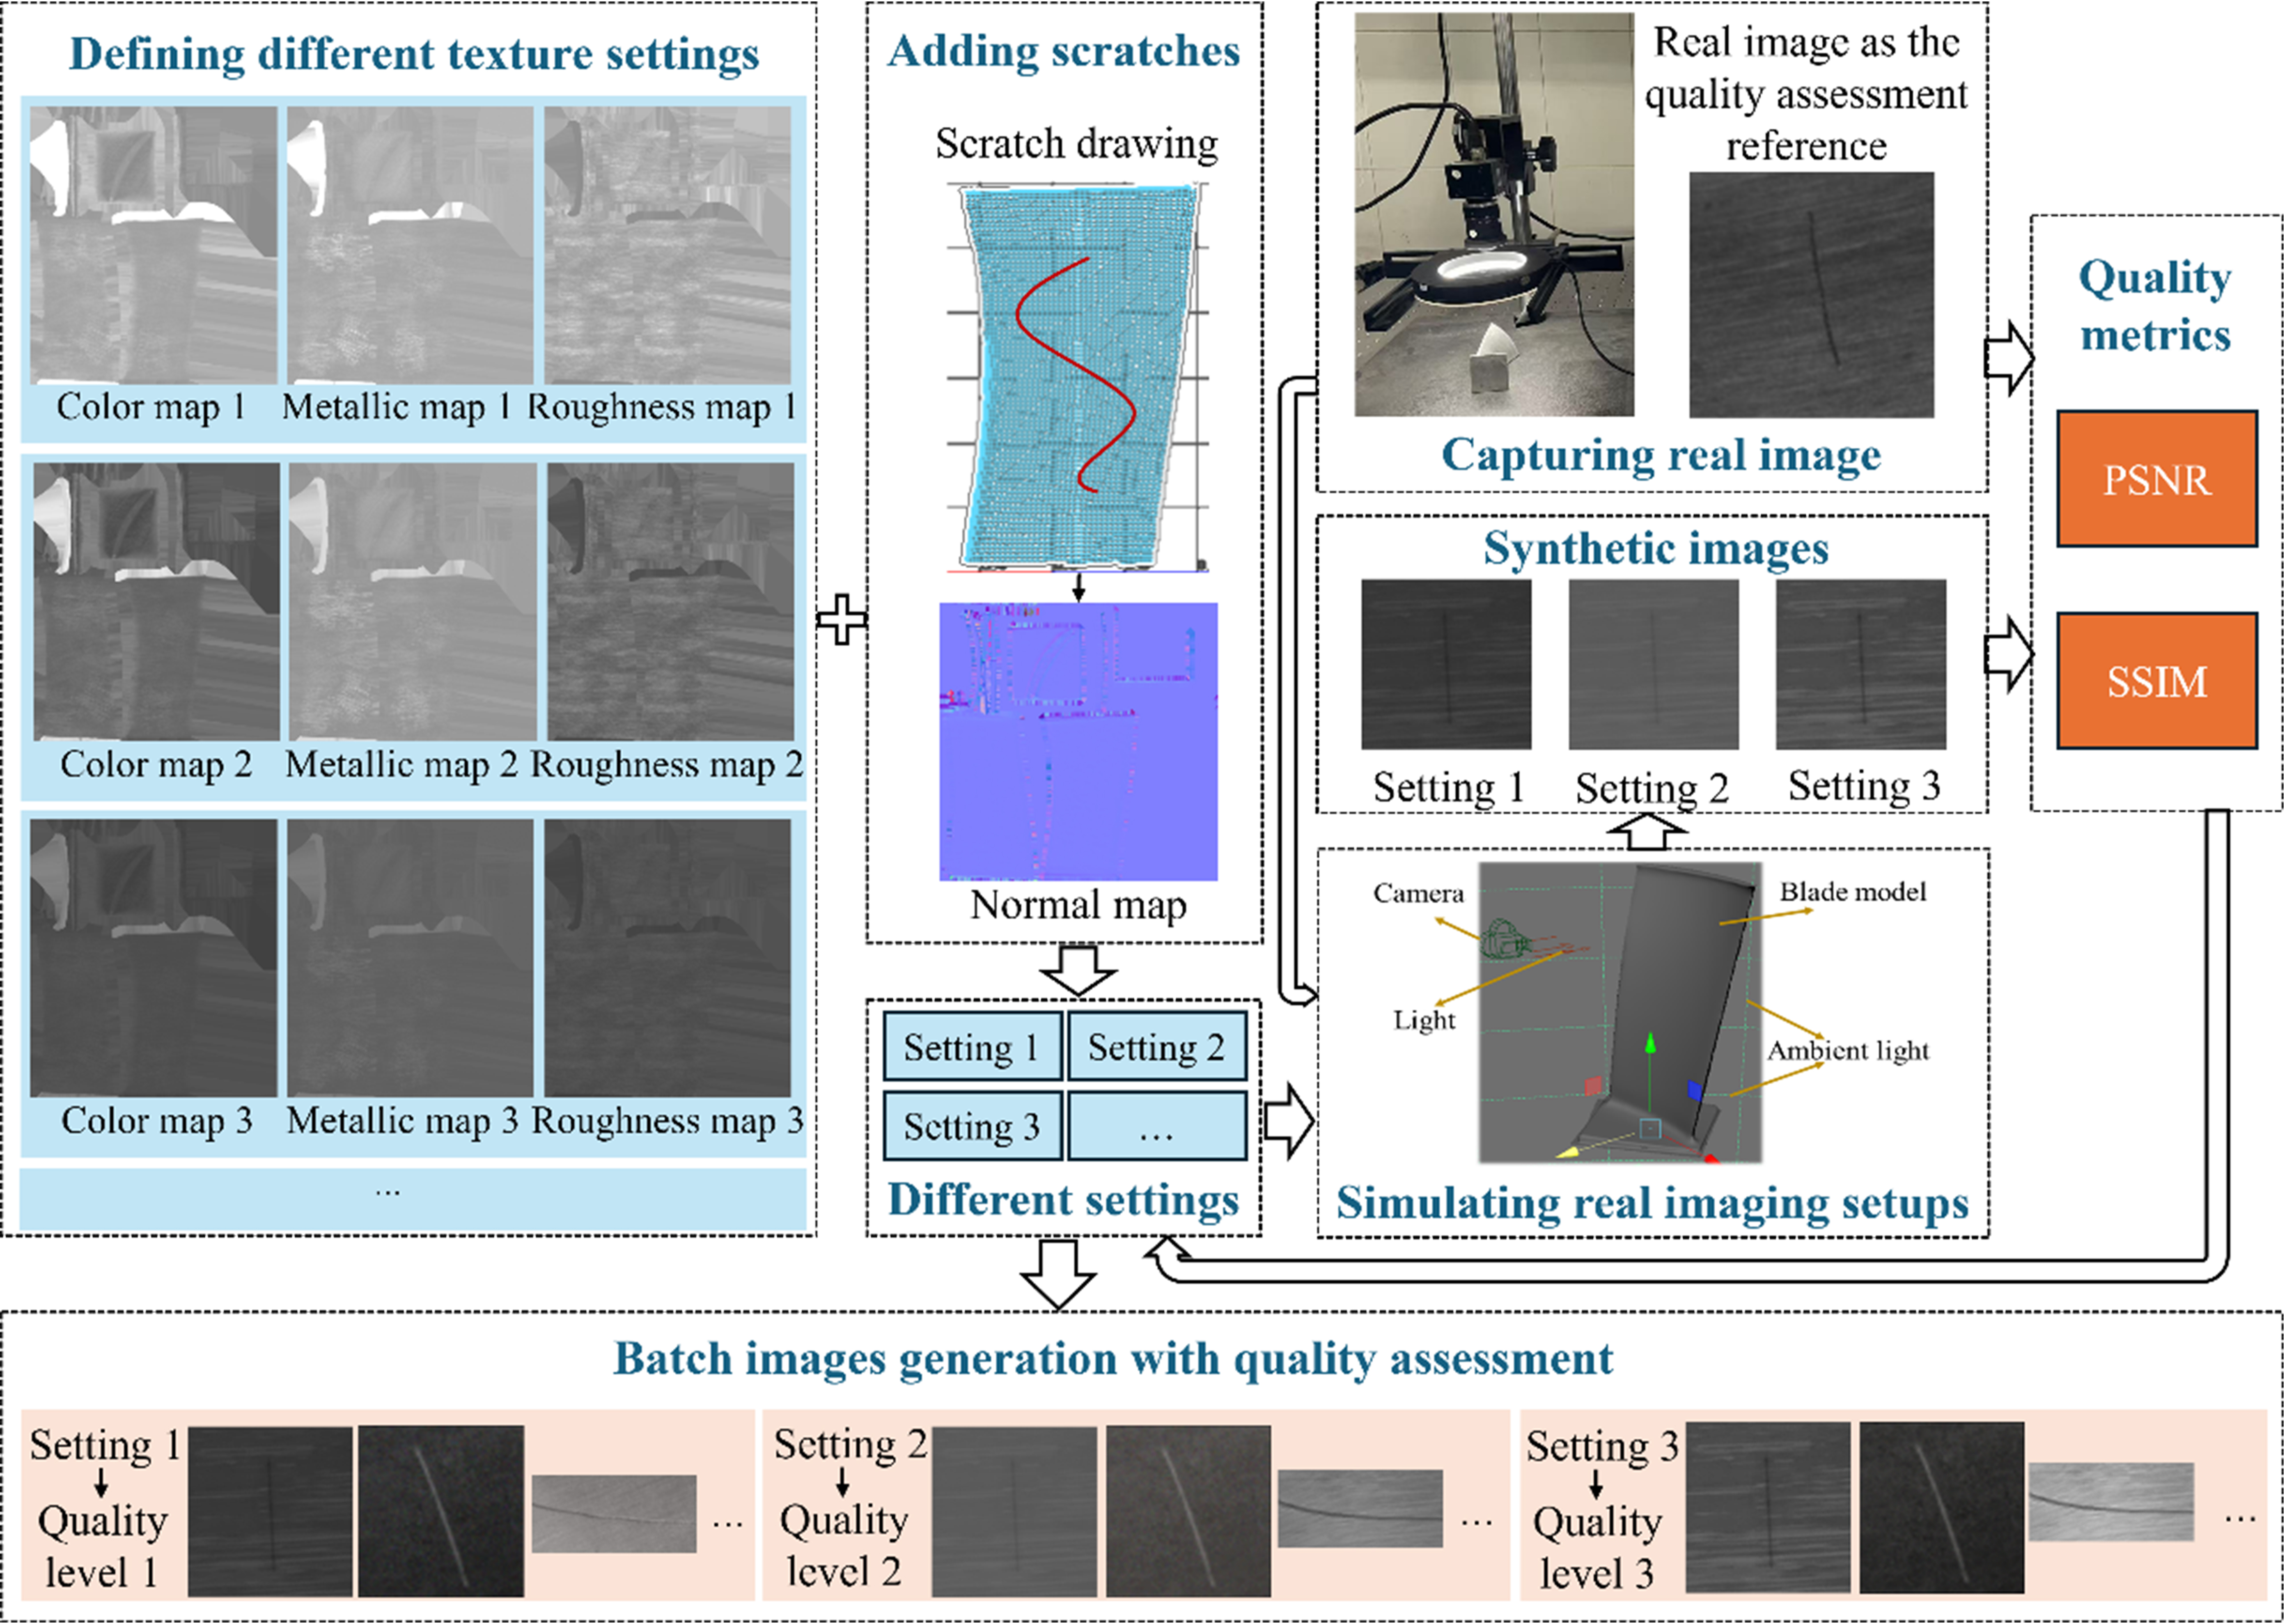
Figure 6. Image quality assessment procedure. The rendered image quality is changed by using different texture settings including color maps, metallic maps, and roughness maps. Images with different quality levels could be generated using different texture settings. PSNR: Peak signal-to-noise ratio; SSIM: structural similarity index metric.
Segmentation model development
For scratch segmentation model development, there are three key aspects: labeling quality, network structure, and training strategy. Based on analysis and experiments, an improved approach for applying physically synthesized data to effective scratch segmentation is summarized in Figure 7, including labeling guidance, network structure, and training strategy.
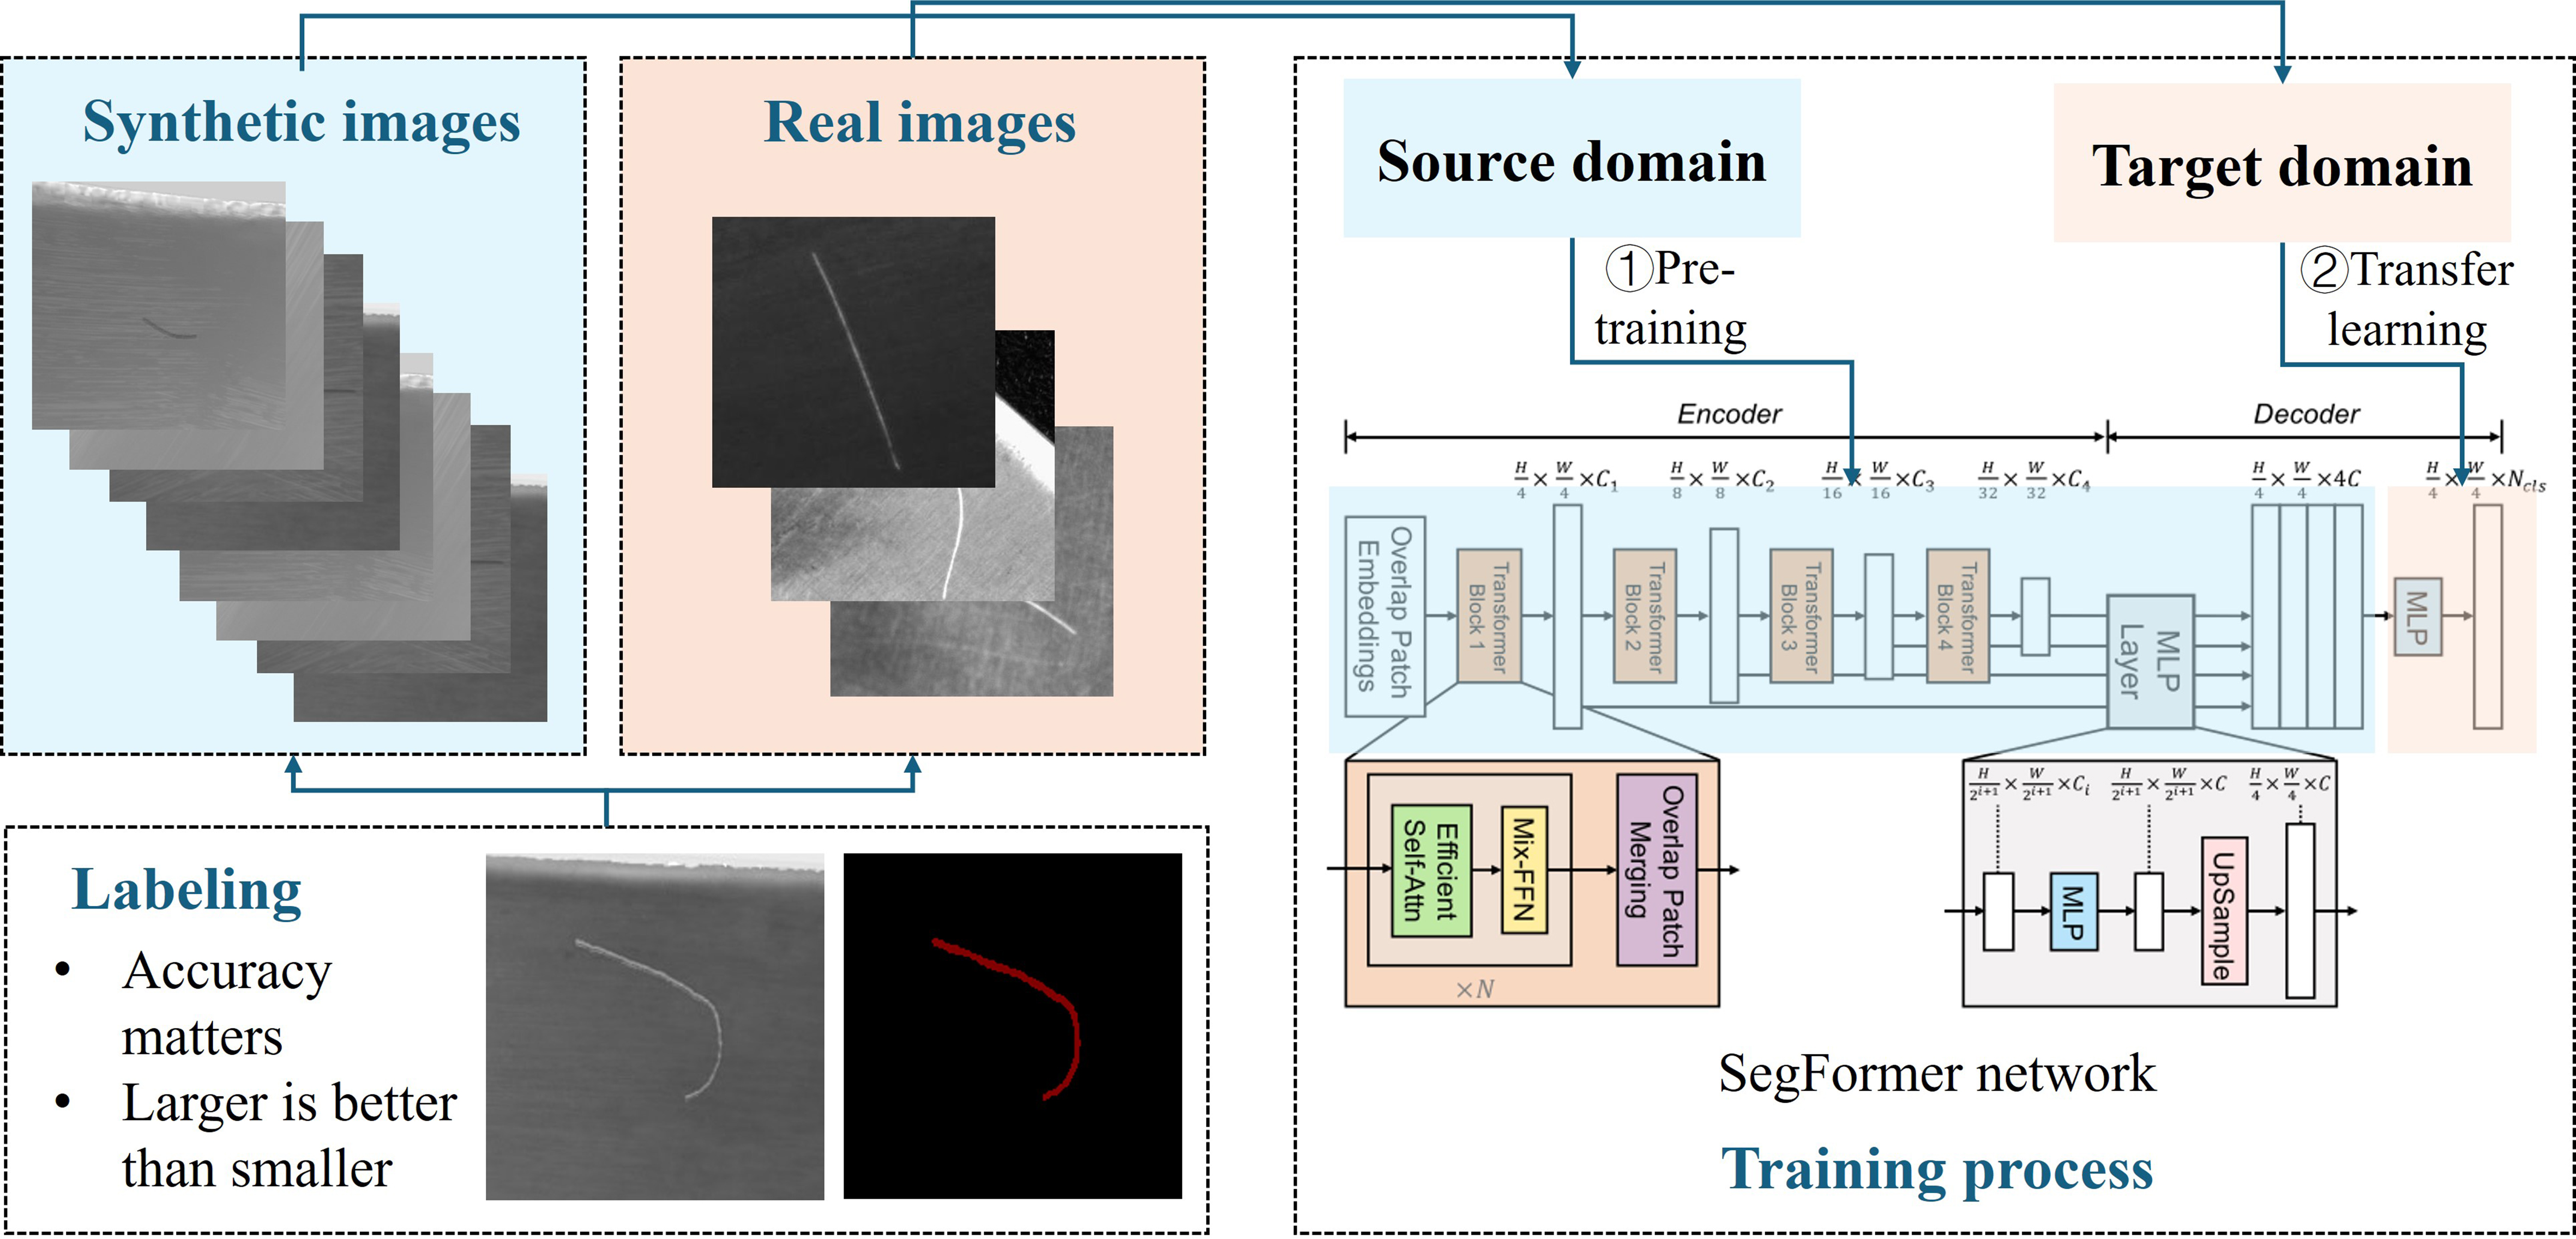
Figure 7. Segmentation model development method. The SegFormer network is pre-trained by physical synthetic images, then transferred to the small batch of real images to achieve better segmentation performance. FFN: Feed-forward networks; MLP: multi-layer perceptron.
Keeping high labeling quality is one of the keys to achieving better segmentation performance. For synthetic images, the labels can be generated directly from the rendering settings, but there are situations where multiple adjacent pixels could be the boundary as the scratch cross-section covers a certain area. In these cases, larger labeling areas are preferred rather than smaller ones to include all the boundary features.
CNNs are among the most widely adopted architectures for surface defect detection. They mainly focus on local pixel patterns and perform well for tiny defects. However, scratches are usually thin and long and may exceed the receptive field. In contrast, transformer-based structures are able to capture global feature connections and are more suitable for scratch features. Therefore, a lightweight transformer-based segmentation network, i.e., SegFormer[35], is adopted in this paper for efficient and accurate scratch segmentation.
The most common strategy for combining synthetic and real images is to directly mix them into a single dataset. However, because the amount of synthetic data is much larger than that of real data, unique features in the real images may be overlooked. Therefore, a transfer learning approach is adopted. First, the SegFormer model is trained using only synthetic images. Then, the model is fine-tuned on real images to emphasize real-image features. In this way, better segmentation performance can be achieved.
RESULTS AND DISCUSSION
Experimental setups
For capturing real scratch images of aero-engine blades, an industrial monochrome camera with 5,120 × 5,120 resolution is applied as shown in Figure 8A. A ring light that is larger than the blade is used in this case to make the light distribution as even as possible on the blade surface. The camera is calibrated using a standard chessboard calibration board before experiment. For 3D mesh scanning of the parts, the RigelScan Max 3D laser scanner is used [Figure 8B]. For physical-based rendering, the Arnold rendering engine in Autodesk Maya software is used to generate synthetic images with the same resolution as camera. All proposed algorithms were developed in a Python 3.8 environment using PyTorch 1.10.1 and OpenCV, and were run on an Intel Core i9 central processing unit (CPU) with 64 GB random-access memory (RAM) and a GeForce RTX 3060 graphics processing unit (GPU).
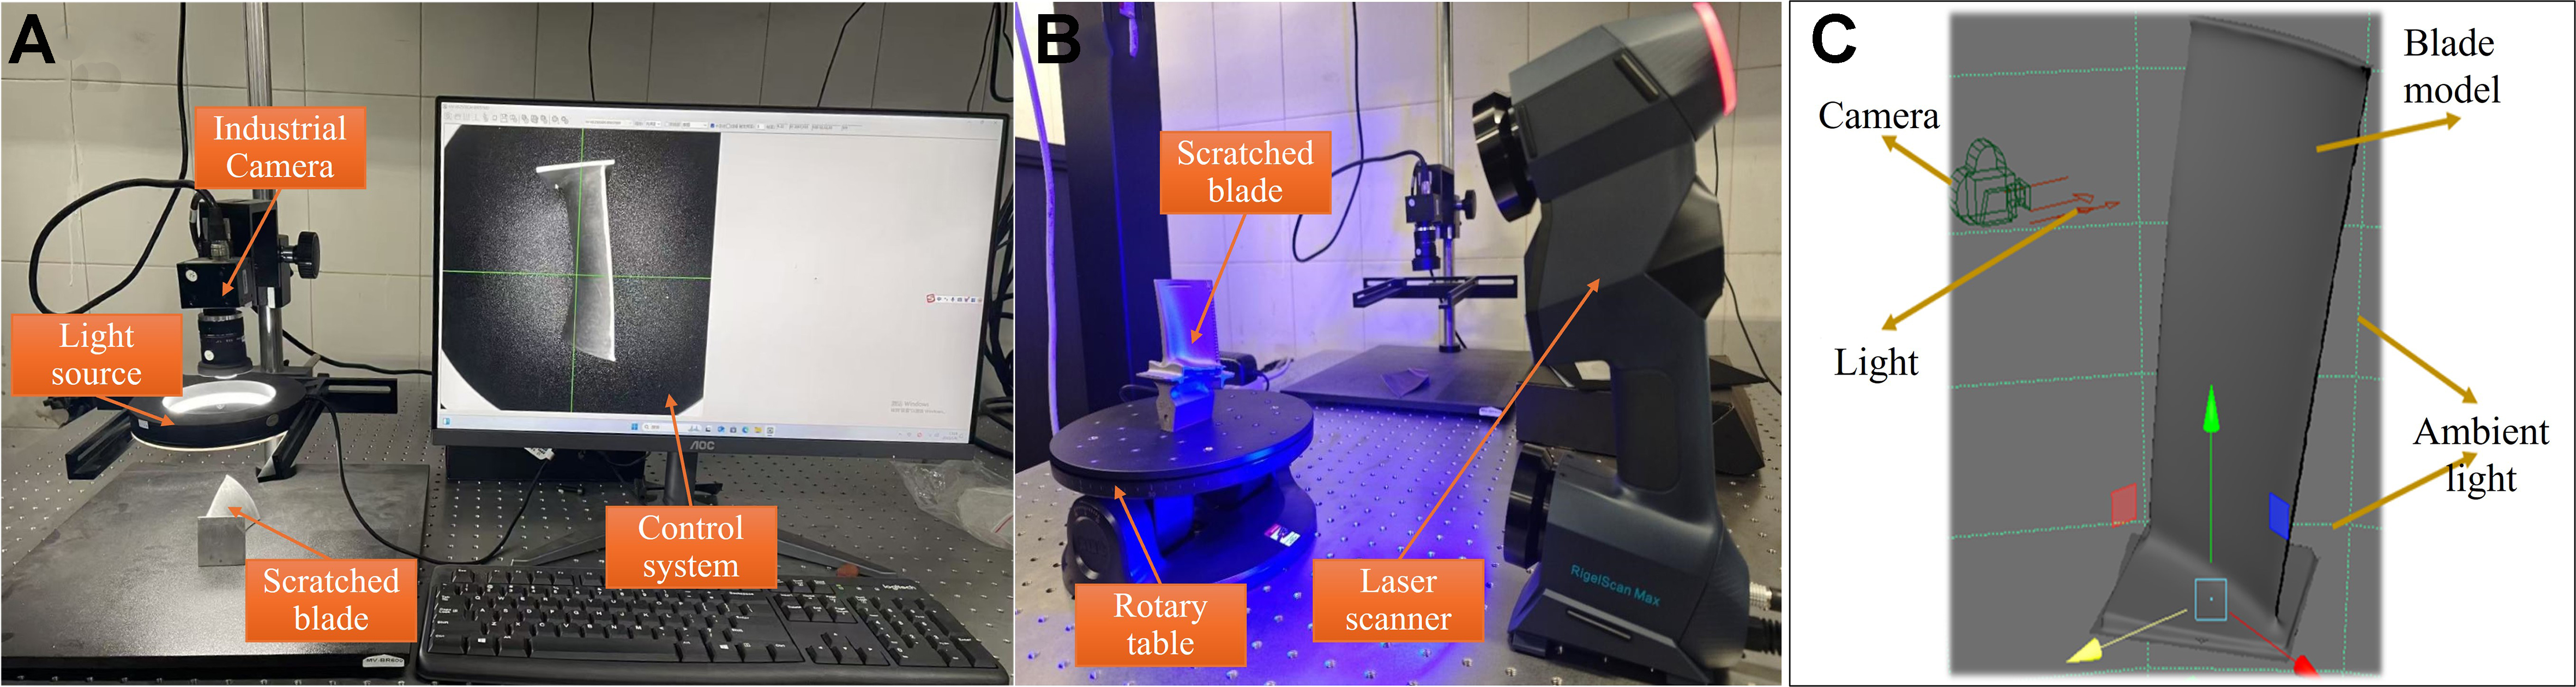
Figure 8. Equipment setups for (A) image capturing and (B) 3D mesh scanning (C) rendering scene. Photograph taken by the authors.
For the datasets, a scratched titanium blade is used as an example. For the scratch definition, we choose FN = 40, HV = 35, w = 0.8, A = 0.6 based on our observation. These settings can be modified for different materials, parts and severity of defects. For rendering, the scene settings, including camera pose and light direction, are shown in Figure 8C. The resolution is set to 5,120 × 5,120, which is the same as that of the camera. The surface texture is defined using color, metallic, roughness, and normal maps, as shown in Figure 6. A total of 200 real scratch images are acquired using the industrial camera, and 1,200 synthetic images are generated through the rendering process. Different camera positions and angles, lighting positions and conditions, and scratch shapes and positions are included in the rendering process trying to cover different possibilities. Examples are presented in Figure 9. We use 100 real images as the test set for all experiments to guarantee that the results reflect the segmentation capability on real images, and the rest for training based on different setups. For the training process, the data were split into training and validation sets at a ratio of 9:1. During the training process, the AdamW optimizer and cross-entropy loss are used. The batch size is 32, initial learning rate is set to 0.0001 and weight decay is 0.01. The maximum training iteration is 500 and early stopping is adopted to alleviate over-fitting.
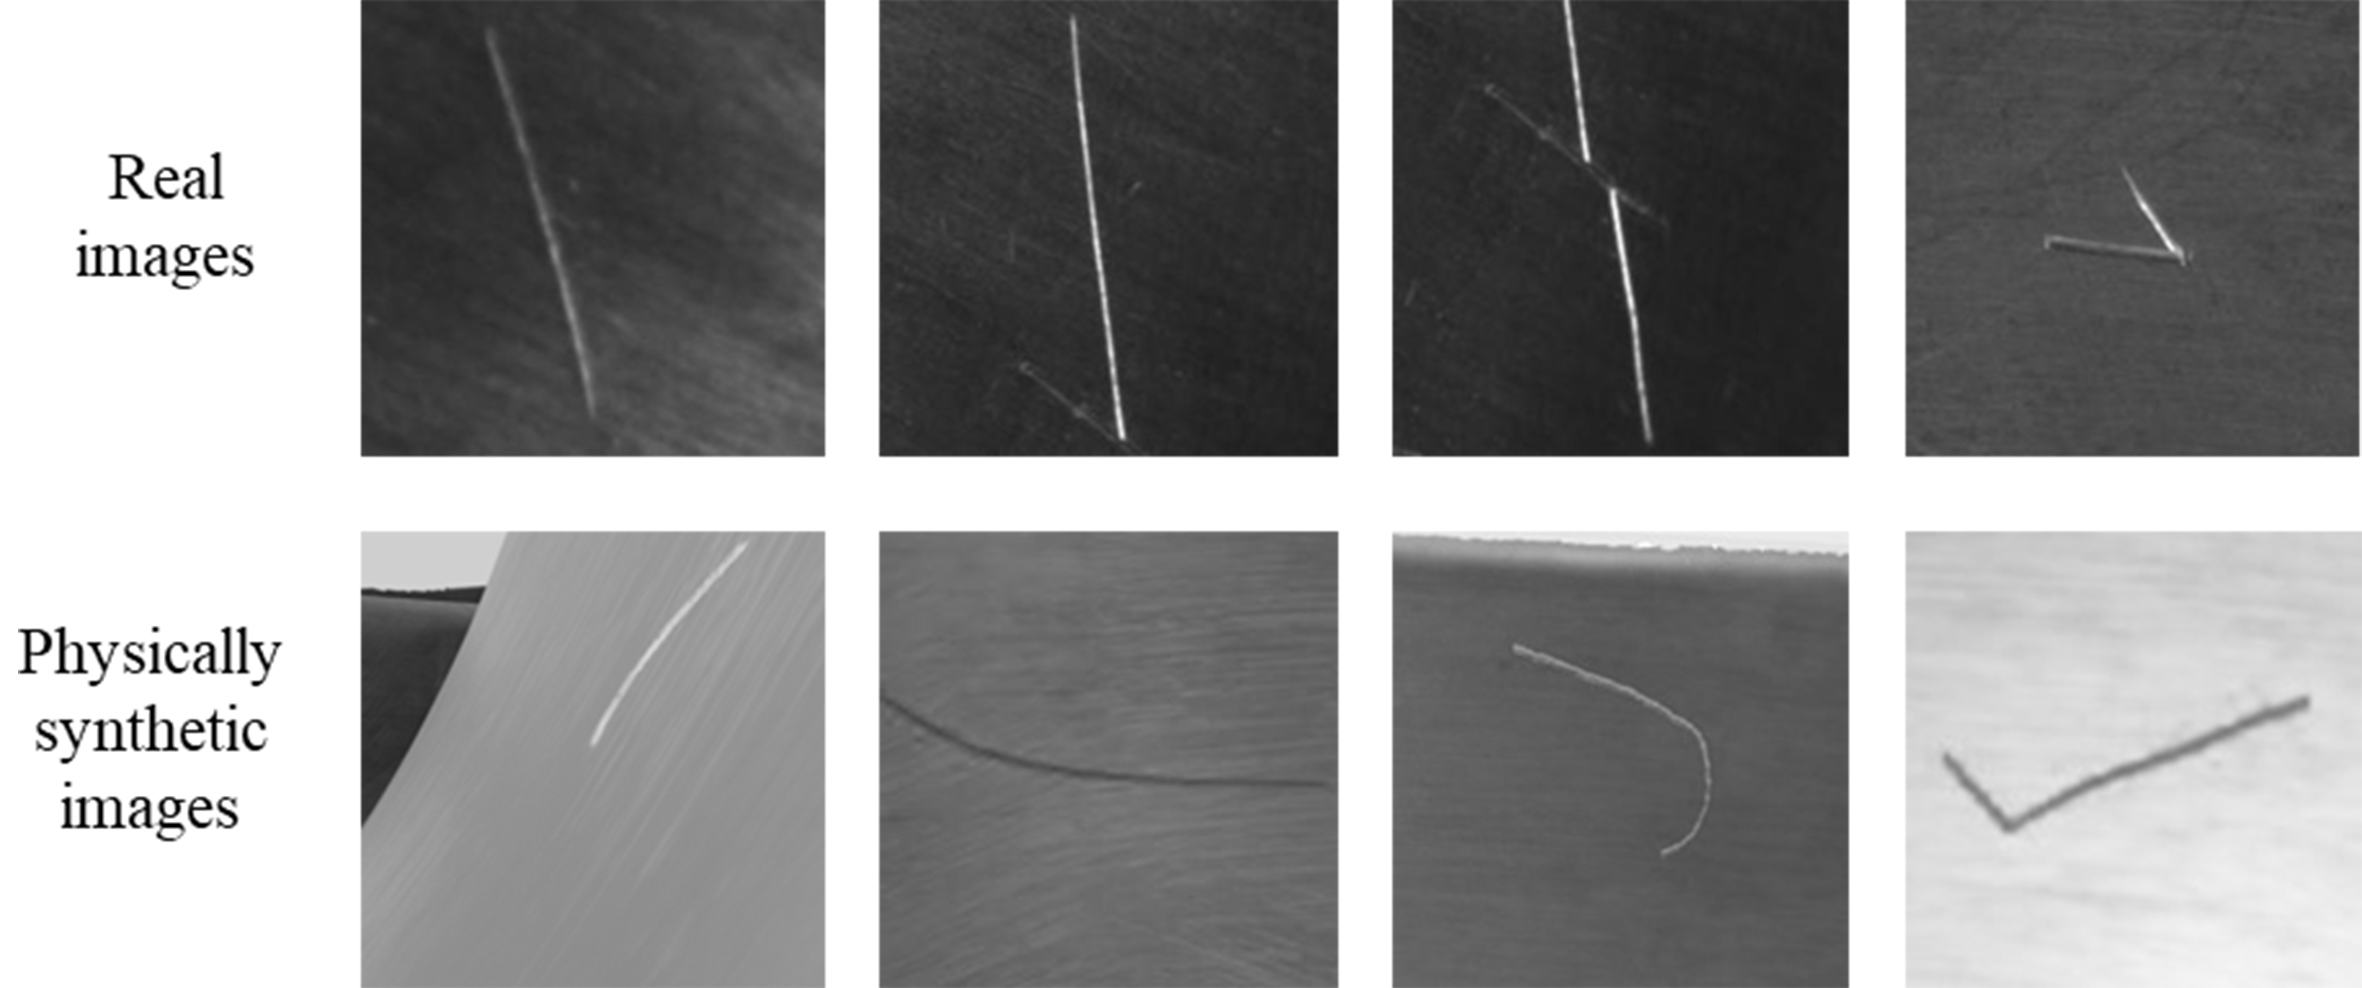
Figure 9. Examples of real and synthetic images.
To evaluate the performance of the segmentation networks, the intersection-over-union (IoU) as one of the most common metrics is applied in this research. It can be calculated as:
where T is the ground truth scratch areas and P is the predicted scratch areas by the networks in the images.
Comparison of segmentation networks
First, we compare several commonly used segmentation networks, including U-Net[36], DeepLab v3+[37], SegNet[38] and SegFormer, to select a better one for the subsequent investigation of the generated data. The first three networks are CNN-based models, whereas the last one is a transformer-based model. We randomly split the 100 real training images into 90 training samples and 10 validation samples, and repeated this process three times. The average IoU was then calculated for each network. The results are presented in Figure 10A. It can be noticed that the transformer-based model outperforms the CNNs-based models. The detailed comparison is presented in Table 1. It shows that the difference in terms of precision is not evident, while the recall of the CNNs-based networks performs much worse, indicating that they tend to miss the scratch areas. The reason could be that the CNNs-based models mainly focus on the local patterns within the receptive field, while the scratches are usually long and require a global view to be better identified. A good example is also provided in Figure 10B. The segmentation results for CNNs-based models are more discontinuous as they lack the capability to find global feature connections. SegFormer performs obviously better in this perspective. Therefore, it is chosen for the following investigation. As the contour accuracy of the scratch is the most important, the IoU is mainly considered in the following experiments.
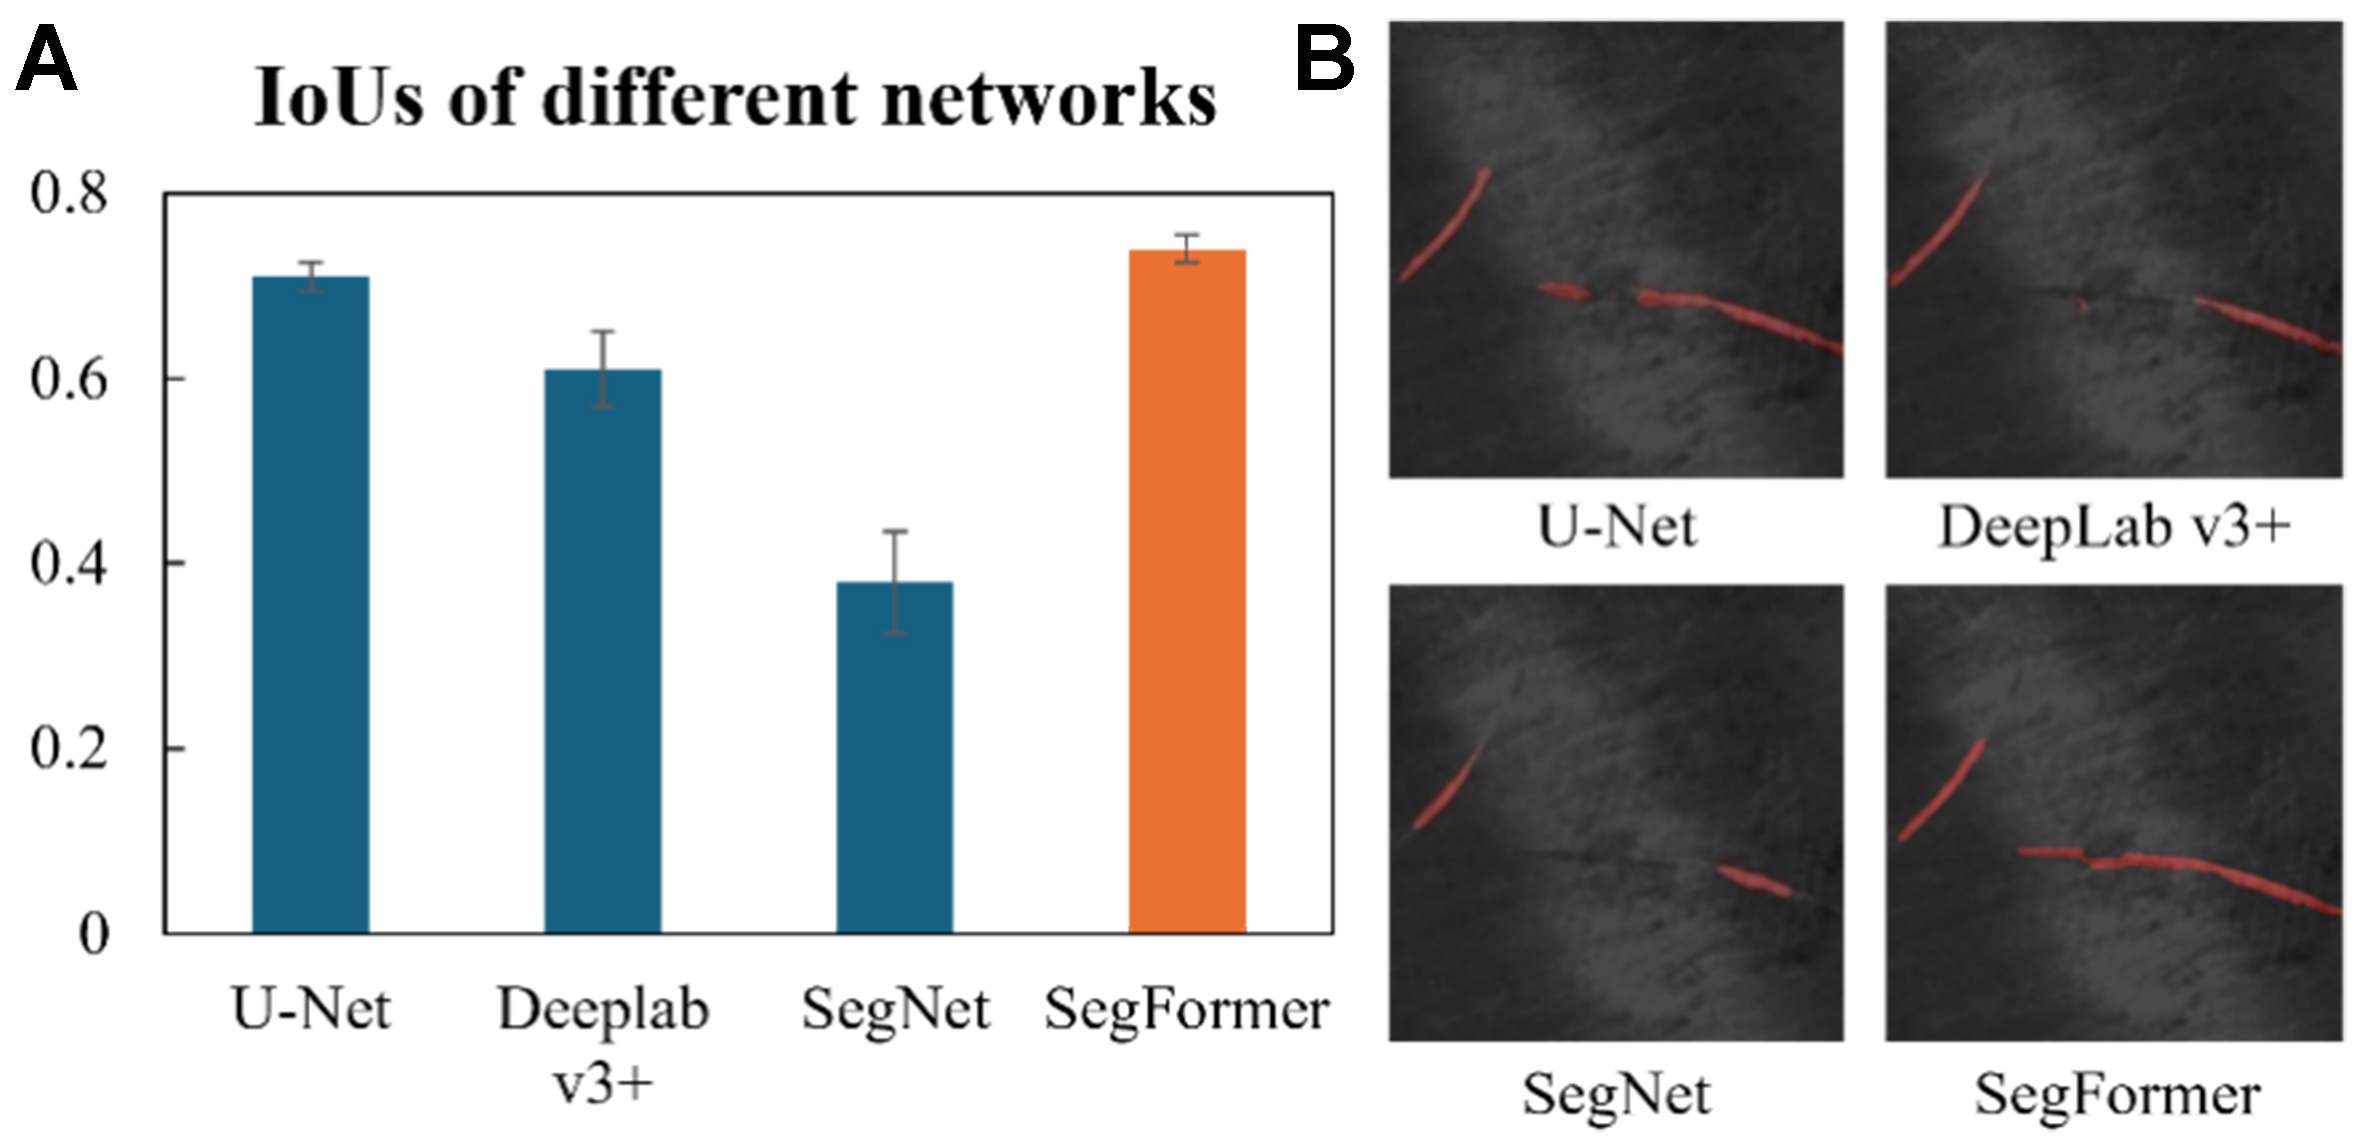
Figure 10. Segmentation (A) IoU values and (B) examples, where red pixels indicate scratch areas identified by the models. SegFormer achieves an IoU of 0.74 and performs the best among these networks. IoU: Intersection-over-union.
Quantitative performance of four segmentation models in terms of IoU, precision, and recall
| IoU | Precision | Recall | |
| U-Net | 0.71 | 0.83 | 0.85 |
| DeeplabV3+ | 0.61 | 0.89 | 0.58 |
| SegNet | 0.38 | 0.80 | 0.43 |
| SegFormer | 0.74 | 0.90 | 0.89 |
Physical synthetic images vs. images from data-driven generative models
Synthetic data is mainly used for limited data scenarios. Therefore, we assume that there are only f than 20 real images for training. Still, the 100 real images are used for testing. Here we mainly compare the performance of physically based and data-driven synthetic images. Conditional GANs[39] are among the most popular data-driven image generation models for defect segmentation, as they allow control over defect geometries through predefined masks[40]. Therefore, they are selected for comparison. For synthetic images, we integrate 0, 10, and 20 real images to evaluate performance. For GANs training, 20 real images are used, which are also employed for training the SegFormer network.
The images generated from GANs are presented in Figure 11. Compared with the real images in Figure 9, the texture and style of the generated images are very similar. Therefore, data-driven generative models are effective at mimicking the texture style of real images. However, all the images appear flat and lack a sense of depth, indicating that geometric constraints are not fully captured in the GANs model, making it difficult to generate realistic imaging changes caused by complex geometries. In contrast, the physically based synthetic images in Figure 9 better represent spatial differences, although their texture style is not as realistic as that of data-driven methods.
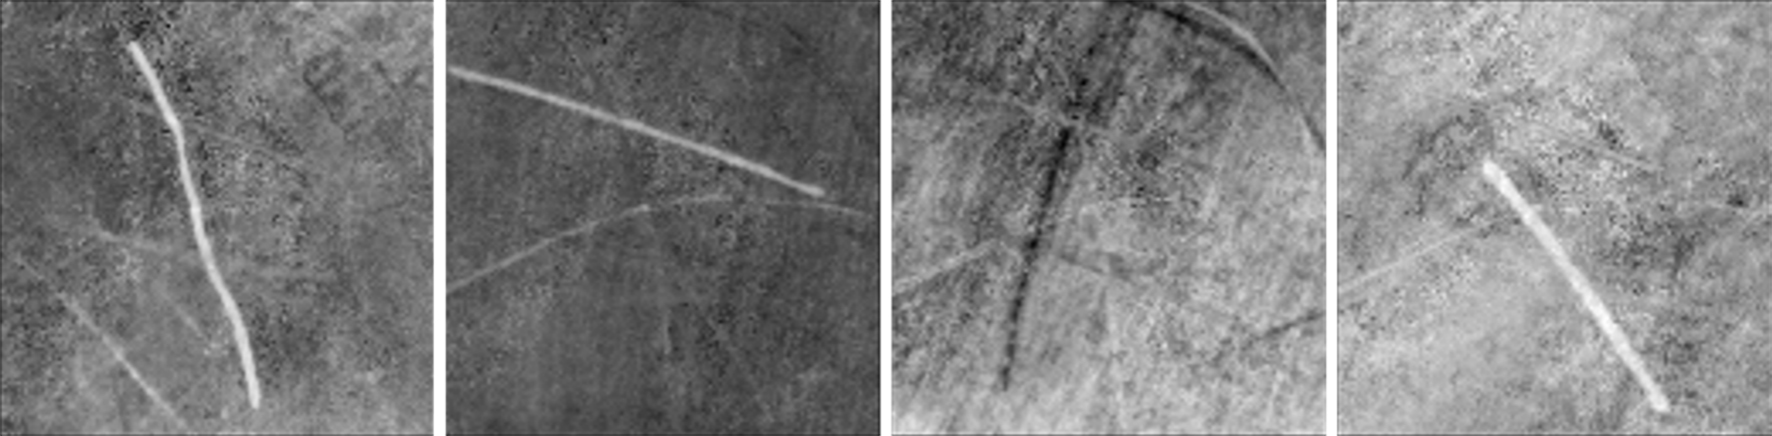
Figure 11. Images generated by conditional GANs. GANs: Generative adversarial networks.
The segmentation model training results with different synthetic images are shown in Figure 12. For G_20, performance increases quickly with 100 synthetic images but decreases after 200 generated images. In comparison, results with physically based synthetic data (P_0, P_10, and P_20) continue to improve even with 1,000 generated images. Since the data-driven model introduces more texture variations while the physically based model provides more spatial information, these results indicate that spatial information is more important for segmentation performance. Meanwhile, because there are fewer dark scratch images in the real dataset, GANs perform poorly in generating dark scratches (e.g., the third image in Figure 11), showing that data-driven methods cannot reliably generate new or correct information beyond the distribution of existing real images. This phenomenon has also been reported in other studies[25].
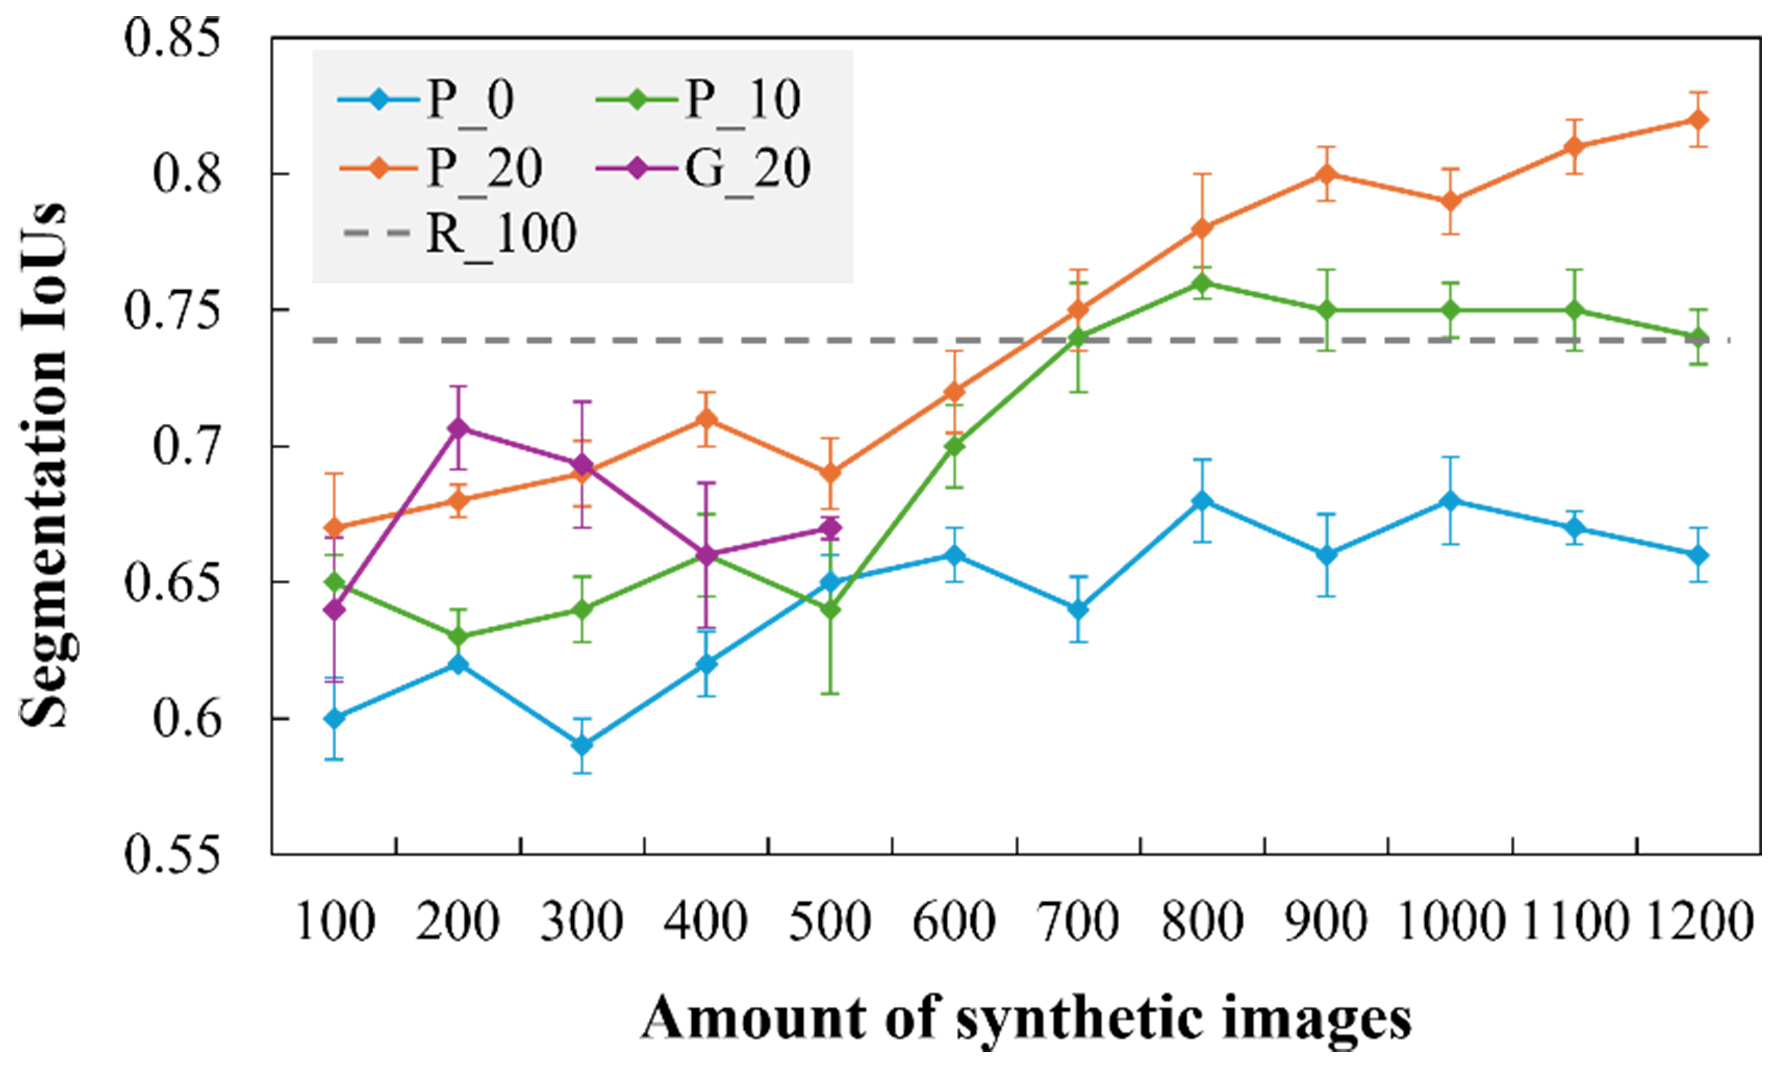
Figure 12. Segmentation performances with different synthetic and real datasets. The P_0, P_10, and P_20 use physical synthetic images with 0, 10, 20 real images respectively. The G_20 uses GANs-based synthetic images with 20 real images. The R_100 uses 100 real images without any synthetic images. The synthetic and real images are directly mixed into one training set in each training process. GANs: Generative adversarial networks.
The results for P_20 indicate that physically based synthetic images are effective in improving segmentation performance when real images are limited. With 1,200 synthetic images, the IoU improves from 0.66 to 0.83. Compared with R_100, real images remain more efficient for segmentation model training: using only 100 real images, the IoU reaches 0.74, whereas 700 physically based synthetic images are required with 20 real images to achieve similar performance. In this scenario, approximately nine physical synthetic images are needed to replace one real image. However, since physically based synthetic data and their labels can be efficiently generated in batches, this approach remains a useful compensation method when real images are limited. Labeling for segmentation is time-consuming: if manually labeling one image takes 1.5 min, using synthetic images can save about 2.5 h per 100 real images.
Comparing P_0, P_10, and P_20 shows that although real images are limited, they still play a critical role in improving the segmentation performance. The reason could be that the distribution of physical synthetic data is different from the real data, especially in terms of texture style. For P_0 with no real images involved, the model tends to learn the specific features in synthetic data and has difficulty making it work on real images. With the real data increased to 20, the model’s generalization ability is evidently improved, even if the real data only occupies a small portion in the whole dataset. Therefore, integrating some real images can maximize the influence of physical synthetic images. This also proves that texture style information is less rich than spatial information and can be compensated by a small number of real images.
To verify the generality of these findings, we conducted an additional experiment on a superalloy part with a flat surface. The results are shown in Figure 13 and exhibit similar trends as the number of physical synthetic images increases. Since the flat structure is simpler, fewer synthetic images are required to achieve high segmentation performance.
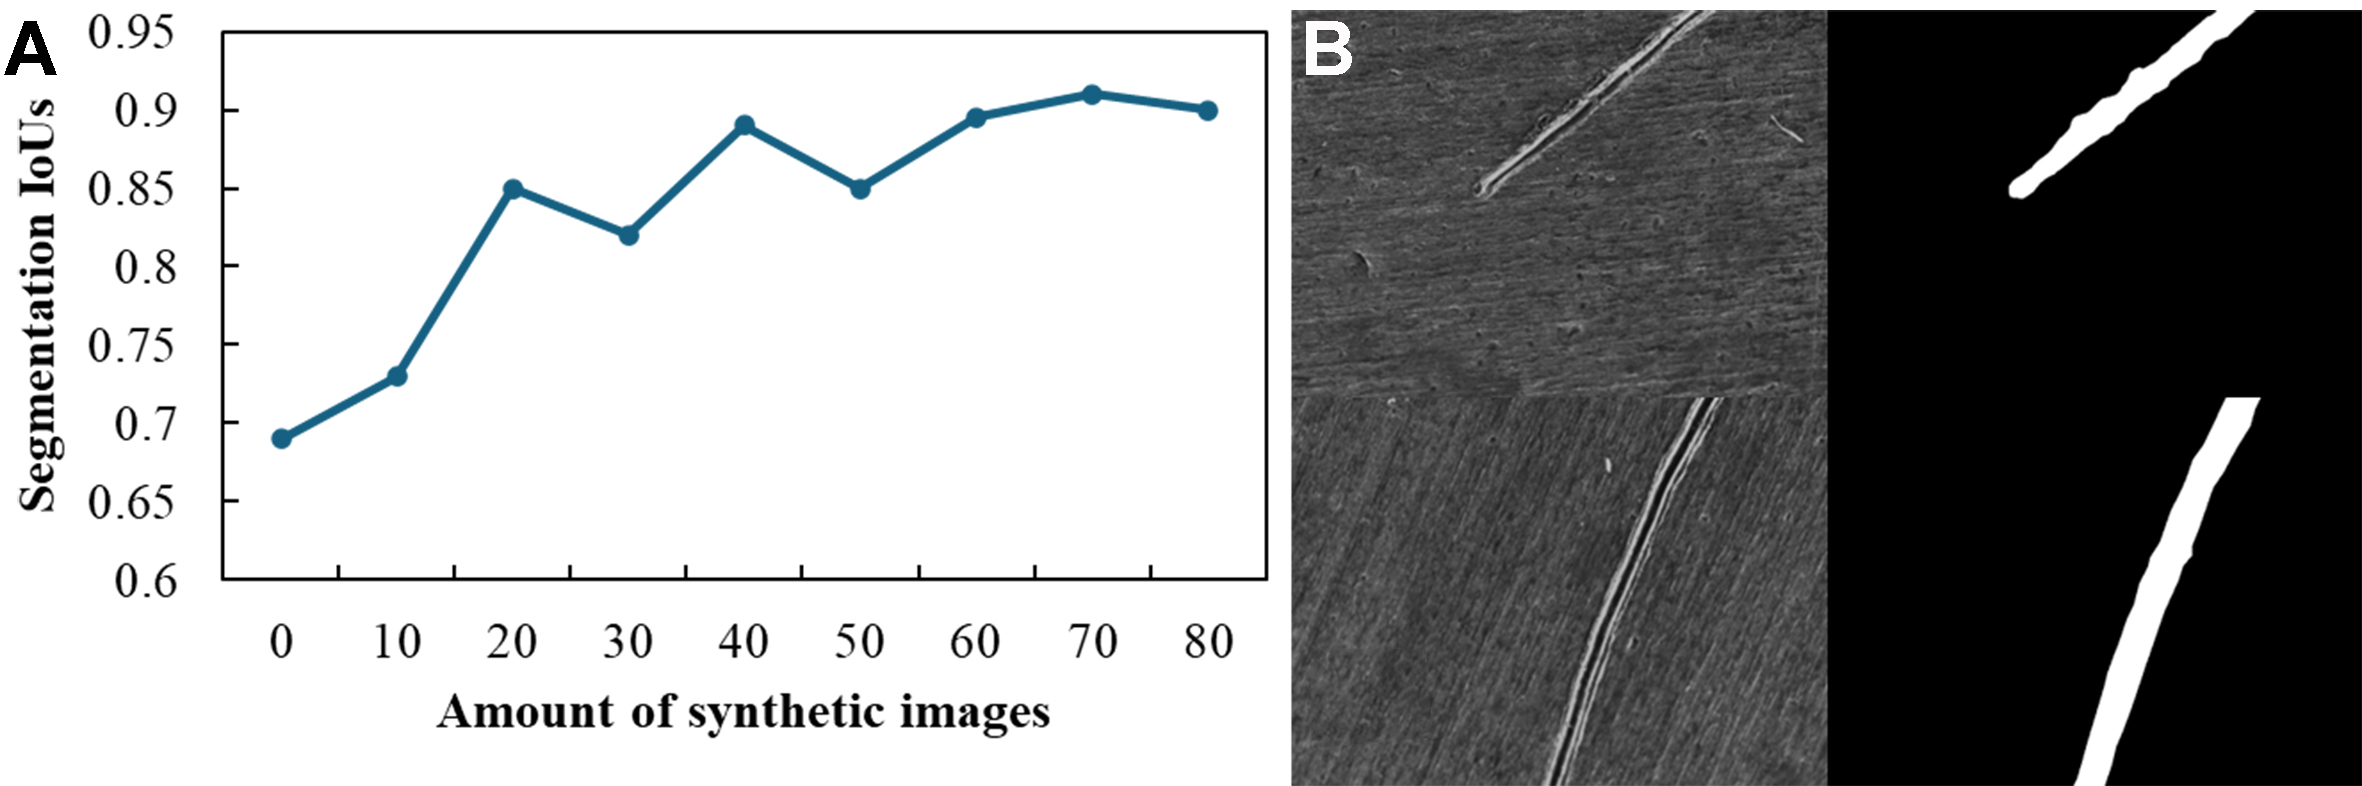
Figure 13. Segmentation performances with a flat superalloys part with 10 real images. (A) IoU with different numbers of synthetic images (B) example of segmentation results. IoU: Intersection-over-union.
Influence of synthetic image quality
The quality of physical synthetic images may influence the segmentation performance. As texture settings are the key factors that influence the similarity of the synthetic images and the real images, we control the synthetic images through different texture settings, i.e., roughness maps, metallic maps and color maps. To investigate this, we generated another two groups (groups 2 and 3) of images with different texture settings against the previously used ones (group 1) and combined with 20 real images. According to the proposed method in the Image Quality Assessment section, their qualities are evaluated as in Table 2. Some images in the three groups are displayed in Figure 14.
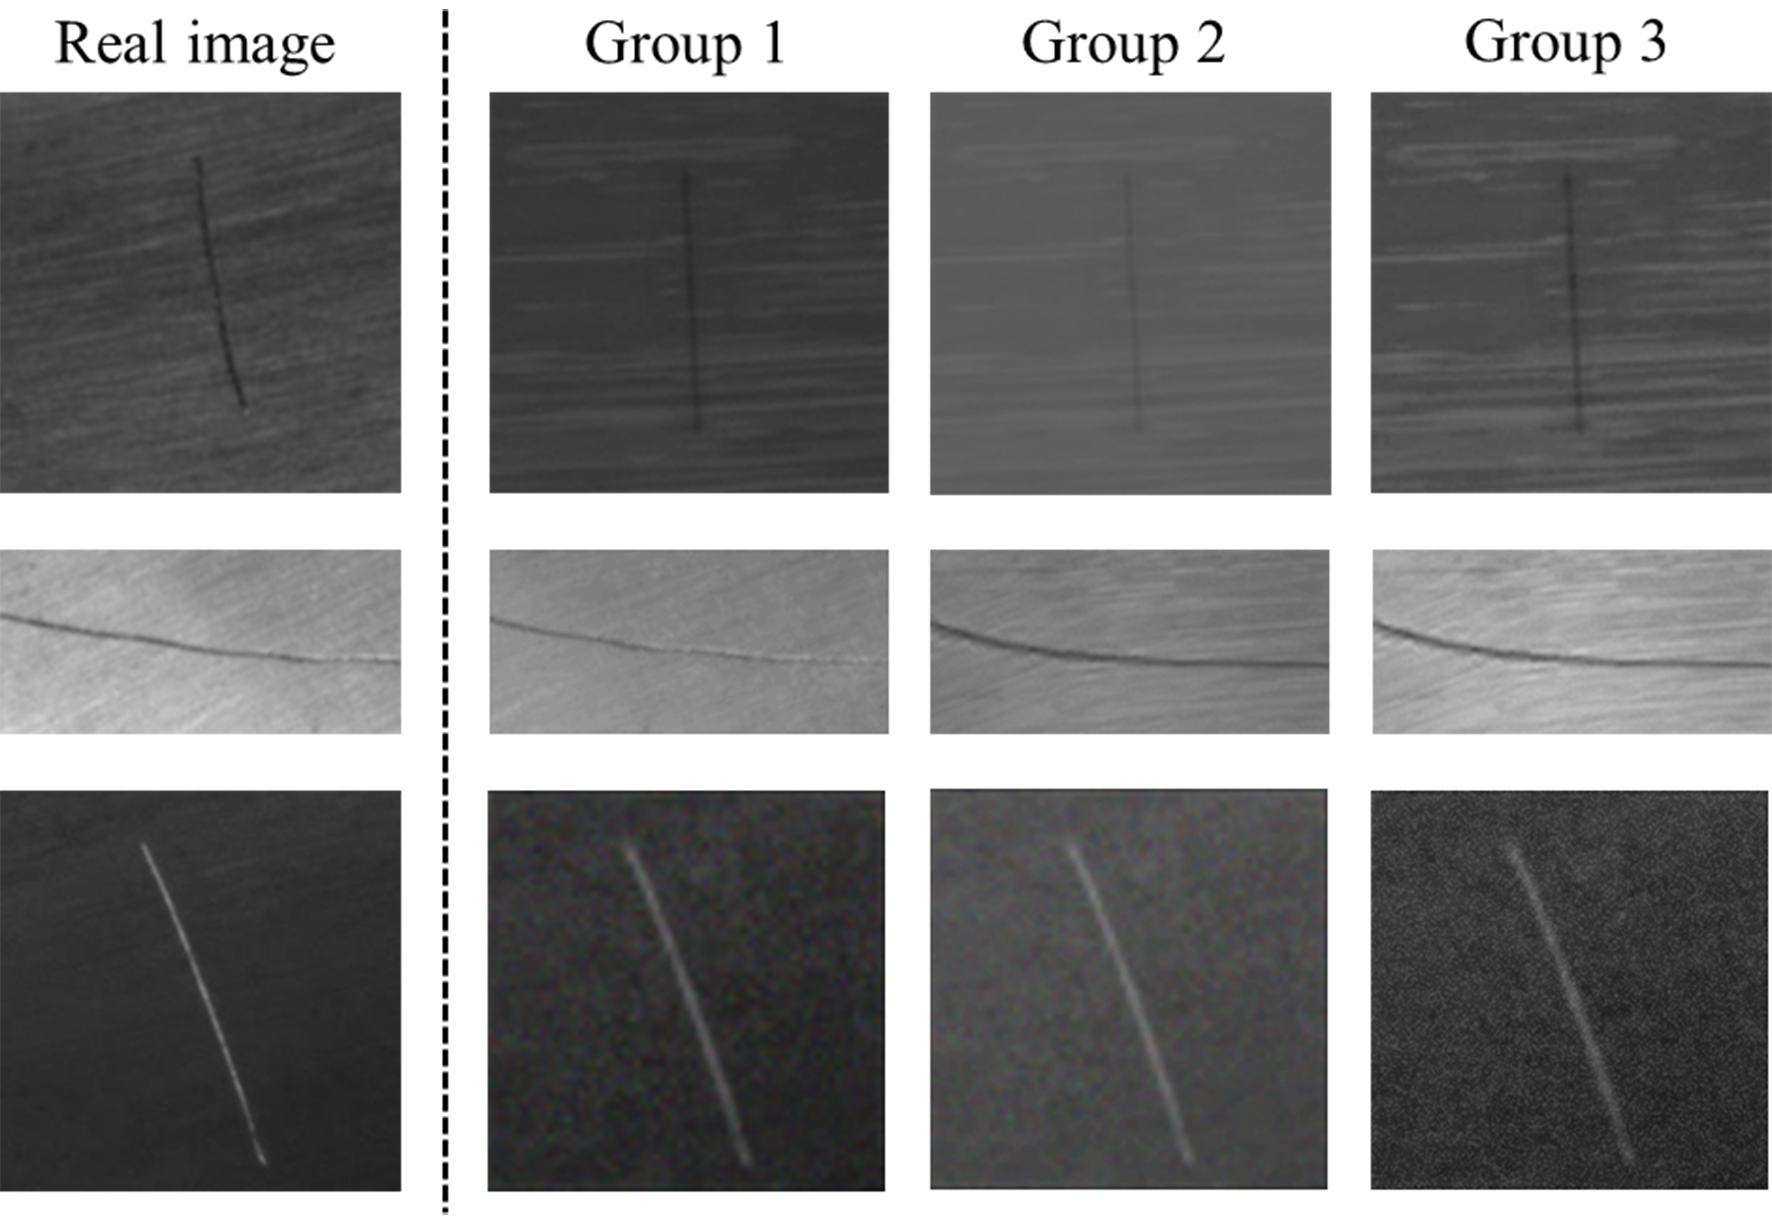
Figure 14. Examples of images in three groups (Groups 1-3).
Quality evaluation results of three texture settings
| PSNR | SSIM | |
| Group 1 | 34.70 | 0.87 |
| Group 2 | 27.55 | 0.76 |
| Group 3 | 23.44 | 0.54 |
The segmentation results based on synthetic images of different quality levels are shown in Figure 15. They indicate that image quality plays an important role in improving segmentation performance at early stages. As the total number of images increases, this effect diminishes, and the performance of the three groups converges. This suggests that larger quantities of synthetic data can partially compensate for missing features in lower-quality images. Nevertheless, higher image quality consistently benefits segmentation accuracy.
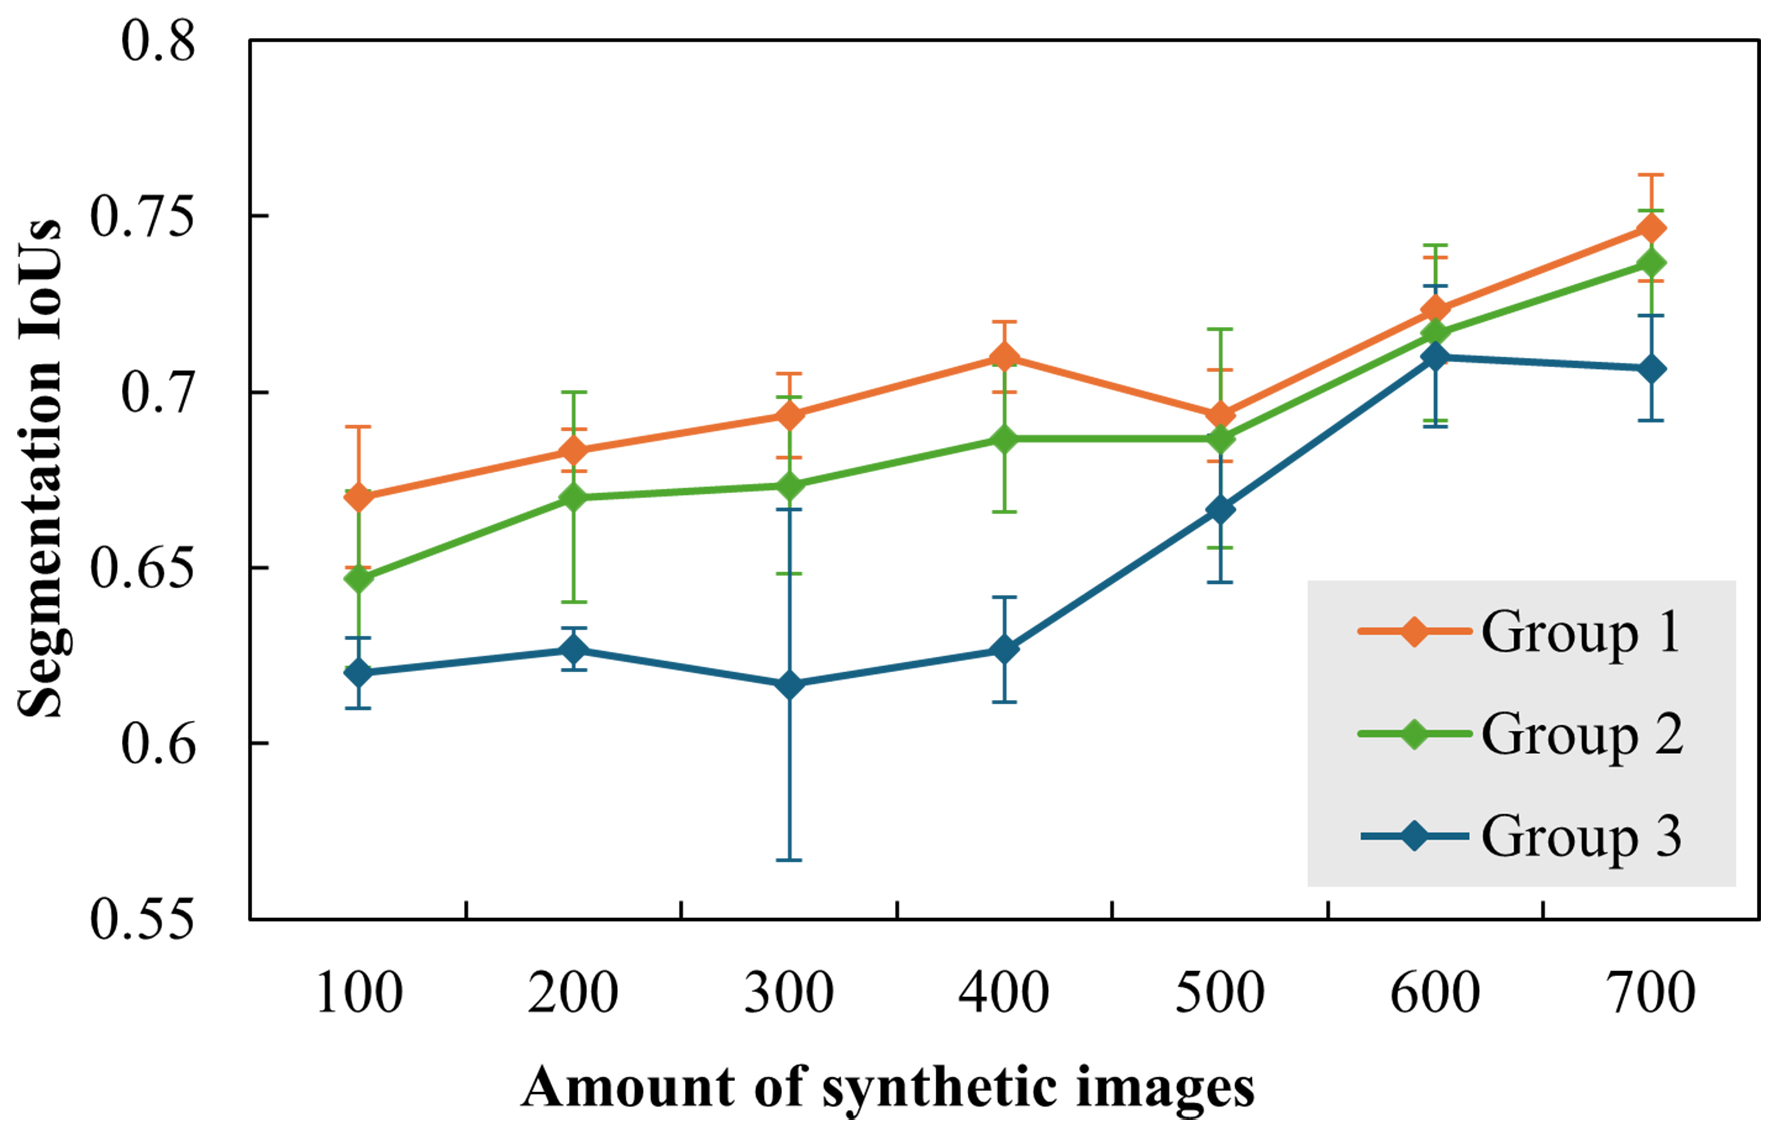
Figure 15. Segmentation results based on three groups of synthetic images with different qualities.
Influence of label quality
Label is another major factor that could influence segmentation performance. In this experiment, we use the outer boundary of synthetic scratches as the basic labeling status and gradually expand and shrink it for several pixels to evaluate the influence. For real images, we try to label them as accurately as possible. The training data is a combination of 1,200 physical synthetic and 20 real images. The labels could only shrink up to 5 pixels, so our experiment stopped there. The results, as presented in Figure 16, show that the labeling accuracy matters for scratch segmentation. An interesting phenomenon is that the larger coverage is slightly preferred than smaller. Although the larger coverage introduces redundant and misleading information, it still covers all the scratch features for extraction, while the smaller labels would miss the boundary features.
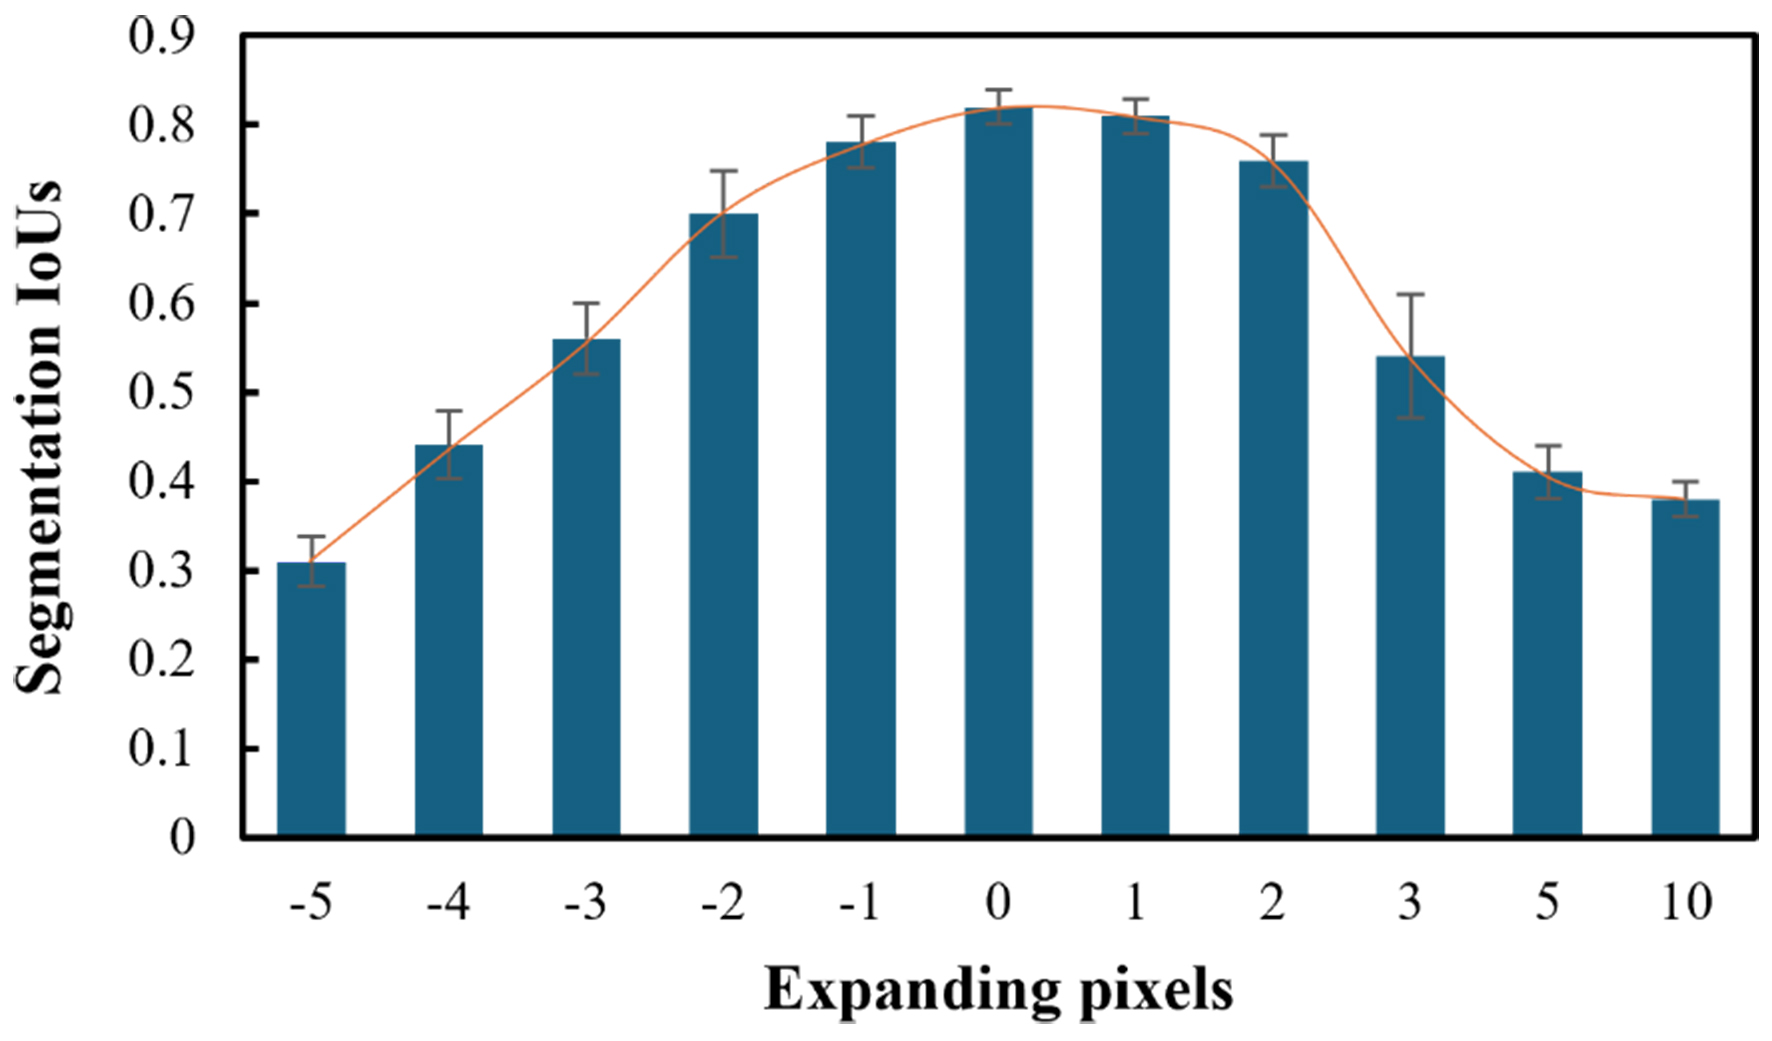
Figure 16. Segmentation results based on labels with different qualities. IoUs: Intersection-over-unions.
Evaluation of data fusion strategy
As the real images are not exactly the same as synthetic images, how to merge them for better performance also requires investigation. Here, we compare two common strategies - direct data merging and transfer learning - by combining either 10 or 20 real images with varying numbers of synthetic images (200, 400, 600, 800, or 1,000). The results in Figure 17 show that increasing the number of real images improves segmentation accuracy. In synthetic images, the effect of different lighting and imaging conditions and scratch shapes can be modeled by physical laws in computer graphics, while texture differences are the main cause of discrepancies between synthetic and real images. The continuous increasing trend in Figure 17 shows that the different scratch shapes and imaging settings carried by different synthetic data can bring new and meaningful information for the segmentation model and improve its generalization ability. Differences in texture can be compensated for by adding real images in the training process. If real images are limited, the merging strategy plays an important role. The transfer learning method shows a clear improvement (near 10%) in segmentation accuracy. The result of transfer learning with 10 real images is even better than data merging with 20 real images. This indicates that mixing a limited number of real images into massive synthetic images cannot make the segmentation networks fully focus on real features and may lead to learning too many synthetic features. With knowledge transfer, unique synthetic features are down-weighted, and real features are reinforced, resulting in better performance on real scratch images.
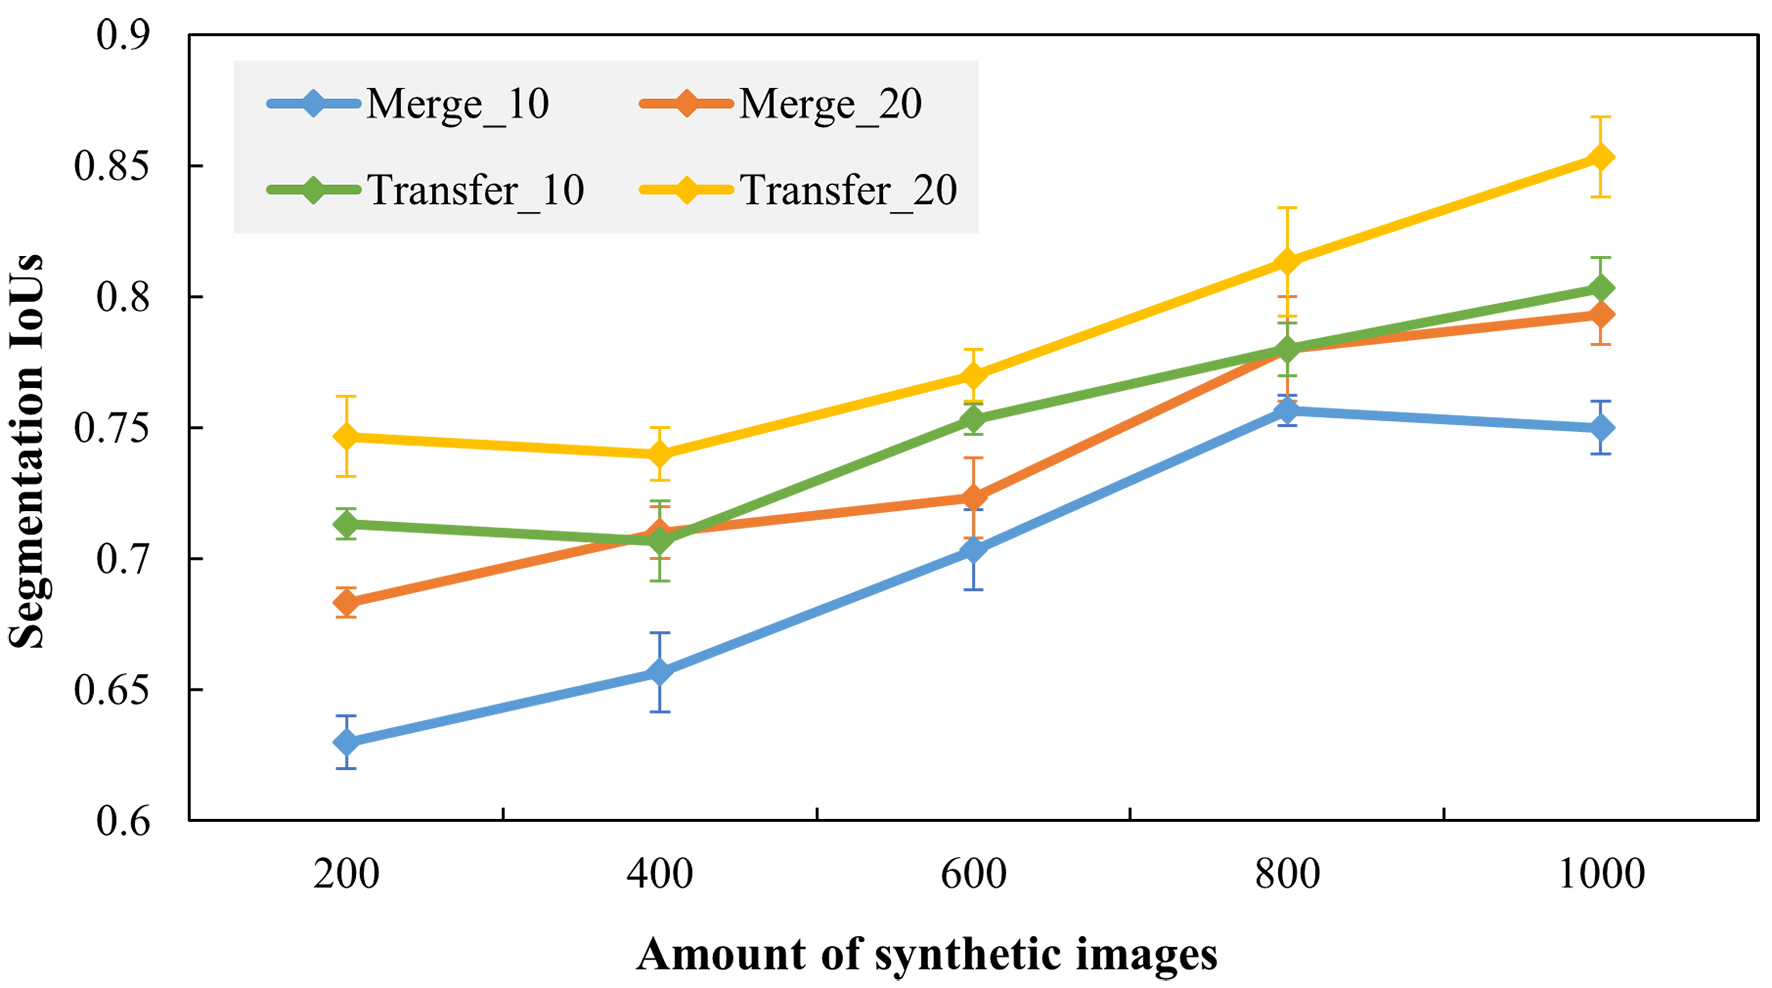
Figure 17. Segmentation results based on different training strategies. The Merge_10 and Merge_20 are using data merging strategy with 10 and 20 real images. The Transfer_10 and Transfer_20 are using transfer learning strategy with 10 and 20 real images.
Segmentation example analysis
Figure 18 presents examples of segmentation results from the proposed method using 1,200 synthetic and 20 real images for an intuitive understanding. Most scratch areas are identified correctly, showing that physical synthetic data can continuously provide useful information in large volumes for scratch feature extraction. The challenging areas are the transitions between light and dark regions, where the appearance changes significantly. In our rendering scenes, the scratching process is modeled as relatively steady, with consistent cutting depths and cutter directions, resulting in fewer dynamic situations, as seen in Figure 18B and C. This also demonstrates that the diversity of synthetic image distribution is important for accurate segmentation. The proposed physically-based method could be further optimized for these complex scenarios, while data-driven methods face difficulties generating features that do not appear in the existing data.
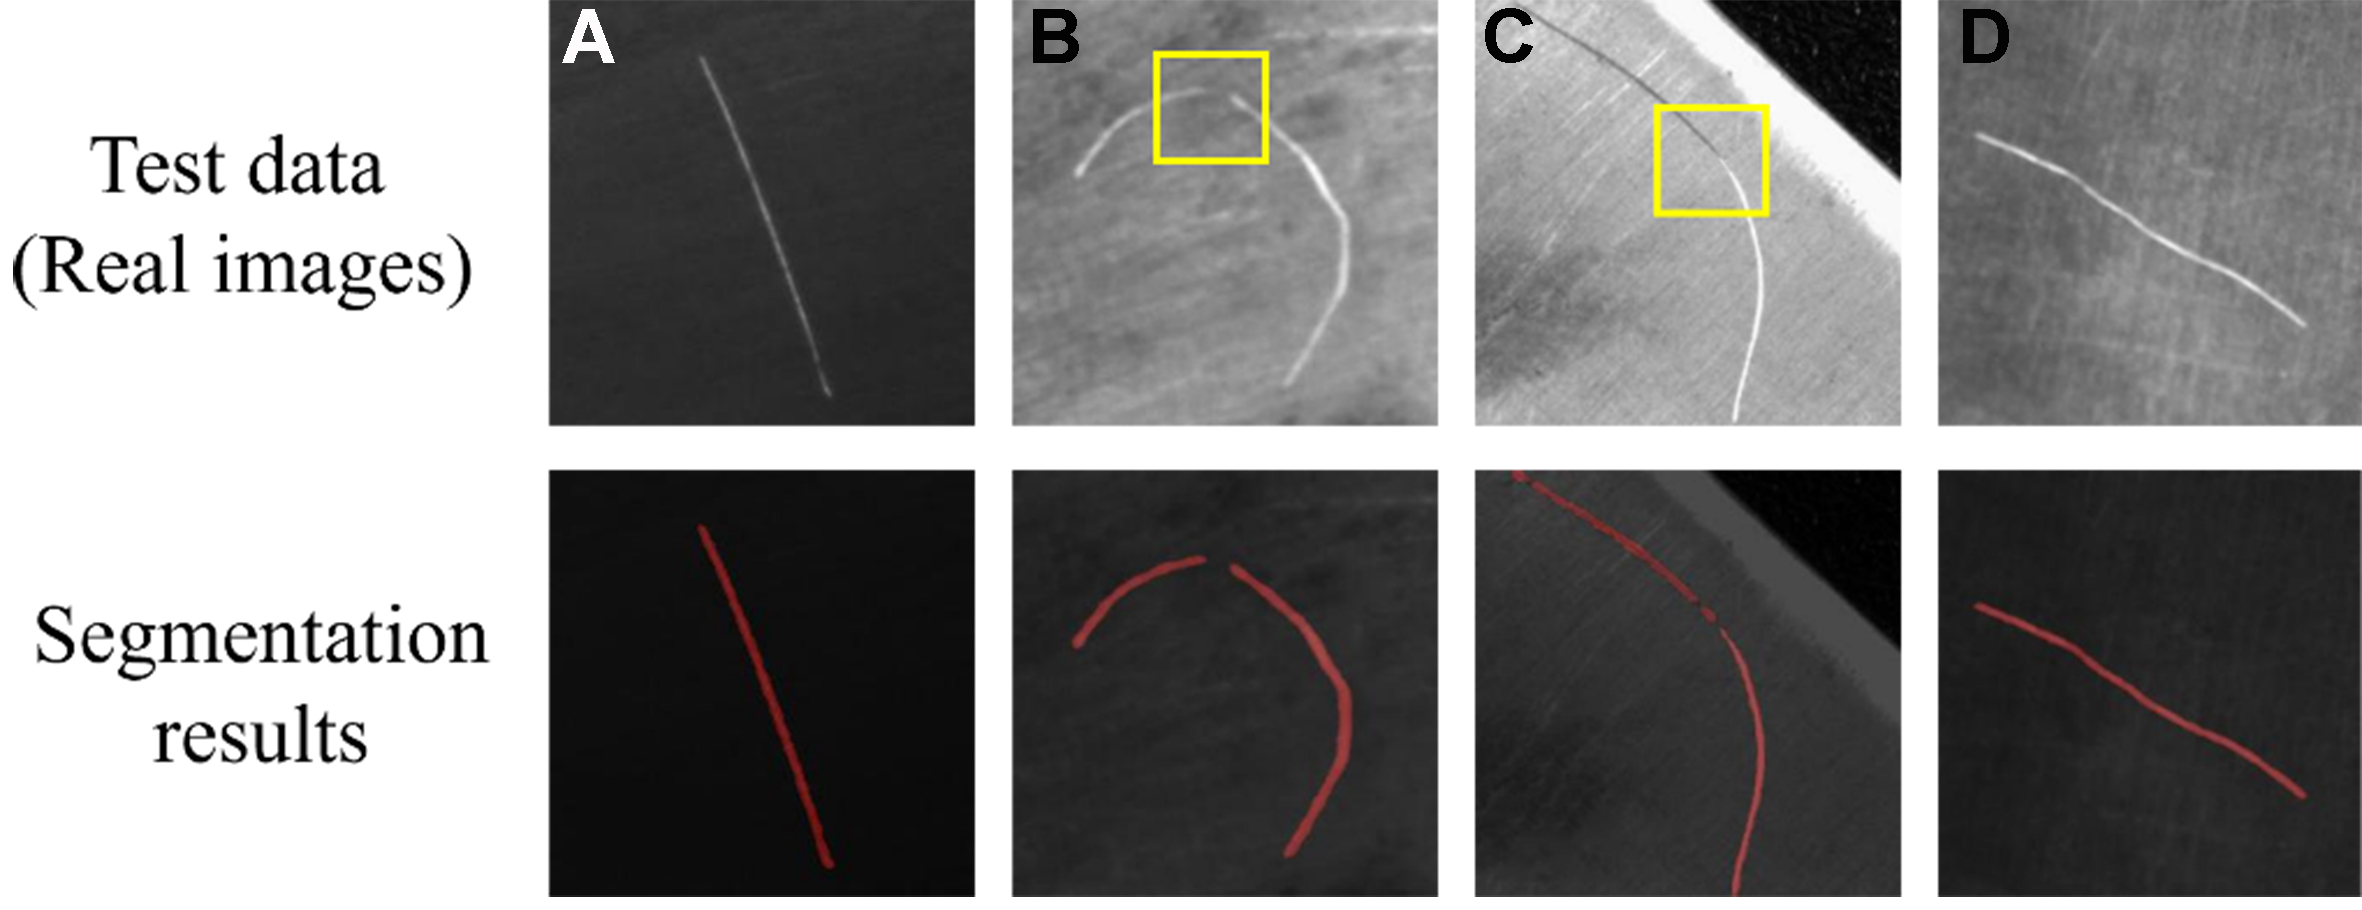
Figure 18. Four typical segmentation examples analysis. The results in (A) and (D) are accurate. In contrast, the yellow boxes in (B) and (C) highlight the undetected areas while the scratch presentation is changed evidently.
CONCLUSIONS
Defect-accurate segmentation is crucial for surface inspection and quality evaluation of aerospace alloys. This paper proposes the use of physical synthetic data for scratch segmentation on complex aerospace alloy parts under limited-data conditions. A comprehensive workflow - from scratch feature randomization, image generation, and quality assessment to model selection and training strategy - is presented to achieve accurate scratch segmentation. The influences of the segmentation model, the ratio of synthetic to real data, image and label quality, and data fusion strategy are investigated through experiments. The main findings are as follows:
Physical synthetic image generation: A physically-based method is proposed for scratch segmentation on free-form surfaces with limited data. Results show that this approach can significantly expand the coverage of possible scratch image distributions and improve segmentation robustness compared to data-driven methods.
Data quality matters. Higher similarity between physical synthetic data and real images improves segmentation accuracy. However, the impact diminishes as the dataset size increases.
Key factors for integrating synthetic data. Transformer-based models are preferred to capture global scratch features. Label quality and coverage also influence performance. Transfer learning can substantially improve model generalization on real datasets.
For future work, scratches should be defined more flexibly to simulate complex scenarios, such as cross scratches and shallow micro scratches. The method could also be extended to other defects, such as dents, pits, and cracks. Developing a comprehensive defect model library covering typical aerospace alloy products for synthetic image generation would facilitate the application of AVI systems in real aerospace production. Additionally, simulating penetrating radiation for internal defects represents another important area for exploration.
DECLARATIONS
Authors’ contributions
Made substantial contributions to the conception and design of the study and performed data acquisition and interpretation: Wang, Y.; Wang, P.; Bai, Y.; Wang, W.; Zhu, M.
Made substantial contributions to literature analysis and manuscript writing: Wang, Y.; Wang, P.; Bai, Y.
Performed results analysis, discussion, and manuscript revision: Wang, Y.; Wang, W.; Bai, Y.; Zhu, M.; Luo, M.
Provided administrative, technical, and material support: Wang, W.; Zhu, M.; Luo, M.
Availability of data and materials
The data are available from the corresponding author upon reasonable request.
AI and AI-assisted tools statement
Not applicable.
Financial support and sponsorship
This work was supported by the National Natural Science Foundation of China (No. 52375516; No. 52005439) and the Natural Science Basic Research Program of Shaanxi (No. 2025JC-YBQN-649).
Conflicts of interest
All authors declared that there are no conflicts of interest.
Ethical approval and consent to participate
Not applicable.
Consent for publication
Not applicable.
Copyright
© The Author(s) 2026.
REFERENCES
2. Han, K.; Tan, L.; Yao, C.; Zhang, D. Evolution and anti-fatigue mechanism of surface characteristics of Ti60 alloy induced by ball burnishing and shot peening during tensile-compression fatigue. Eng. Fail. Anal. 2024, 159, 108136.
3. Zhang, T.; Wang, W.; Dong, R.; et al. Physics-guided neural network for grinding temperature prediction. J. Eng. Design. 2024, 36, 707-30.
4. Sun, Y.; Yao, C.; Tan, L.; et al. Surface integrity and fatigue failure behavior of nickel based alloy blades: after cutting, vibration finishing and shot peening. Eng. Fail. Anal. 2025, 167, 109034.
5. Ma, Y.; Liu, M.; Zhang, Y.; Wang, X.; Wang, Y. SPDP-Net: a semantic prior guided defect perception network for automated aero-engine blades surface visual inspection. IEEE. Trans. Automat. Sci. Eng. 2025, 22, 2724-33.
6. Shang, H.; Sun, C.; Liu, J.; Chen, X.; Yan, R. Defect-aware transformer network for intelligent visual surface defect detection. Adv. Eng. Inform. 2023, 55, 101882.
7. Wang, W. Y.; Zhang, S.; Li, G.; et al. Artificial intelligence enabled smart design and manufacturing of advanced materials: the endless Frontier in AI+ era. Mater. Genome. Eng. Adv. 2024, 2, e56.
8. Wang, W. Y.; Li, G.; Liu, Z.; et al. Materials genome engineering and intelligent science: the endless frontier in AI+ era. Sci. Technol. Rev. 2025, 43, 93-109.
9. Huang, K.; Zeng, Y.; Zhao, J.; et al. Weakly supervised complex texture defect detection based on nested U-Net architecture. J. Nondestruct. Eval. 2025, 44, 24.
10. Abdulrahman, Y.; Eltoum, M. A. M.; Ayyad, A.; Moyo, B.; Zweiri, Y. Aero-engine blade defect detection: a systematic review of deep learning models. IEEE. Access. 2023, 11, 53048-61.
11. Hu, S.; Ma, X.; Zhang, Y.; Xu, W. Application of self-supervised learning in steel surface defect detection. J. Mater. Inf. 2025, 5, 44.
12. Wu, Z.; Wu, S.; Kruzic, J. J.; et al. Critical damage events of 3D printed AlSi10Mg alloy via in situ synchrotron X-ray tomography. Acta. Mater. 2025, 282, 120464.
13. Li, D.; Li, Y.; Xie, Q.; Wu, Y.; Yu, Z.; Wang, J. Tiny defect detection in high-resolution aero-engine blade images via a coarse-to-fine framework. IEEE. Trans. Instrum. Meas. 2021, 70, 1-12.
14. Li, X.; Wang, C.; Ju, H.; Li, Z. Surface defect detection model for aero-engine components based on improved YOLOv5. Appl. Sci. 2022, 12, 7235.
15. Song, K.; Sun, X.; Ma, S.; Yan, Y. Surface defect detection of aeroengine blades based on cross-layer semantic guidance. IEEE. Trans. Instrum. Meas. 2023, 72, 1-11.
16. Shang, H.; Yang, Q.; Sun, C.; Chen, X.; Yan, R. Superpixel perception graph neural network for intelligent defect detection of aero-engine blade. J. Manuf. Syst. 2024, 77, 112-26.
17. Sun, X.; Song, K.; Wen, X.; Wang, Y.; Yan, Y. SDD-DETR: surface defect detection for no-service aero-engine blades with detection transformer. IEEE. Trans. Automat. Sci. Eng. 2025, 22, 6984-97.
18. Zong, Y.; Liang, J.; Wang, H.; et al. An intelligent and automated 3D surface defect detection system for quantitative 3D estimation and feature classification of material surface defects. Opt. Lasers. Eng. 2021, 144, 106633.
19. Aggour, K. S.; Gupta, V. K.; Ruscitto, D.; et al. Artificial intelligence/machine learning in manufacturing and inspection: a GE perspective. MRS. Bull. 2019, 44, 545-58.
20. Zhang, S.; Wang, W. Y.; Wang, X.; et al. Large language models enabled intelligent microstructure optimization and defects classification of welded titanium alloys. J. Mater. Inf. 2024, 4, 34.
21. Wang, Y.; Peng, T.; Wang, W.; Luo, M. High-efficient view planning for surface inspection based on parallel deep reinforcement learning. Adv. Eng. Inform. 2023, 55, 101849.
22. Du, Z.; Gao, L.; Li, X. A new contrastive GAN with data augmentation for surface defect recognition under limited data. IEEE. Trans. Instrum. Meas. 2023, 72, 1-13.
23. Liu, L.; Cao, D.; Wu, Y.; Wei, T. Defective samples simulation through adversarial training for automatic surface inspection. Neurocomputing 2019, 360, 230-45.
24. Ren, W.; Song, K.; Chen, C.; et al. DD-Aug: a knowledge-to-image synthetic data augmentation pipeline for industrial defect detection. IEEE. Trans. Ind. Inf. 2025, 21, 2284-93.
25. He, R.; Sun, S.; Yu, X.; et al. Is synthetic data from generative models ready for image recognition? arXiv 2023, arXiv:2210.07574. Available online: https://doi.org/10.48550/arXiv.2210.07574. (accessed 4 Mar 2026).
26. Singh, A. R.; Bashford-Rogers, T.; Hazra, S.; Debattista, K. Generating synthetic training images to detect split defects in stamped components. IEEE. Trans. Ind. Inf. 2024, 20, 4816-27.
27. Bosnar, L.; Hagen, H.; Gospodnetic, P. Procedural defect modeling for virtual surface inspection environments. IEEE. Comput. Graph. Appl. 2023, 43, 13-22.
28. Manyar, O. M.; Cheng, J.; Levine, R.; Krishnan, V.; Barbič, J.; Gupta, S. K. Physics informed synthetic image generation for deep learning-based detection of wrinkles and folds. J. Comput. Inform. Sci. Eng. 2023, 23, 030903.
29. Abou Akar, C.; Tekli, J.; Khalil, J.; et al. SORDI.ai: large-scale synthetic object recognition dataset generation for industries. Multimed. Tools. Appl. 2024, 84, 18263-304.
30. Gutierrez, P.; Luschkova, M.; Cordier, A.; Shukor, M.; Schappert, M.; Dahmen, T. Synthetic training data generation for deep learning based quality inspection. arXiv 2021, arXiv:2104.02980. Available online: https://doi.org/10.48550/arXiv.2104.02980. (accessed 4 Mar 2026).
31. Fulir, J.; Bosnar, L.; Hagen, H.; Gospodnetić, P. Synthetic data for defect segmentation on complex metal surfaces. In 2023 IEEE/CVF Conference on Computer Vision and Pattern Recognition Workshops (CVPRW), Vancouver, Canada, June 17-24, 2023. IEEE; 2023. pp. 4424-34.
32. Schraml, D.; Notni, G. Synthetic training data in AI-driven quality inspection: the significance of camera, lighting, and noise parameters. Sensors 2024, 24, 649.
33. Bosch, C.; Pueyo, X.; Mérillou, S.; Ghazanfarpour, D. A physically-based model for rendering realistic scratches. Comput. Graph. Forum. 2004, 23, 361-70.
34. He, L.; Gao, F.; Hou, W.; Hao, L. Objective image quality assessment: a survey. Int. J. Comput. Math. 2013, 91, 2374-88.
35. Xie, E.; Wang, W.; Yu, Z.; Anandkumar, A.; Alvarez, J. M.; Luo, P. SegFormer: simple and efficient design for semantic segmentation with transformers. arXiv 2021, arXiv:2105.15203. Available online: https://doi.org/10.48550/arXiv.2105.15203. (accessed 4 Mar 2026).
36. Weng, W.; Zhu, X. INet: convolutional networks for biomedical image segmentation. IEEE. Access. 2021, 9, 16591-603.
37. Chen, L. C.; Zhu, Y.; Papandreou, G.; Schroff, F.; Adam, H. Encoder-decoder with atrous separable convolution for semantic image segmentation. In: Ferrari V, Hebert M, Sminchisescu C, Weiss Y, Editors. Computer Vision - ECCV 2018. Cham: Springer International Publishing; 2018. pp. 833-51.
38. Badrinarayanan, V.; Kendall, A.; Cipolla, R. SegNet: a deep convolutional encoder-decoder architecture for image segmentation. IEEE. Trans. Pattern. Anal. Mach. Intell. 2017, 39, 2481-95.
39. Mirza, M.; Osindero, S. Conditional generative adversarial nets. arXiv 2014, arXiv:1411.1784. Available online: https://doi.org/10.48550/arXiv.1411.1784. (accessed 4 Mar 2026).
Cite This Article
How to Cite
Download Citation
Export Citation File:
Type of Import
Tips on Downloading Citation
Citation Manager File Format
Type of Import
Direct Import: When the Direct Import option is selected (the default state), a dialogue box will give you the option to Save or Open the downloaded citation data. Choosing Open will either launch your citation manager or give you a choice of applications with which to use the metadata. The Save option saves the file locally for later use.
Indirect Import: When the Indirect Import option is selected, the metadata is displayed and may be copied and pasted as needed.
About This Article
Special Topic
Copyright

Data & Comments
Data
0


Comments
Comments must be written in English. Spam, offensive content, impersonation, and private information will not be permitted. If any comment is reported and identified as inappropriate content by OAE staff, the comment will be removed without notice. If you have any queries or need any help, please contact us at [email protected].