

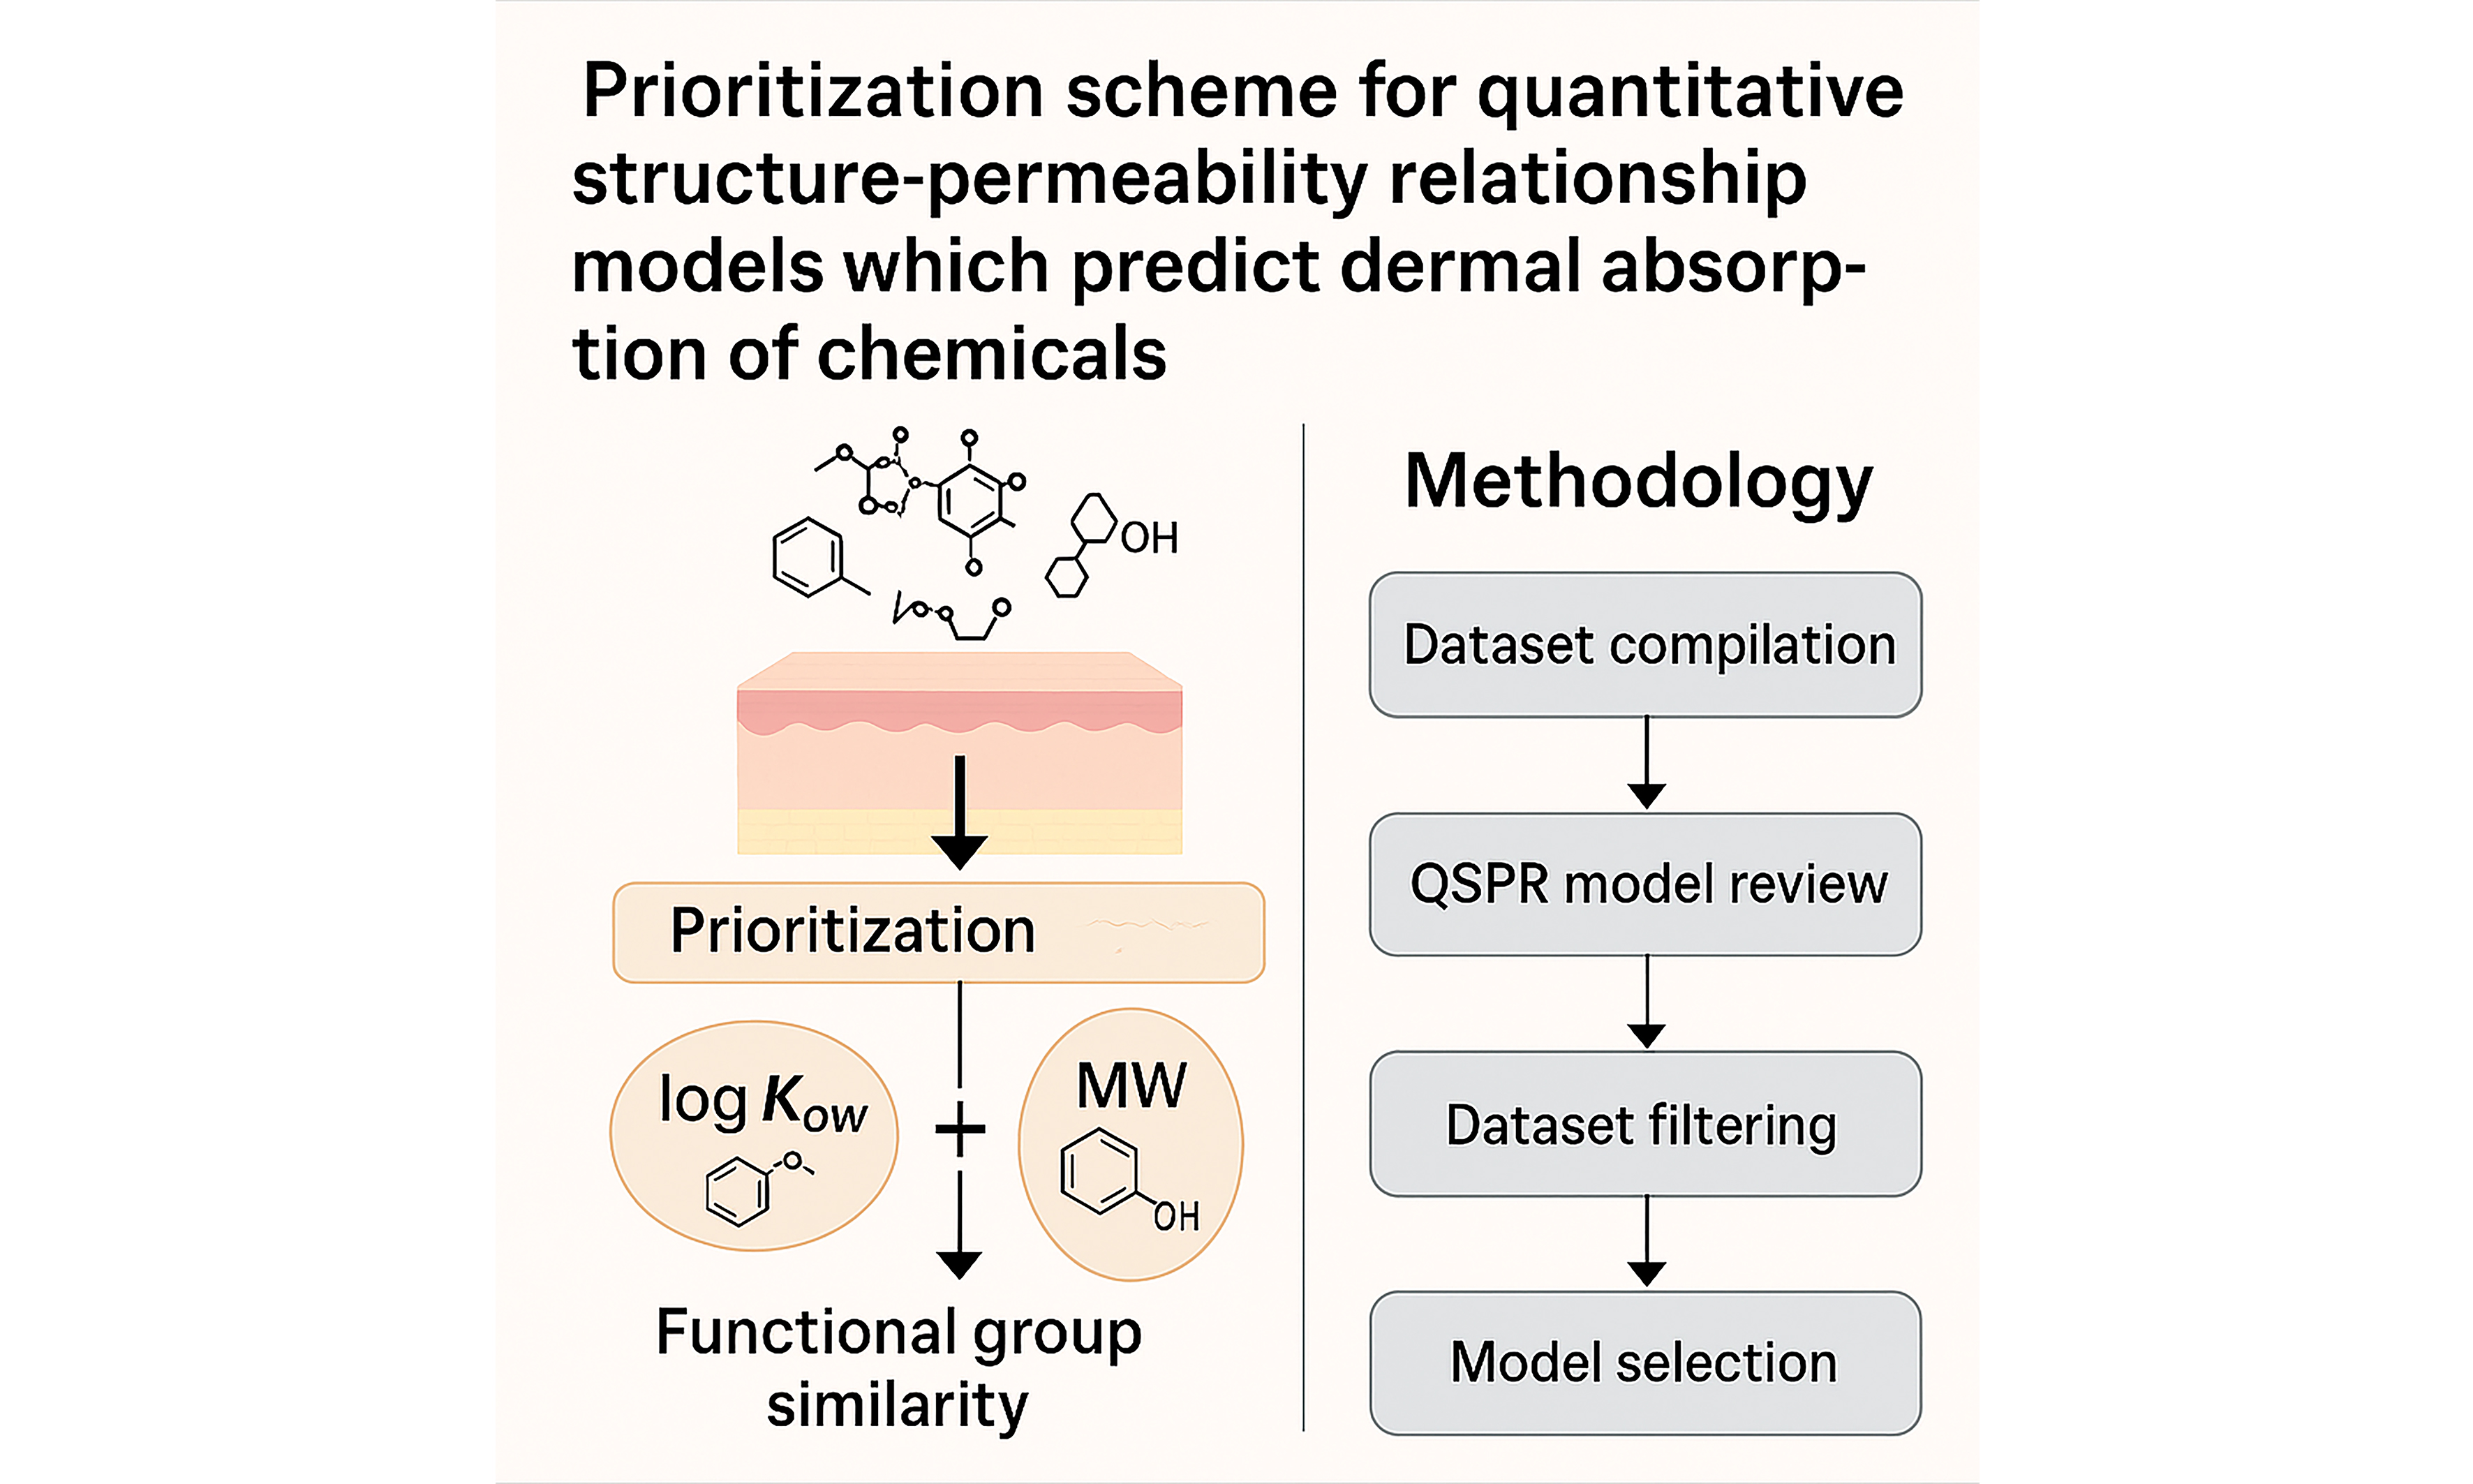
Prioritization scheme for quantitative structure-permeability relationship models to predict dermal absorption of chemicals
 0
0 Abstract
Permeability coefficient (kp) is routinely used to quantify the movement of chemicals across the skin. Log octanol-water partition coefficient (log Kow) and molecular weight (MW) are often incorporated into skin permeation models to generate the kp. Given that the same dataset is used to estimate skin permeation, novel approaches are required to achieve targeted and accurate results. The main goal of this study is to identify a prioritization scheme for quantitative structure-permeability relationships (QSPRs) when using two molecular descriptors, log Kow and MW. A second goal is to determine whether classification based on functional groups and structural similarities enhances the existing QSPR models. Ten QSPR models using log Kow and MW were reviewed to identify the predictive ability of kp using a comprehensive dataset. The dataset was filtered to identify molecules with structural and functional group similarities, and the resulting subset was subjected to the QSPRs used in the preceding analysis to demonstrate improvements in predictive performance. By comparing the kp predictions of the QSPRs to measured kp values, we were able to devise a systematic approach to improve the predictive ability of QSPRs. Using the proposed hierarchical approach, researchers can select an appropriate QSPR model to accurately predict the dermal kp of a given chemical compound. Such predictions can be a viable alternative to experimentation, which can be resource-intensive.
Keywords
INTRODUCTION
Measuring dermal absorption of chemicals is crucial in exposure science, toxicology, and chemical risk management. The amount of chemicals that can permeate the skin, the rate of their diffusion across the dermal barrier, and their distribution within the skin are important factors in dermal risk assessment. The skin is an effective but partial barrier to the movement of molecules across its various layers. As molecules encounter the skin, they must first pass through the stratum corneum (SC) before accessing systemic circulation. The SC is important because it acts as a barrier that protects the skin from the external environment. This protective property can be attributed to a combination of favorable molecule physicochemical properties that impede molecular mobility, thereby creating a tortuous route for molecular diffusion. Lipophilic molecules have suitable physicochemical attributes that favor their movement across the SC. As molecules move through various dermal layers, they encounter both hydrophilic and lipophilic regions. Therefore, functionally, molecules with both hydrophilic and lipophilic properties can navigate these layers more easily. Thus, the local and systemic bioavailability of molecules, along with dermal sensitization upon exposure, depends on their absorption and diffusion across the skin layers, which is a cornerstone of dermal risk assessment.
Various approaches can be used to measure dermal absorption, including in vivo human and animal studies, in vitro studies with human and animal skin, in vitro studies with artificial skin, in silico models, and mathematical skin models. In silico models can be rudimentary, using simple rules of thumb, or quite complex, accounting for different toxicokinetic stages - namely, absorption, distribution, metabolism, and excretion. One such approach is called quantitative structure-permeability relationships (QSPRs), which translates to quantitative predictions of molecular movement across biological layers based on one or more measures of the molecule’s physicochemical or structural properties[1,2,3].
In QSPRs, octanol-water partition coefficients (Kow) are often used in lieu of skin-water partition coefficients. By using a dataset of 94 chemicals, Flynn (1990)[4] developed correlations between the logarithms of Kow and permeability coefficient (kp). Scientists combined these data with other in vitro data[5], experimental data consisting of Kow and molecular weight (MW), and theoretical parameters based on molecular structures[2,6] to derive structure-permeability relationships for kp. Various molecular descriptors can be used to construct QSPRs with water solubility or solubility in organic solvents, expressed as Log octanol-water partition coefficient (log Kow), and molecular size, given as MW, or volume, which is the most prevalent[2]. In other models[1,2,7,8,9], molecular descriptors such as electron affinities, electrical charges, partial charges, and hydrogen bonds are used as independent variables in QSPRs. Regardless of the historical context associated with the development of dermal QSPRs or the multitude of molecular descriptors that can be used to construct a QSPR, a key first step in conducting a dermal risk assessment is establishing a reliable quantitative measure of dermal absorption for the molecule of interest. To optimize existing QSPRs - reducing the need for exhaustive experimentation, enabling faster compound screening, and increasing applicability to novel chemicals - this study focuses on two main goals.
The first is to identify a prioritization scheme for QSPRs constructed from two molecular descriptors: log Kow and MW. The dataset used to develop this prioritization scheme contains 476 entries representing 145 compounds. The scheme is constructed using a standard percent error banding approach coupled with the analyses of the coefficient of determination (r2) and root mean square error (RMSE) to assess experimental and predicted skin permeation coefficients. The second goal is to identify whether this classification based on functional groups and structural similarities enhances the existing QSPR models in the context of predicting dermal absorption.
EXPERIMENTAL
We used a starting dataset by Cheruvu et al. (2022), which consisted of 476 entries representing 145 pharmaceuticals, industrial chemicals, and toxic compounds, each tested on in vitro human epidermal membranes in the form of aqueous solutions applied at infinite doses (i.e., with constant solute concentrations)[10,11]. These entries contain an additional 389 data points covering 116 unique solutes, in addition to Magnusson et al.’s (2004) original dataset[12]. The primary variable included in this database is epidermal kp, widely recognized as a critical indicator of skin permeation in numerous investigations[2,6,13]. Additionally, the dataset includes values for maximal steady-state flux (Jss), a less frequently reported metric, either directly stated or inferred by normalizing flux (Jss), measurements with respect to solute concentration[10,14-17]. Although the initial dataset was a valuable resource, its reported parameters exhibited considerable heterogeneity, potentially obscuring significant trends in skin permeability analysis. To enhance consistency, water was excluded from the dataset, resulting in a refined collection of 445 data entries covering 144 distinct chemical substances. This refined version is used as the raw dataset in our analyses.
The compounds comprising the dataset exhibit a broad spectrum of physicochemical characteristics and skin permeation metrics. Their MWs range from 32 to 504 g/mol, while lipophilicity, represented by the logarithm of the Kow (log P or log Kow), is between -4.7 and 7.7. Melting points (MP) range from 147 to
By using this dataset, we will initially conduct a screening analysis to identify the relationships between experimental log kp and MW, Kow, log octanol solubility, log aqueous solubility, molar volume, and MP. Experimentally determined permeation coefficients will then be compared to those predicted using QSPRs by calculating percentage differences. These differences can be positive or negative, as determined by
Predicted permeation coefficients will be generated using the equations in Table 1[1,2,18-25].
List of selected QSPRs for aqueous solutions
| Equation | Reference |
| log kp = 0.5356 × log Kow - 0.005227 × MW - 2.56 | Fujiwara et al. (2003)[18] |
| log kp = 0.7 × log Kow - 0.0722 × MW⅔ - 1.6918 | Mitragotri (2002)[22] |
| log kp = 0.766 × log Kow - 0.010 × MW - 2.281 | Moody and MacPherson (2003)[19] |
| log kp = 0.74 × log Kow - 0.0091 × MW - 2.39 | Moss and Cronin (2002)[2] |
| log kp = 0.71 × log Kow - 0.0061 × MW - 2.7 | Potts and Guy (1992)[23] |
| log kp = 0.72 × log Kow - 0.0059 × MW - 2.8 | Geinoz et al. (2004)[1] |
| kp = kpSC-intercellular + kpSC-transcellular log kpSC-intercellular = 0.7318 × log Kow - 0.006832 × MW - 2.59 log kpSC-transcellular = -1.361 × log MW - 1.367 | ten Berge (2009)[20] |
| log kp = 0.66 × log Kow - 0.0056 × MW - 2.80 | USEPA (2004)[24] |
| log kp = 0.514 × log Kow - 0.0050 × MW - 2.44 | Vecchia and Bunge (2002)[25] |
| log klip = -2.32 + 0.574 × log Kow - 0.005 × MW kp = klip ÷ [1 + {(klip x √MW) ÷ 2.6}] | Cleek and Bunge (1993)[21] |
Statistical comparisons were performed using a combination of r2 (the coefficients of determination of the log kp values) analyses and the RMSE, as expressed in
where:
· yi is the actual value of the ith observation (measured permeation coefficient)
· ŷi is the predicted value of the ith observation (permeation coefficient predicted using the model).
· N is the number of observations.
Additionally, an r2 analysis, which provides information about the goodness-of-fit for a model, was conducted to compare the predicted and experimental permeation coefficients. In regression, goodness-of-fit is a statistical measure of how well the regression line approximates the actual data. Therefore, it is important when a statistical model is used either to predict future outcomes or to test hypotheses. In theory, r2 is the proportion of variation that the model can explain. Another interpretation is that it is a measure of the dependent variable’s variation as predicted by the independent variables. In essence, r2 indicates how well the model fits the data. Another complementary measure of goodness-of-fit is RMSE, which represents the average difference between model predictions and actual values. Importantly, r2 may enhance RMSE by providing details about the model’s explanatory power, and it is useful to determine the overall goodness of fit.
In this study, RMSEs are calculated based on the data predicted using QSPRs and functional-group-specific data.
One of our objectives is to identify whether any classification schemes could improve the QSPRs. Accordingly, the data were stratified based on a molecular descriptor - straight-chained hydrocarbons - and the presence of functional groups. In this case, alcohol - defined as an -OH group attached to an sp3-hybridized carbon - was used to filter the data. Three types were considered: primary alcohols, with the -OH on a carbon attached to one other carbon; secondary alcohols, with the -OH on a carbon attached to two other carbons; and tertiary alcohols, with the -OH on a carbon attached to three other carbons.
The proposed approach was validated using six molecules from the literature with alcohol as their functional groups, namely tert-butyl alcohol (CAS No. 75-65-0), sec-butyl alcohol (CAS No. 78-92-2), isobutyl alcohol (CAS No. 78-83-1), 2-propanol (CAS No. 67-63-0), 3-Methyl-1-butanol (CAS No. 123-51-3), and 4-Methylpentan-2-ol (CAS No. 108-11-2). The chemical identifiers, MWs, Kow, and measured log kp values, of these selected alcohols are listed in Table 2[26,27].
Physicochemical attributes of test case alcohols for QSPR validation
| Molecule | CAS number | log kow | MW (g/mol) | Measured log kp (converted from kp) |
| tert-butyl alcohol | 75-65-0 | 0.35 | 74.12 | -2.92 |
| sec-butyl alcohol | 78-92-2 | 0.61 | 74.12 | -2.55 |
| isobutyl alcohol | 78-83-1 | 0.76 | 74.12 | -2.47 |
| 2-propanol | 67-63-0 | 0.05 | 60.1 | -2.60 |
| 3-methyl-1-butanol | 123-51-3 | 1.26 | 88.2 | -1.93 |
| 4-methylpentan-2-ol | 108-11-2 | 1.68 | 102.2 | -2.39 |
Data from Cheruvu et al. (2022) were filtered to identify molecular entities with similar functional groups - specifically alcohols - to determine whether classification by functional groups improved the agreement between the experimental and predicted permeation coefficients.
RESULTS AND DISCUSSION
Table 1 [1,2,13,18-25] lists the algorithms of the QSPRs that relate permeation to Kow and MW. By using the raw data from Cheruvu et al. (2022)[11], excluding water, the experimental log kp values were plotted against six parameters, namely log Kow [Figure 1A], MW [Figure 1B], log aqueous solubility (log Saq) [Figure 1C], MP [Figure 1D], log octanol solubility (log Soc) [Figure 1E], and molar volume [Figure 1F]. These raw data consisted of 445 different entries representing 144 molecular compounds. From Figure 1A, a linear relationship can be discerned from the plot of log kp vs. log Kow.
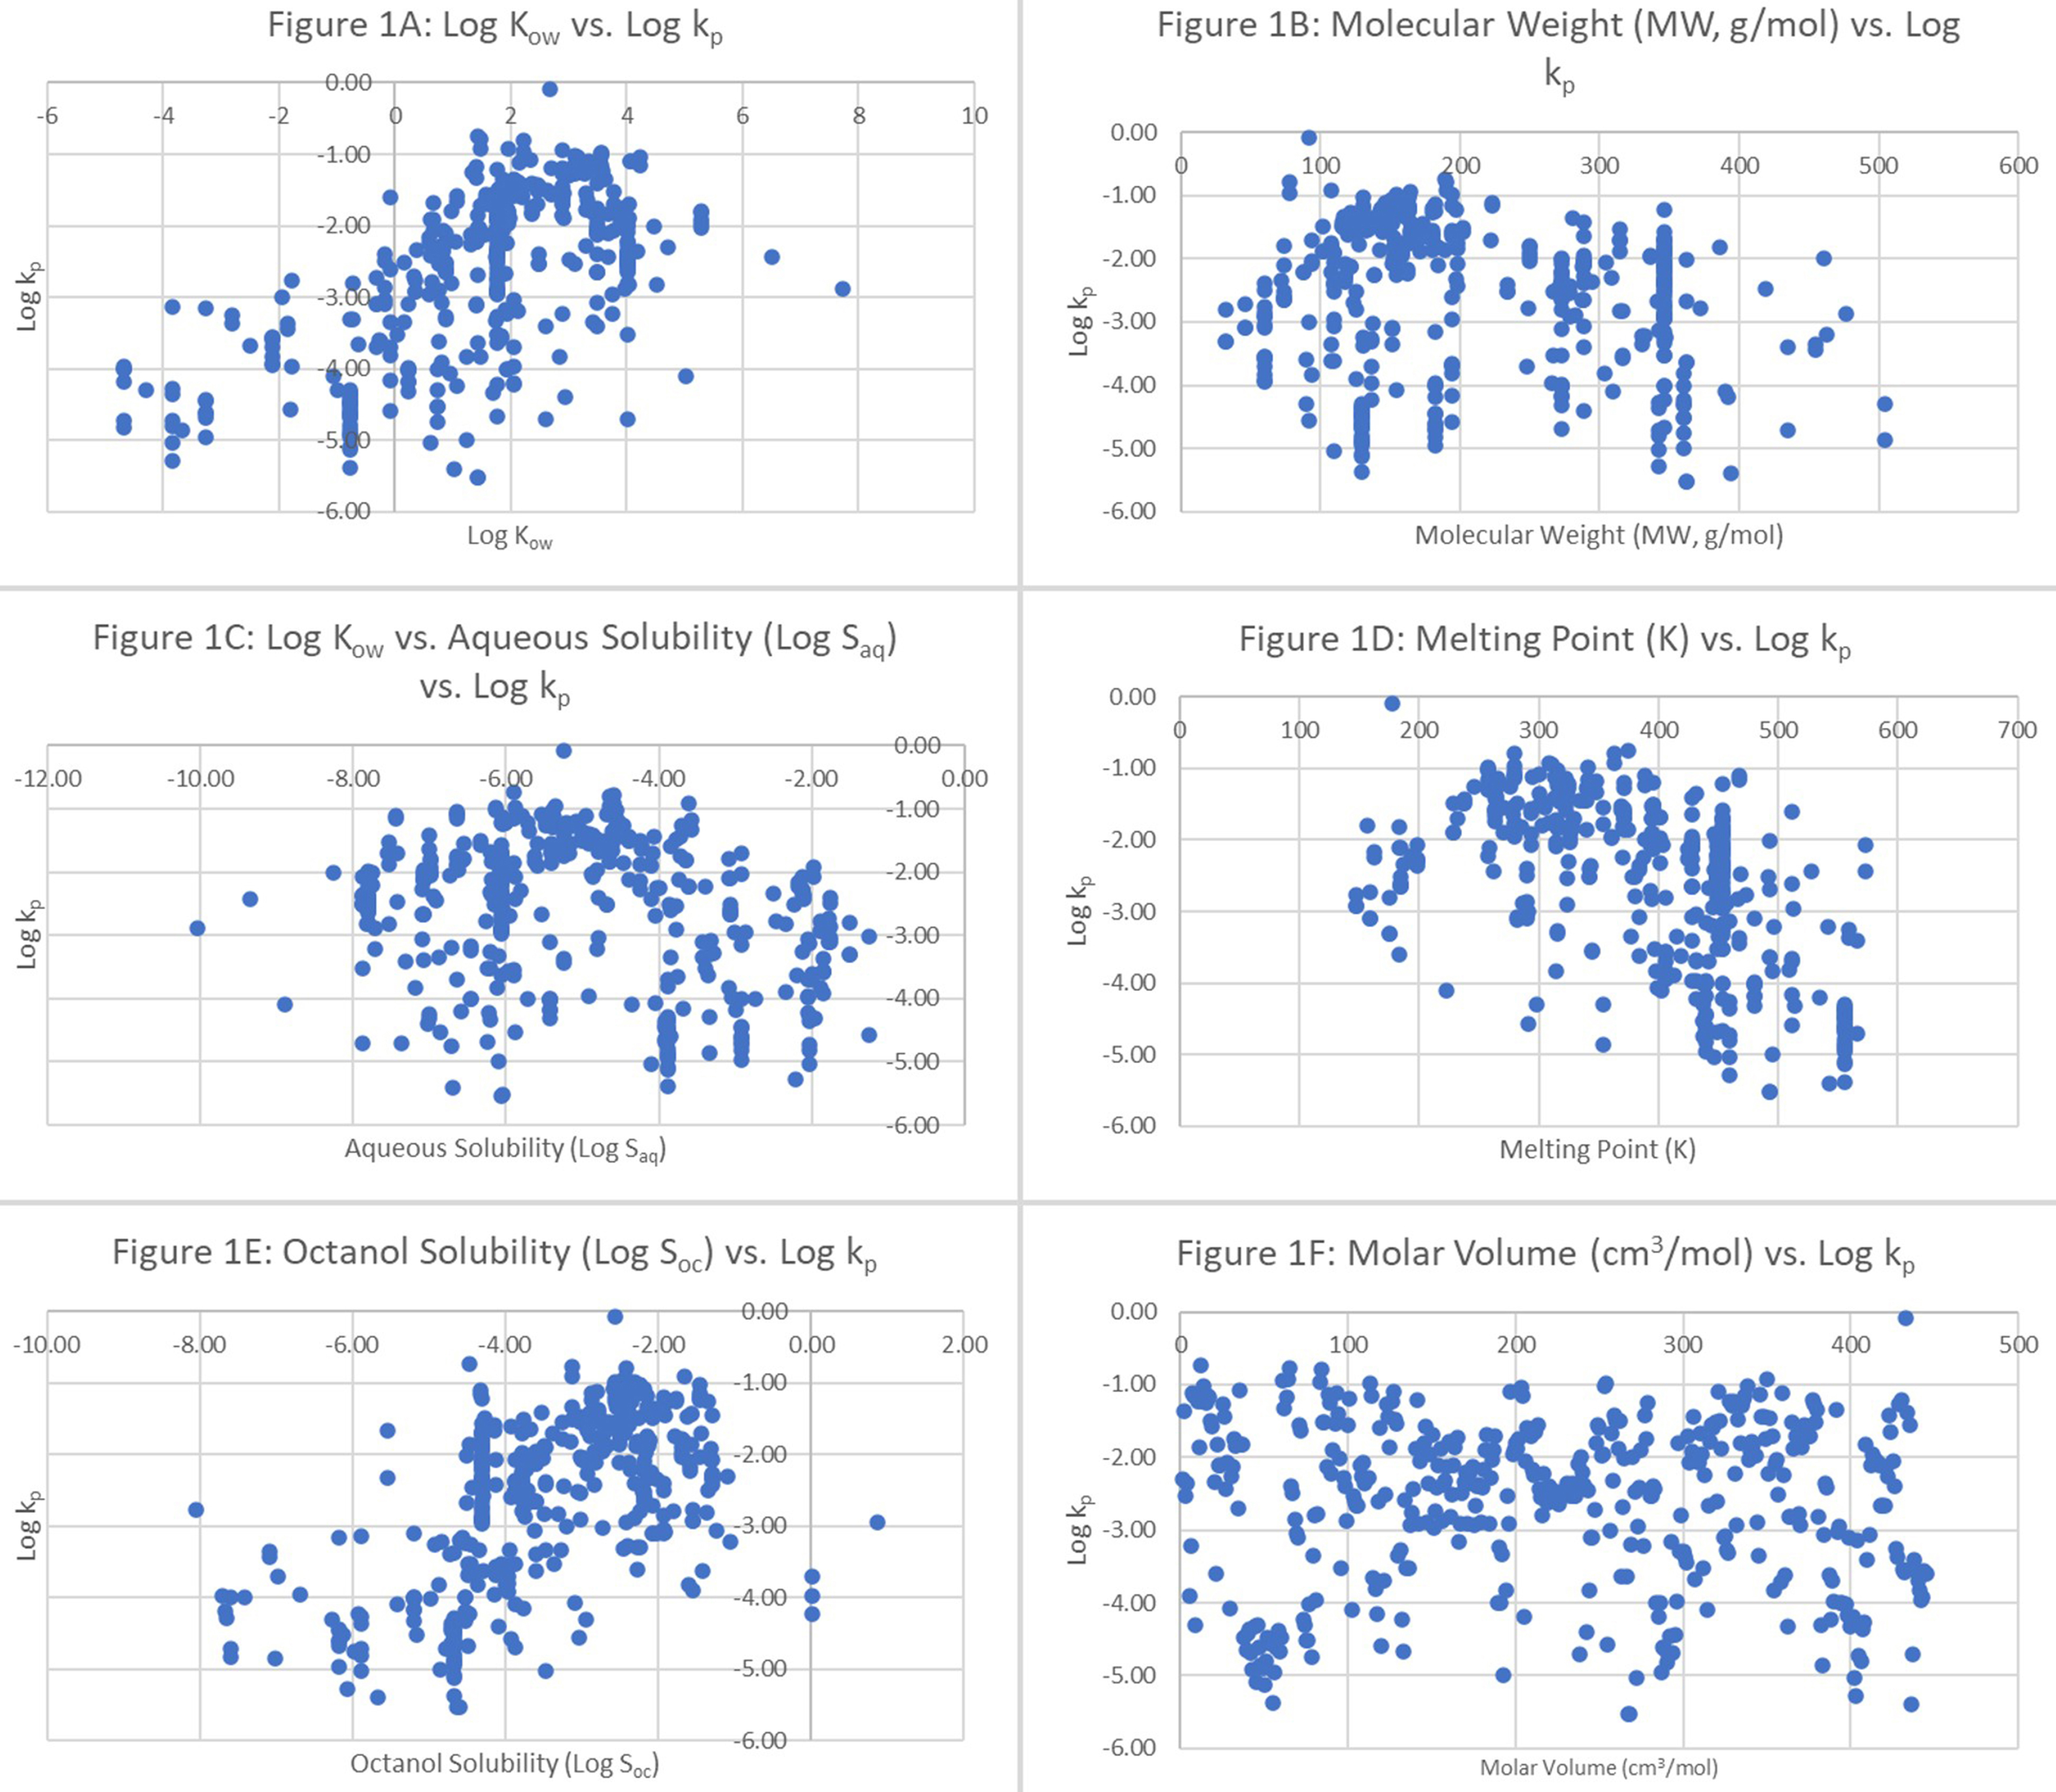
Figure 1. Log permeation coefficients (log kp) vs. (A) log Kow; (B) MW (g/mol); (C) log aqueous solubility (log Saq); (D) melting point; (E) log octanol solubility (log Soc); and (F) molar volume (cm3/mol). log Kow: Logarithm of the octanol-water partition coefficient; MW: molecular weight.
Although log octanol solubility is not typically used in the regression model to generate a QSPR, Figure 1E highlights an appreciable relationship between the permeation coefficients and the log octanol solubility data. No trends were observed when log kp was plotted against the other four parameters, namely MW,
Although log Kow and MW are often used in QSPR synthesis, another physicochemical factor, namely hydrogen bonding, characterized by a number of different molecular descriptions, might play an important role[1,2] in molecular migration across the skin. For instance, based on Figure 1E, there could exist a linear relationship between log kp and log Soc, although this relationship is not explored in this work. The importance of using additional but relevant descriptors in QSPR synthesis was evident in an analysis[28] where scientists tried to predict permeation constants using the Wilschut database[5] but could not derive an acceptable solution based on log Kow and MW alone. When the scientists included the sum of charges on atoms in the QSPR model, the results were favorable. When Chen et al. (2013)[29] evaluated two QSPRs and three mechanistic brick-and-mortar models against a dataset of hydrophilic molecules (defined as having log Kow < 0.5)[23], the QSPR models did not perform well (r2 < 0.5), but the mechanistic models performed better (highest r2 = 0.60). Thus, when an undesirable result is obtained from the QSPR during external validation or if the molecular descriptors required for the QSPR model are difficult to access, the model might not be suitable for dermal risk assessment. QSPRs are derived mainly by means of regression analysis, and more often, the associations between log kp and descriptors are not linear, as shown by Moss et al. (2011)[30]. In addition, Zhang et al. (2009)[31] observed a parabolic relationship between Jmax, defined as the steady-state flux of a substance across the skin when present at its solubility limit in the applied vehicle, and log Kow for similar-sized permeants. In summary, additional descriptors may be needed to accurately predict dermal absorption, according to Magee (1998)[32], who demonstrated that hydrogen bonding, rather than
The next analysis focused on identifying clearly advantageous QSPRs that provide enhanced predictive capabilities for skin permeation. To this end, ten QSPRs were used to estimate permeation coefficients. One objective of this analysis was to identify models that utilize a minimum number of independent variables (log Kow and MW) to predict the dependent variable (log kp). The QSPRs selected in this analysis strictly relied on log Kow and MW to predict log kp. The percentage differences were converted into histograms with bin ranges of 25% to identify data populations that would lie within these percentage difference bands. The quantitative data are represented as a cumulation of histograms in Figure 2. The binned data to the left of the red band indicate the percentage of permeation coefficient predictions that are smaller than the measured permeation coefficients. By contrast, the binned data to the right of the red band indicate the percentage of permeation coefficient predictions that exceed the measured values.
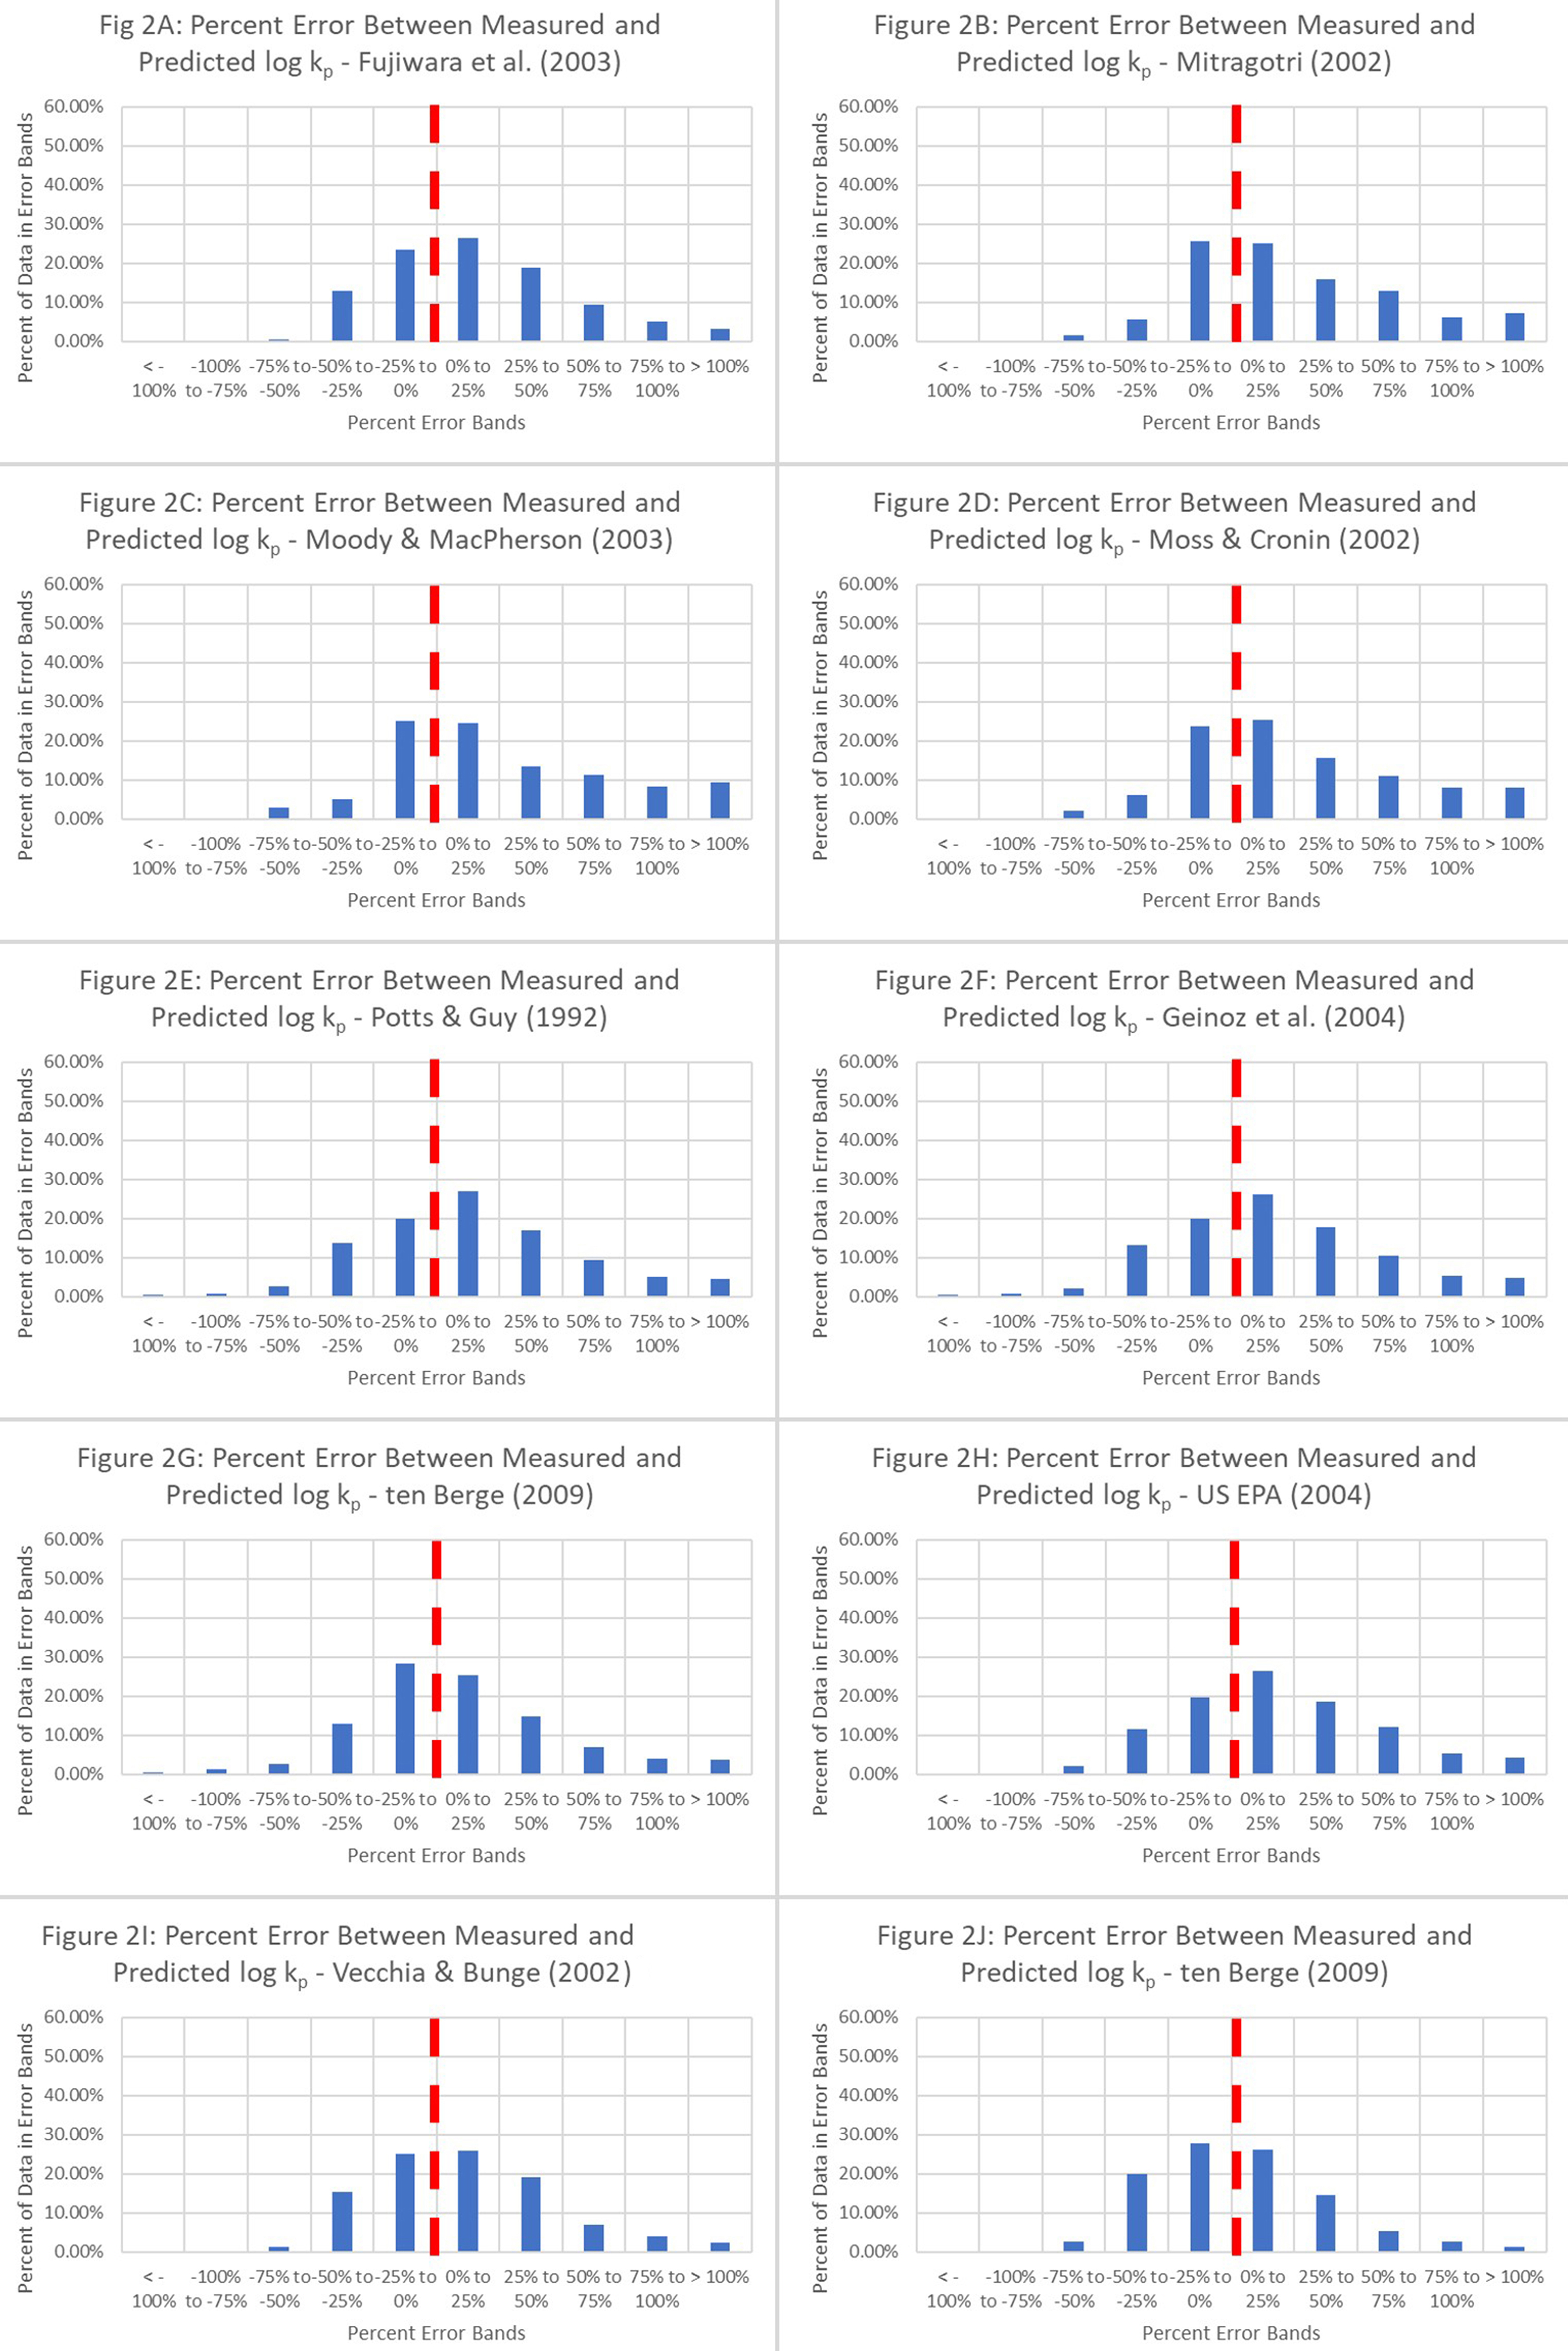
Figure 2. Percentage difference between the measured and predicted permeation coefficients based on ten unmodified QSPR equations. These equations include 1. Fujiwara et al. (2003)[18]; 2. Mitragotri (2002)[22]; 3. Moody and MacPherson (2003)[19]; 4. Moss and Cronin (2002)[2]; 5. Potts and Guy (1992)[23]; 6. Geinoz et al. (2004)[1]; 7. ten Berge (2009)[20]; 8. USEPA (2004)[24]; 9. Vecchia and Bunge (2002)[25]; and 10. Cleek and Bunge (1993)[21]. QSPR: Quantitative structure-permeation relationship.
The analysis revealed that Equations 1-6[2,13,18,19,22,23] and Equation 8[20] underperformed the least, meaning that a smaller fraction of predictions was below the accepted value. By contrast, an example of unacceptable performance was yielded by Equation 7[1] and Equations 9 and 10[24,25]. These results indicate that when modeling is used to estimate dermal penetration by molecules, the model should be more conservative or provide sufficient protection over the baseline or threshold. Overprediction by models adds an additional layer of safety for the risk management of chemicals. Another important trend that emerged from this analysis is that when Equations 1 and 8 were used, most of the overpredicted data were in the ~45% prediction band. This gives credence to the predictive ability of the model when approximately 45% of the data are overpredicted but are within 50% of the experimental or accepted value. Based on the outcome of the percentage difference analyses, poor agreement was expected between the predicted and experimental data.
The model’s goodness-of-fit was evaluated by comparing predicted and experimental permeation coefficients using r2 analysis [Figure 3]. A higher r2 value implies that the model’s predictions are consistent with the actual data. Conversely, a lower value indicates that the relationship between the model’s predictions and actual values is weak. In this case, because the dependent variable is the same throughout the analyses, a higher r2 would indicate model improvements and superior fits. Although adjusted r2 values can be used, comparison or adjusted r2 may be better suited to compare models with different predictors. The plots in Figure 3 apparently highlight a horizontal line indicating that the predicted permeation coefficients match the measured permeation coefficients. The differences between the measured and predicted permeation coefficients range from negligible to substantial, although the number of perfectly predicted values is marginal. In regression, goodness-of-fit is a statistical measure of how well the regression line approximates the actual data, and this measure is, therefore, important when a statistical model is used either to predict future outcomes or to test hypotheses. Based on the outcome of the percentage difference analyses, poor agreement was expected between the predicted and experimental data. Although the r2 value is approximately 0.45 [Figure 3], this result can often be misinterpreted because it does not measure the predictive capacity of the obtained fit.
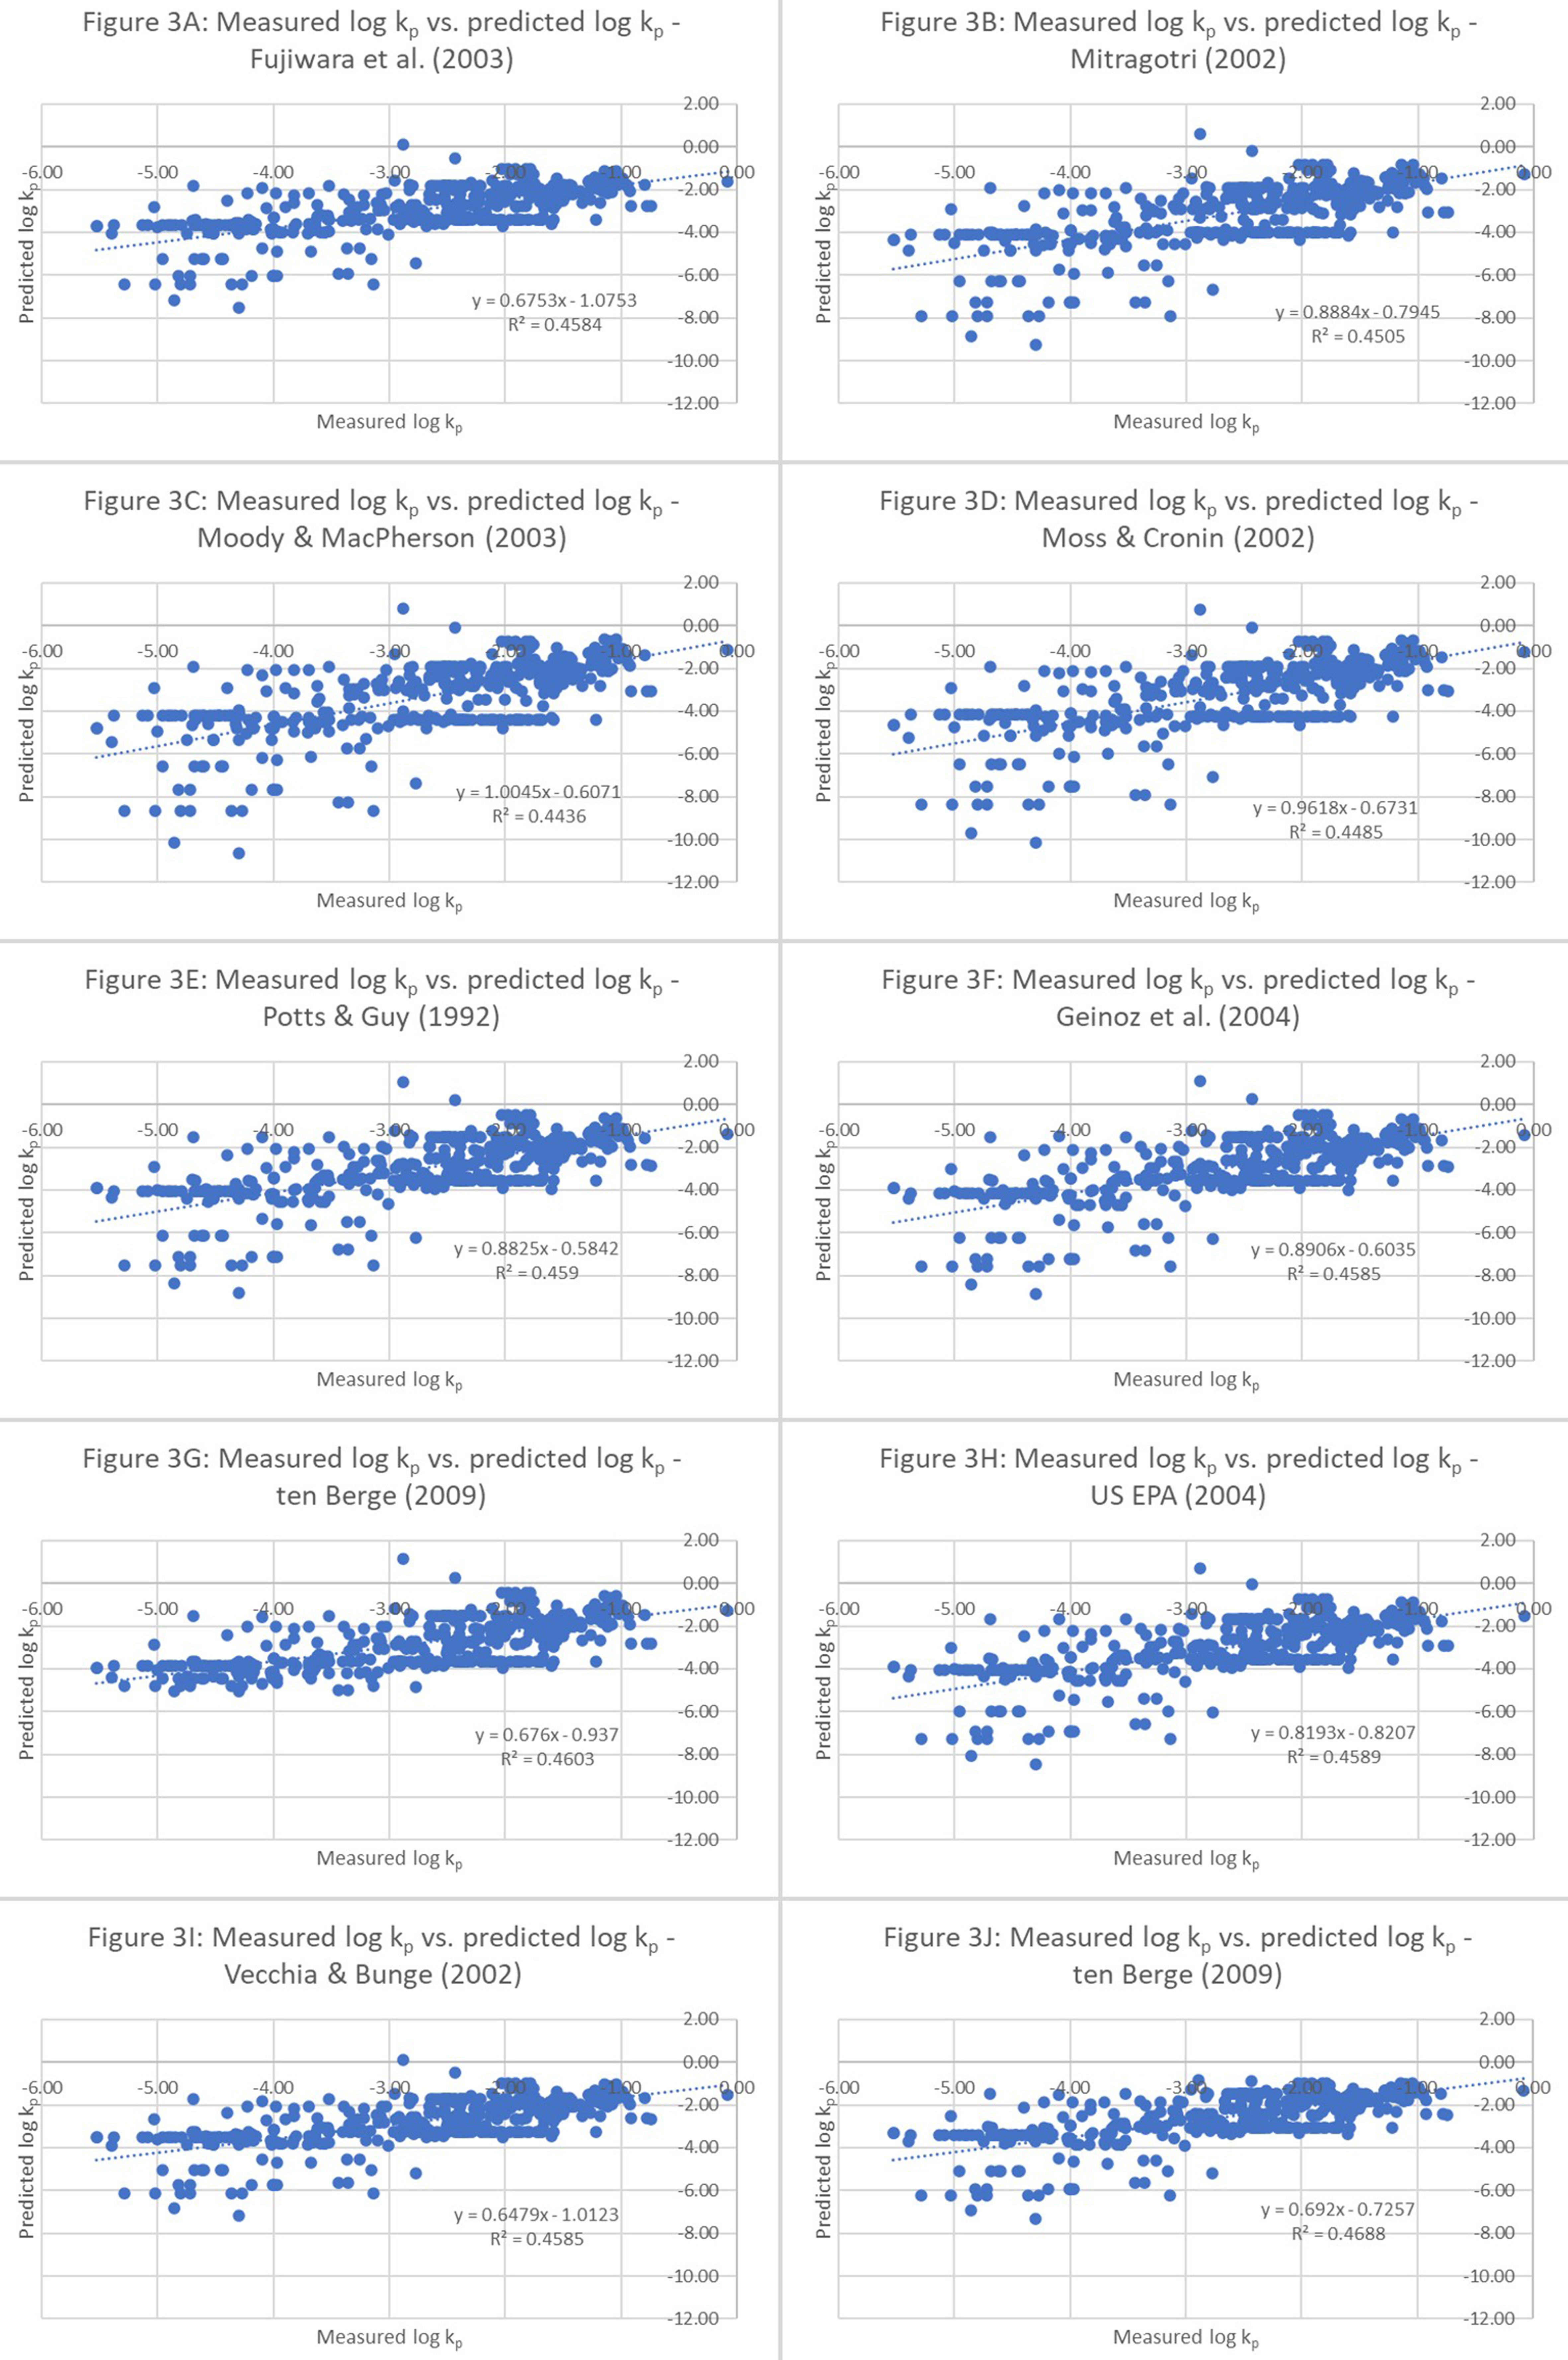
Figure 3. r2 analysis of 10 unmodified QSPRs: Goodness-of-fit analyses of measured vs. predicted permeation coefficients (log kp values). These equations include 1. Fujiwara et al. (2003)[18]; 2. Mitragotri (2002)[22]; 3. Moody and MacPherson (2003)[19]; 4. Moss and Cronin (2002)[2]; 5. Potts and Guy (1992)[23]; 6. Geinoz et al. (2004)[1]; 7. ten Berge (2009)[20]; 8. USEPA (2004)[24]; 9. Vecchia and Bunge (2002)[25]; and 10. Cleek and Bunge (1993)[21]. QSPR: Quantitative structure-permeation relationship; QSAR: quantitative structure-activity relationship.
Two hypotheses may explain the limited ability of QSPR models to achieve higher r2 values. The first hypothesis is that the underlying data used to build this model may not contain a wider range of biophysical and chemical interactions between the chemicals and biological structures and the supporting proteins in the SC. The second is that octanol might not be a good proxy for lipids in the dermal layers. Collectively, this implies that QSPRs can be improved by including additional descriptors, but this may require the use of additional or refined experimental data. The Kow and MW of the permeant molecule are among the most important physicochemical properties that influence the rate and quantity of dermal absorption[33]. Although several independent variables can be used to generate QSPRs and the dependent variable kp, screening, selecting, and using the most relevant and impactful descriptors are important steps in designing the QSPR, at least for those QSPRs that use the least squares regression methodology. Incorporating irrelevant but easily available descriptors into the model can cause overfitting and distort any mechanistic insights that would otherwise emerge from targeted and relevant descriptors.
Among the commonly reported statistical indices for regression analysis, the r2 is perhaps the most accessible and frequently cited, mainly because it is automatically included in most statistical software outputs. Despite its widespread use, r2 is often misinterpreted; it represents the proportion of variance in the dependent variable explained by the model’s predictors. This distinction is illustrated in Figures 2H and I and 3H and I. Specifically, according to Figure 3H and I, Equations 8 and 9 yield similar r2 values, suggesting that they have comparable explanatory powers. However, further assessments of these models using percent error and directional prediction trends in Figures 2H and I reveal that Equation 9 underpredicts the kp to a greater extent than Equation 8 (42% vs. 33% underprediction, respectively). This divergence indicates that while r2 is useful, it does not capture systematic biases in prediction performance. A mis-specified model might yield an artificially low residual variance, thereby inflating r2 and generating a misleading picture of model quality. This is particularly relevant when the underlying relationship is nonlinear. Even in such cases, high r2 values can coincide with widely varying residual standard deviations, and therefore, r2 alone is not a reliable measure of model adequacy. These observations caution against over-reliance on r2 in model evaluation. While it is a measure of goodness-of-fit, its interpretability hinges on whether the model appropriately reflects the underlying data-generating mechanism.
To identify whether any classification schemes could be implemented to improve the QSPRs, the data were stratified using a molecular descriptor, that is, straight-chained hydrocarbons coupled to another criterion, namely the presence of functional groups. In this case, as the functional group, alcohol was used to filter the data. Data partitioning diminished the applicability of the dataset and its model, which reduced the significance of the model and its adjustable parameters. Again, log kp was plotted against the other six parameters: Kow, log octanol solubility, log aqueous solubility, MW, molar volume, and MP. Strong linear relationships (r2 ranging from 0.7-0.8) were obtained for all the pairs, except log octanol solubility (r2 ~0.3), as illustrated in Figure 4.
Figure 4. Alcohol-based data: log permeation coefficients (log kp) vs. (A) log Kow; (B) MW (g/mol); (C) log aqueous solubility (log Saq); (D) melting point; (E) log octanol solubility (log Soc); and (F) molar volume (cm3/mol). MW: Molecular weight.
The alcohol-based stratified data are represented as a cumulation of histograms in Figure 5, with percentage differences grouped into 25% bands to highlight data populations within each range. An in-depth analysis comparing Figures 2 and 5 highlighted the gradual shift of a large data population toward the 0%-25% overprediction band.
Figure 5. Percentage differences between measured permeation coefficients and predicted permeation coefficients from ten QSPRs based on the alcohol dataset. The relevant equations are as follows: These equations include 1. Fujiwara et al. (2003)[18]; 2. Mitragotri (2002)[22]; 3. Moody and MacPherson (2003)[19]; 4. Moss and Cronin (2002)[2]; 5. Potts and Guy (1992)[23]; 6. Geinoz et al. (2004)[1]; 7. ten Berge (2009)[20]; 8. USEPA (2004)[24]; 9. Vecchia and Bunge (2002)[25]; and 10. Cleek and Bunge (1993)[21]. QSPR: Quantitative structure-permeation relationship.
This additionally supports the notion that functional-group-based optimization of QSPRs improved the model’s predictive ability, as indicated by the shift from underprediction to overprediction. Therefore, it is possible to improve the QSPRs’ predictive ability. Although the improved r2 of 0.8 was easily achievable for alcohol-based QSPRs [Figure 6], there is room for additional improvement.
Figure 6. r2 analysis of alcohol-based QSPRs: Goodness-of-fit analysis of measured vs. predicted permeation coefficients (log kp values). The equations used are as follows: 1. Fujiwara et al. (2003)[18]; 2. Mitragotri (2002)[22]; 3. Moody and MacPherson (2003)[19]; 4. Moss and Cronin (2002)[2]; 5. Potts and Guy (1992)[23]; 6. Geinoz et al. (2004)[1]; 7. ten Berge (2009)[20]; 8. USEPA (2004)[24]; 9. Vecchia and Bunge (2002)[25]; and 10. Cleek and Bunge (1993)[21]. QSPR: Quantitative structure-permeation relationship.
Based on our findings thus far, we propose the following stepwise approach to generate theoretical dermal permeation coefficients:
1. Determine the functional groups driving perme
2. Select a population of molecules that are functionally similar to the test case;
3. Use physicochemical parameters of the selected molecule population, such as log Kow and MW, to derive a QSPR via regression modeling;
4. Predict Kp using the targeted regression model;
5. Test the measured kp against the kp predicted by the QSPR.
In this analysis, two regression models were generated: one using the unmodified original data and another using the molecular data with alcohols as the functional groups. The outputs of these regression models are given in Table 3.
Linear regression models for raw data vs. alcohol-based data
| Parameter for comparison | Raw data | P-values of raw-data-based regression model | Standard error of raw-data-based regression model | t stat of raw-data-based regression model | Alcohol-based data | P-values of alcohol-data-based regression model | Standard error of alcohol-data-based regression model | t stat of alcohol-data-based regression model |
| Intercept | -2.494 | 3.724E-93 | 0.094 | -26.459 | 1.865 | 0.042 | 0.885 | 2.107 |
| MW | -0.003 | 8.699E-16 | 3.934E-04 | -8.353 | -0.091 | 6.265E-06 | 0.017 | -5.285 |
| Log Kow | 0.368 | 3.575E-58 | 0.020 | 18.757 | 2.772 | 4.256E-07 | 0.450 | 6.160 |
| Multiple R | 0.678 | 0.942 | ||||||
| R-square | 0.459 | 0.887 | ||||||
| Adjusted R-square | 0.457 | 0.881 | ||||||
| Standard error | 0.835 | 0.252 |
According to Table 3, multiple R, R-square, adjusted R-square, and standard error statistics exhibit improvement. A higher adjusted R-square indicates that a large proportion of the variance is explained by meaningful predictors. Similarly, a higher multiple R reflects improved model predictability. A side-by-side comparison of r2 values obtained using the original (unmodified) and alcohol-based QSPRs is presented in Figure 7A. Model suitability, applicability, and improvement in the model’s predictive ability were confirmed by analyzing RMSEs. A side-by-side comparison of the RMSEs of the original (unmodified) and alcohol-based QSPRs is depicted in Figure 7B.
Figure 7. Comparison of r2 and RMSEs of unmodified and alcohol-based QSPRs. RMSE: Root mean square error; QSPR: quantitative structure-property relationship.
The RMSEs were as high as 1.4 for the unmodified QSPRs, compared to ~0.3 for the alcohol-based QSPRs. This reduction indicates an improved predictive ability of the model. Furthermore, the data can guide model selection, with lower RMSEs serving as benchmarks for predictive performance. By filtering the dataset to include functionally similar molecules, the RMSEs can be substantially reduced.
To address the known limitations of relying solely on r2, we used RMSE as an additional metric for model evaluation. RMSE is computed by first calculating the residuals (i.e., the differences between observed and predicted values) for each observation and then deriving the square root of the average of these squared residuals. Conceptually, RMSE reflects the dispersion of prediction errors, indicating how close the predicted values are to the actual outcomes. Because RMSE retains the same units as the dependent variable, it allows for intuitive interpretation: a value of zero indicates perfect predictive accuracy, while higher values indicate greater deviation and reduced model precision. In the current analysis [Figure 7B], Equations 1, 7, 9, and 10 yielded lower RMSEs than other models, suggesting improved predictive performance. With the introduction of QSPR models tailored to alcohol-based solutions, the RMSEs decreased. Notably, Equations 1, 2, and 9 consistently outperformed their alcohol-based counterparts by yielding lower RMSE values. On average, QSPR model optimization through functional group-specific modifications reduced RMSEs by 60%-70% compared to their unmodified versions, indicating substantial gains in predictive accuracy. Although RMSE is widely used in regression modeling and for assessing predictive algorithms for continuous outcomes, it is important to consider its advantages and limitations. A key drawback is its sensitivity to outliers. Because RMSE involves squaring each error term, larger errors disproportionately contribute to the overall metric. This can potentially skew interpretations in the presence of extreme values. However, this sensitivity can be beneficial for identifying and understanding the effects of large deviations or anomalous predictions on model performance. By contrast, alternative measures such as the mean absolute percentage error (MAPE), which calculates the mean percentage deviation between predicted and observed values, assign equal weight to all errors, making them less responsive to outliers. Moreover, RMSE decreases with the addition of independent variables to a model, even if those variables are only incidentally correlated to the outcome. Therefore, reductions in RMSE must be interpreted carefully in the context of model parsimony and theoretical relevance, rather than as an unequivocal indicator of improved performance.
Additionally, the log kp values predicted using the unmodified QSPR and those predicted using the alcohol-based QSPR were compared to the measured log kp values. The results are presented in Figure 8.
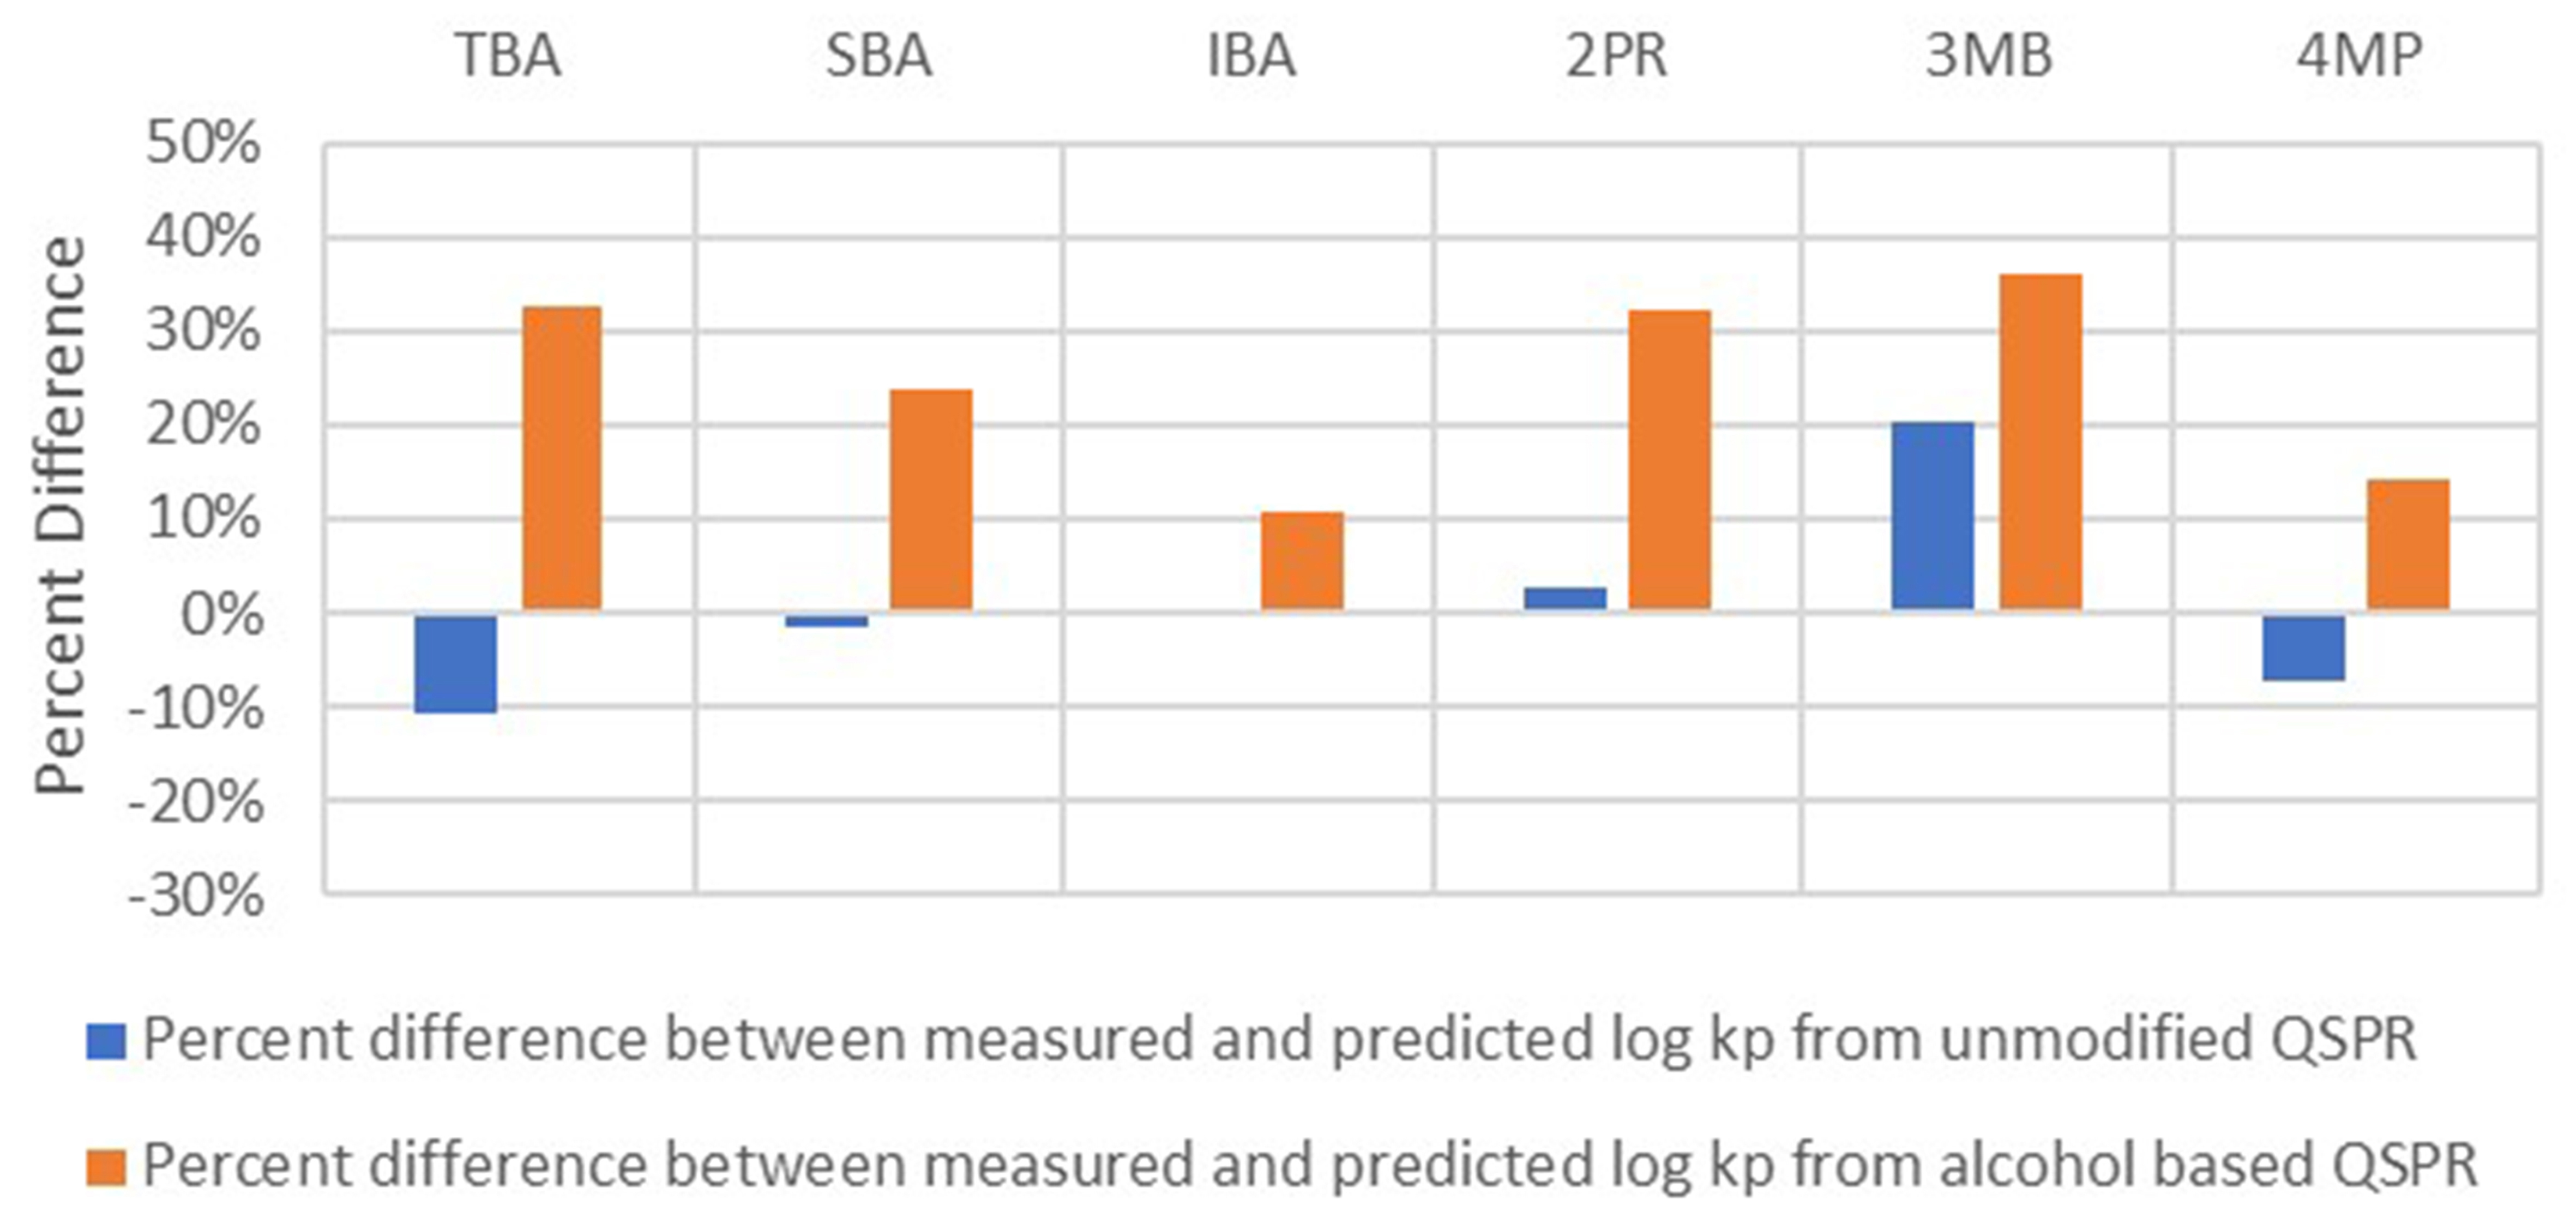
Figure 8. Comparison of log kp values predicted using unmodified (original QSPR) and alcohol-based QSPRs. The acronyms of different alcohols are as follows: TBA, SBA, IBA, 2PR, 3MB, and 4MP. QSPR: Quantitative structure-permeability relationship; TBA: tert-butyl alcohol; SBA: sec-butyl alcohol; IBA: isobutyl alcohol; 2PR: 2-propanol; 3MB: 3-methyl-1-butanol; 4MP: 4-methylpentan-2-ol.
The data in Figures 7 and 8 highlight three important aspects:
1. Generating a regression model using molecules with the same functional group improves r2. The average r2 of the regression model based on original data is 0.46, whereas the average r2 of a similar model using alcohol-based molecules is 0.81.
2. Similarly, regression models that use alcohol-based molecules exhibit improved RMSE. The average RMSE of the regression model based on the original data is 1.1, whereas the average RMSE of the alcohol-based regression model is 0.38.
3. Finally, relative to the predictions of the alcohol-based regression model, the regression model based on the original data underpredicts log kp values. Underprediction, as discussed earlier, can adversely affect the overall risk assessment and management of chemical exposure to consumer goods and in occupational settings.
Based on our results of classification by functional groups, the agreement between experimental and predicted permeation coefficients can be improved. The results of these comparisons are presented in Figure 7B, and they highlight a reduction in RMSE post classification by functional groups. Thus, the proposed methodology involves finding molecular similarities between target molecules and similar molecules for which experimental data are available. The phrase “similar” could be based on criteria such as straight-chain hydrocarbons and alcohols as functional groups. A comparison between Figures 2 and 5 indicates that the use of functional group similarities to generate QSPRs results in a shift toward the overprediction of log kp values. Such results are favorable because modeling predictions that are conservative and overpredicted rather than underpredicted are desirable. Once similar molecules with available experimental data are identified, a QSPR can be constructed, and by using theoretical data, a more robust permeation coefficient can be computed. The proposed methodology has important implications for dermal risk assessments. Underestimation of dermal absorption due to the use of underpredicted kp values would lead to underestimation of internal exposure and, consequently, of the associated risk.
Limitations
Although this study provides valuable insights into the optimization of QSPR models for dermal absorption prediction, it is subject to several limitations. First, the analysis was constrained to models that use only two molecular descriptors, log Kow and MW. Although these descriptors are commonly used and widely available, excluding other potentially influential variables such as hydrogen bonding capacity, polar surface area, and charge distribution may limit model comprehensiveness. Additionally, the functional group-based refinement focuses solely on alcohol-containing compounds. Although this approach demonstrates improved predictive accuracy, its applicability to other chemical classes is untested and warrants further investigation. The underlying dataset, despite being extensive and curated from multiple studies, introduces variability owing to differences in experimental parameters such as temperature, skin thickness, and permeation metrics. These inconsistencies may obscure the underlying structure-permeation relationships. Furthermore, the reliance on log Kow as a proxy for lipid solubility in skin may be inadequate because octanol does not fully replicate the complex lipid composition of the SC. While statistical measures such as r2 and RMSE were used to evaluate model performance, both measures have limitations: r2 can be misinterpreted as a measure of predictive strength, and RMSE is highly sensitive to outliers, which may skew assessments of model accuracy. The alcohol-based QSPRs were validated using a small set of six compounds, thereby limiting the generalizability of the results and highlighting the need for broader validation across structurally diverse molecules. Lastly, because the models were developed using in vitro data, they may not fully capture the biological complexity and variability observed in vivo, such as regional skin differences or metabolic activity, which must be considered when extrapolating to real-world exposure scenarios.
CONCLUSIONS
Skin absorption studies provide the most relevant datasets for dermal risk assessment of chemicals. The development of QSPRs, based on physicochemical properties of chemicals and diffusion kinetics, is useful because they can serve as screening tools in dermal risk assessments. However, both estimated permeation data in the form of permeation coefficients derived from QSPRs and experimental data in the form of measured skin permeation can exhibit substantial variability. By comparing the log kp predictions of QSPRs with measured log kp values, we identified approaches to improve model predictions. A hierarchical scheme to optimize QSPRs was developed, and by using this scheme, scientists can apply aptly suited regression models to improve dermal permeation predictions for select chemical compounds. The proposed approach provides a technically and financially feasible alternative to experimentation, which can be resource-intensive. In sum, existing QSPR models are valuable tools for assessing dermal penetration in chemical risk evaluations.
DECLARATIONS
Acknowledgments
The authors are grateful to the RHP staff, who contributed to manuscript preparation, review, and editing.
Authors’ contributions
Conceptualization, data collection, analysis, methodology, and manuscript writing: Jachak, A. C.
Data verification, manuscript editing, and proofreading: Heckman, B., Pagone, F.
Availability of data and materials
The raw dataset is available at: CHERUVU, HANUMANTH SRIKANTH (2022), “An updated skin permeation database of compounds applied as aqueous solutions in in vitro”, Mendeley Data, V1, DOI:10.17632/8bs7hb2wj2.1. The analysis and all pertinent supporting information can be found at https://rhprisk.box.com/s/dmtgopel091y6dz7birnqxim779x5alr (with access granted by the author per request).
Financial support and sponsorship
None.
Conflicts of interest
All authors are affiliated with RHP Risk Management, Inc.
Ethical approval and consent to participate
Not applicable.
Consent for publication
Not applicable.
Copyright
© The Author(s) 2025.
REFERENCES
1. Geinoz, S.; Guy, R. H.; Testa, B.; Carrupt, P. A. Quantitative structure-permeation relationships (QSPeRs) to predict skin permeation: a critical evaluation. Pharm. Res. 2004, 21, 83-92.
2. Moss, G. P.; Cronin, M. T. Quantitative structure-permeability relationships for percutaneous absorption: re-analysis of steroid data. Int. J. Pharm. 2002, 238, 105-9.
4. Flynn, G. L. Physicochemical determinants of skin absorption. In Principles of Route-to-Route Extrapolation for Risk Assessment; Gerrity, T. R., Henry, C. J., Eds.; Elsevier, 1990; pp 93-127. https://hero.epa.gov/reference/10627124/ (accessed 2025-11-11).
5. Wilschut, A.; ten, Berge. W. F.; Robinson, P. J.; McKone, T. E. Estimating skin permeation. The validation of five mathematical skin permeation models. Chemosphere 1995, 30, 1275-96.
6. Cronin, M. T.; Dearden, J. C.; Moss, G. P.; Murray-Dickson, G. Investigation of the mechanism of flux across human skin in vitro by quantitative structure-permeability relationships. Eur. J. Pharm. Sci. 1999, 7, 325-30.
7. Abdallah, R. M.; Hasan, H. E.; Hammad, A. Predictive modeling of skin permeability for molecules: investigating FDA-approved drug permeability with various AI algorithms. PLOS. Digit. Health. 2024, 3, e0000483.
8. Kunita, R.; Nishijima, T.; Todo, H.; Miyazawa, M. Integrating mathematical approaches (IMAS): novel methodology for predicting dermal absorption rates of chemicals under finite dose conditions. J. Toxicol. Sci. 2024, 49, 219-30.
9. Lee, P. H.; Conradi, R.; Shanmugasundaram, V. Development of an in silico model for human skin permeation based on a Franz cell skin permeability assay. Bioorg. Med. Chem. Lett. 2010, 20, 69-73.
10. Mitragotri, S.; Anissimov, Y. G.; Bunge, A. L.; et al. Mathematical models of skin permeability: an overview. Int. J. Pharm. 2011, 418, 115-29.
11. Cheruvu, H. S.; Liu, X.; Grice, J. E.; Roberts, M. S. An updated database of human maximum skin fluxes and epidermal permeability coefficients for drugs, xenobiotics, and other solutes applied as aqueous solutions. Data. Brief. 2022, 42, 108242.
12. Magnusson, B. M.; Anissimov, Y. G.; Cross, S. E.; Roberts, M. S. Molecular size as the main determinant of solute maximum flux across the skin. J. Invest. Dermatol. 2004, 122, 993-9.
13. Guy, R. H.; Potts, R. O. Structure-permeability relationships in percutaneous penetration. J. Pharm. Sci. 1992, 81, 603-4.
14. Roberts, M. S.; Cheruvu, H. S.; Mangion, S. E.; et al. Topical drug delivery: history, percutaneous absorption, and product development. Adv. Drug. Deliv. Rev. 2021, 177, 113929.
15. Juntunen, J.; Majumdar, S.; Sloan, K. B. The effect of water solubility of solutes on their flux through human skin in vitro: a prodrug database integrated into the extended Flynn database. Int. J. Pharm. 2008, 351, 92-103.
16. Thomas, J.; Majumdar, S.; Wasdo, S.; Majumdar, A.; Sloan, K. B. The effect of water solubility of solutes on their flux through human skin in vitro: an extended Flynn database fitted to the Roberts-Sloan equation. Int. J. Pharm. 2007, 339, 157-67.
17. Majumdar, S.; Thomas, J.; Wasdo, S.; Sloan, K. B. The effect of water solubility of solutes on their flux through human skin in vitro. Int. J. Pharm. 2007, 329, 25-36.
18. Fujiwara, S.; Yamashita, F.; Hashida, M. QSAR analysis of interstudy variable skin permeability based on the “latent membrane permeability” concept. J. Pharm. Sci. 2003, 92, 1939-46.
19. Moody, R. P.; MacPherson, H. Determination of dermal absorption QSAR/QSPRs by brute force regression: multiparameter model development with Molsuite 2000. J. Toxicol. Environ. Health. A. 2003, 66, 1927-42.
20. ten Berge W. A simple dermal absorption model: derivation and application. Chemosphere 2009, 75, 1440-5.
21. Cleek, R. L.; Bunge, A. L. A new method for estimating dermal absorption from chemical exposure. 1. General approach. Pharm. Res. 1993, 10, 497-506.
22. Mitragotri, S. A theoretical analysis of permeation of small hydrophobic solutes across the stratum corneum based on Scaled Particle Theory. J. Pharm. Sci. 2002, 91, 744-52.
24. USEPAA. Risk Assessment Guidance for Superfund (RAGS): Part E. https://www.epa.gov/risk/risk-assessment-guidance-superfund-rags-part-e (accessed 2025-11-11).
25. Vecchia, B. E.; Bunge, A. L. Skin absorption databases and predictive equations. In Transdermal Drug Delivery; Guy, R. H., Hadgraft, J., Eds.; CRC Press, 2002; pp 57-141.
26. Schenk, L.; Rauma, M.; Fransson, M. N.; Johanson, G. Percutaneous absorption of thirty-eight organic solvents in vitro using pig skin. PLoS. One. 2018, 13, e0205458.
27. Walker, J. D.; Rodford, R.; Patlewicz, G. Quantitative structure-activity relationships for predicting percutaneous absorption rates. Environ. Toxicol. Chem. 2003, 22, 1870-84.
28. Değím, T.; Hadgraft, J.; Ilbasmiş, S.; Ozkan, Y. Prediction of skin penetration using artificial neural network (ANN) modeling. J. Pharm. Sci. 2003, 92, 656-64.
29. Chen, L.; Han, L.; Lian, G. Recent advances in predicting skin permeability of hydrophilic solutes. Adv. Drug. Deliv. Rev. 2013, 65, 295-305.
30. Moss, G. P.; Sun, Y.; Wilkinson, S. C.; et al. The application and limitations of mathematical modelling in the prediction of permeability across mammalian skin and polydimethylsiloxane membranes. J. Pharm. Pharmacol. 2011, 63, 1411-27.
31. Zhang, Q.; Grice, J. E.; Li, P.; Jepps, O. G.; Wang, G. J.; Roberts, M. S. Skin solubility determines maximum transepidermal flux for similar size molecules. Pharm. Res. 2009, 26, 1974-85.
32. Magee, P. S. Some novel approaches to modelling transdermal penetration and reactivity with epidermal proteins. https://books.google.com/books?hl=zh-CN&lr=&id=gEgtL8EFQ9UC&oi=fnd&pg=PA137&dq=Some+novel+approaches+to+modelling+transdermal+penetration+and+reactivity+with+epidermal+proteins&ots=ehdrQSOi-Y&sig=rvGgQIPNk-E-cL_MH0RrcO_U2ag#v=onepage&q=Some%20novel%20approaches%20to%20modelling%20transdermal%20penetration%20and%20reactivity%20with%20epidermal%20proteins&f=false (accessed 2025-11-11).
Cite This Article
How to Cite
Download Citation
Export Citation File:
Type of Import
Tips on Downloading Citation
Citation Manager File Format
Type of Import
Direct Import: When the Direct Import option is selected (the default state), a dialogue box will give you the option to Save or Open the downloaded citation data. Choosing Open will either launch your citation manager or give you a choice of applications with which to use the metadata. The Save option saves the file locally for later use.
Indirect Import: When the Indirect Import option is selected, the metadata is displayed and may be copied and pasted as needed.
About This Article
Copyright

Data & Comments
Data
0


Comments
Comments must be written in English. Spam, offensive content, impersonation, and private information will not be permitted. If any comment is reported and identified as inappropriate content by OAE staff, the comment will be removed without notice. If you have any queries or need any help, please contact us at [email protected].