


Polyethylene glycol-assisted stabilization of low-silver electrically conductive adhesives for solar cell interconnection
 0
0 
Abstract
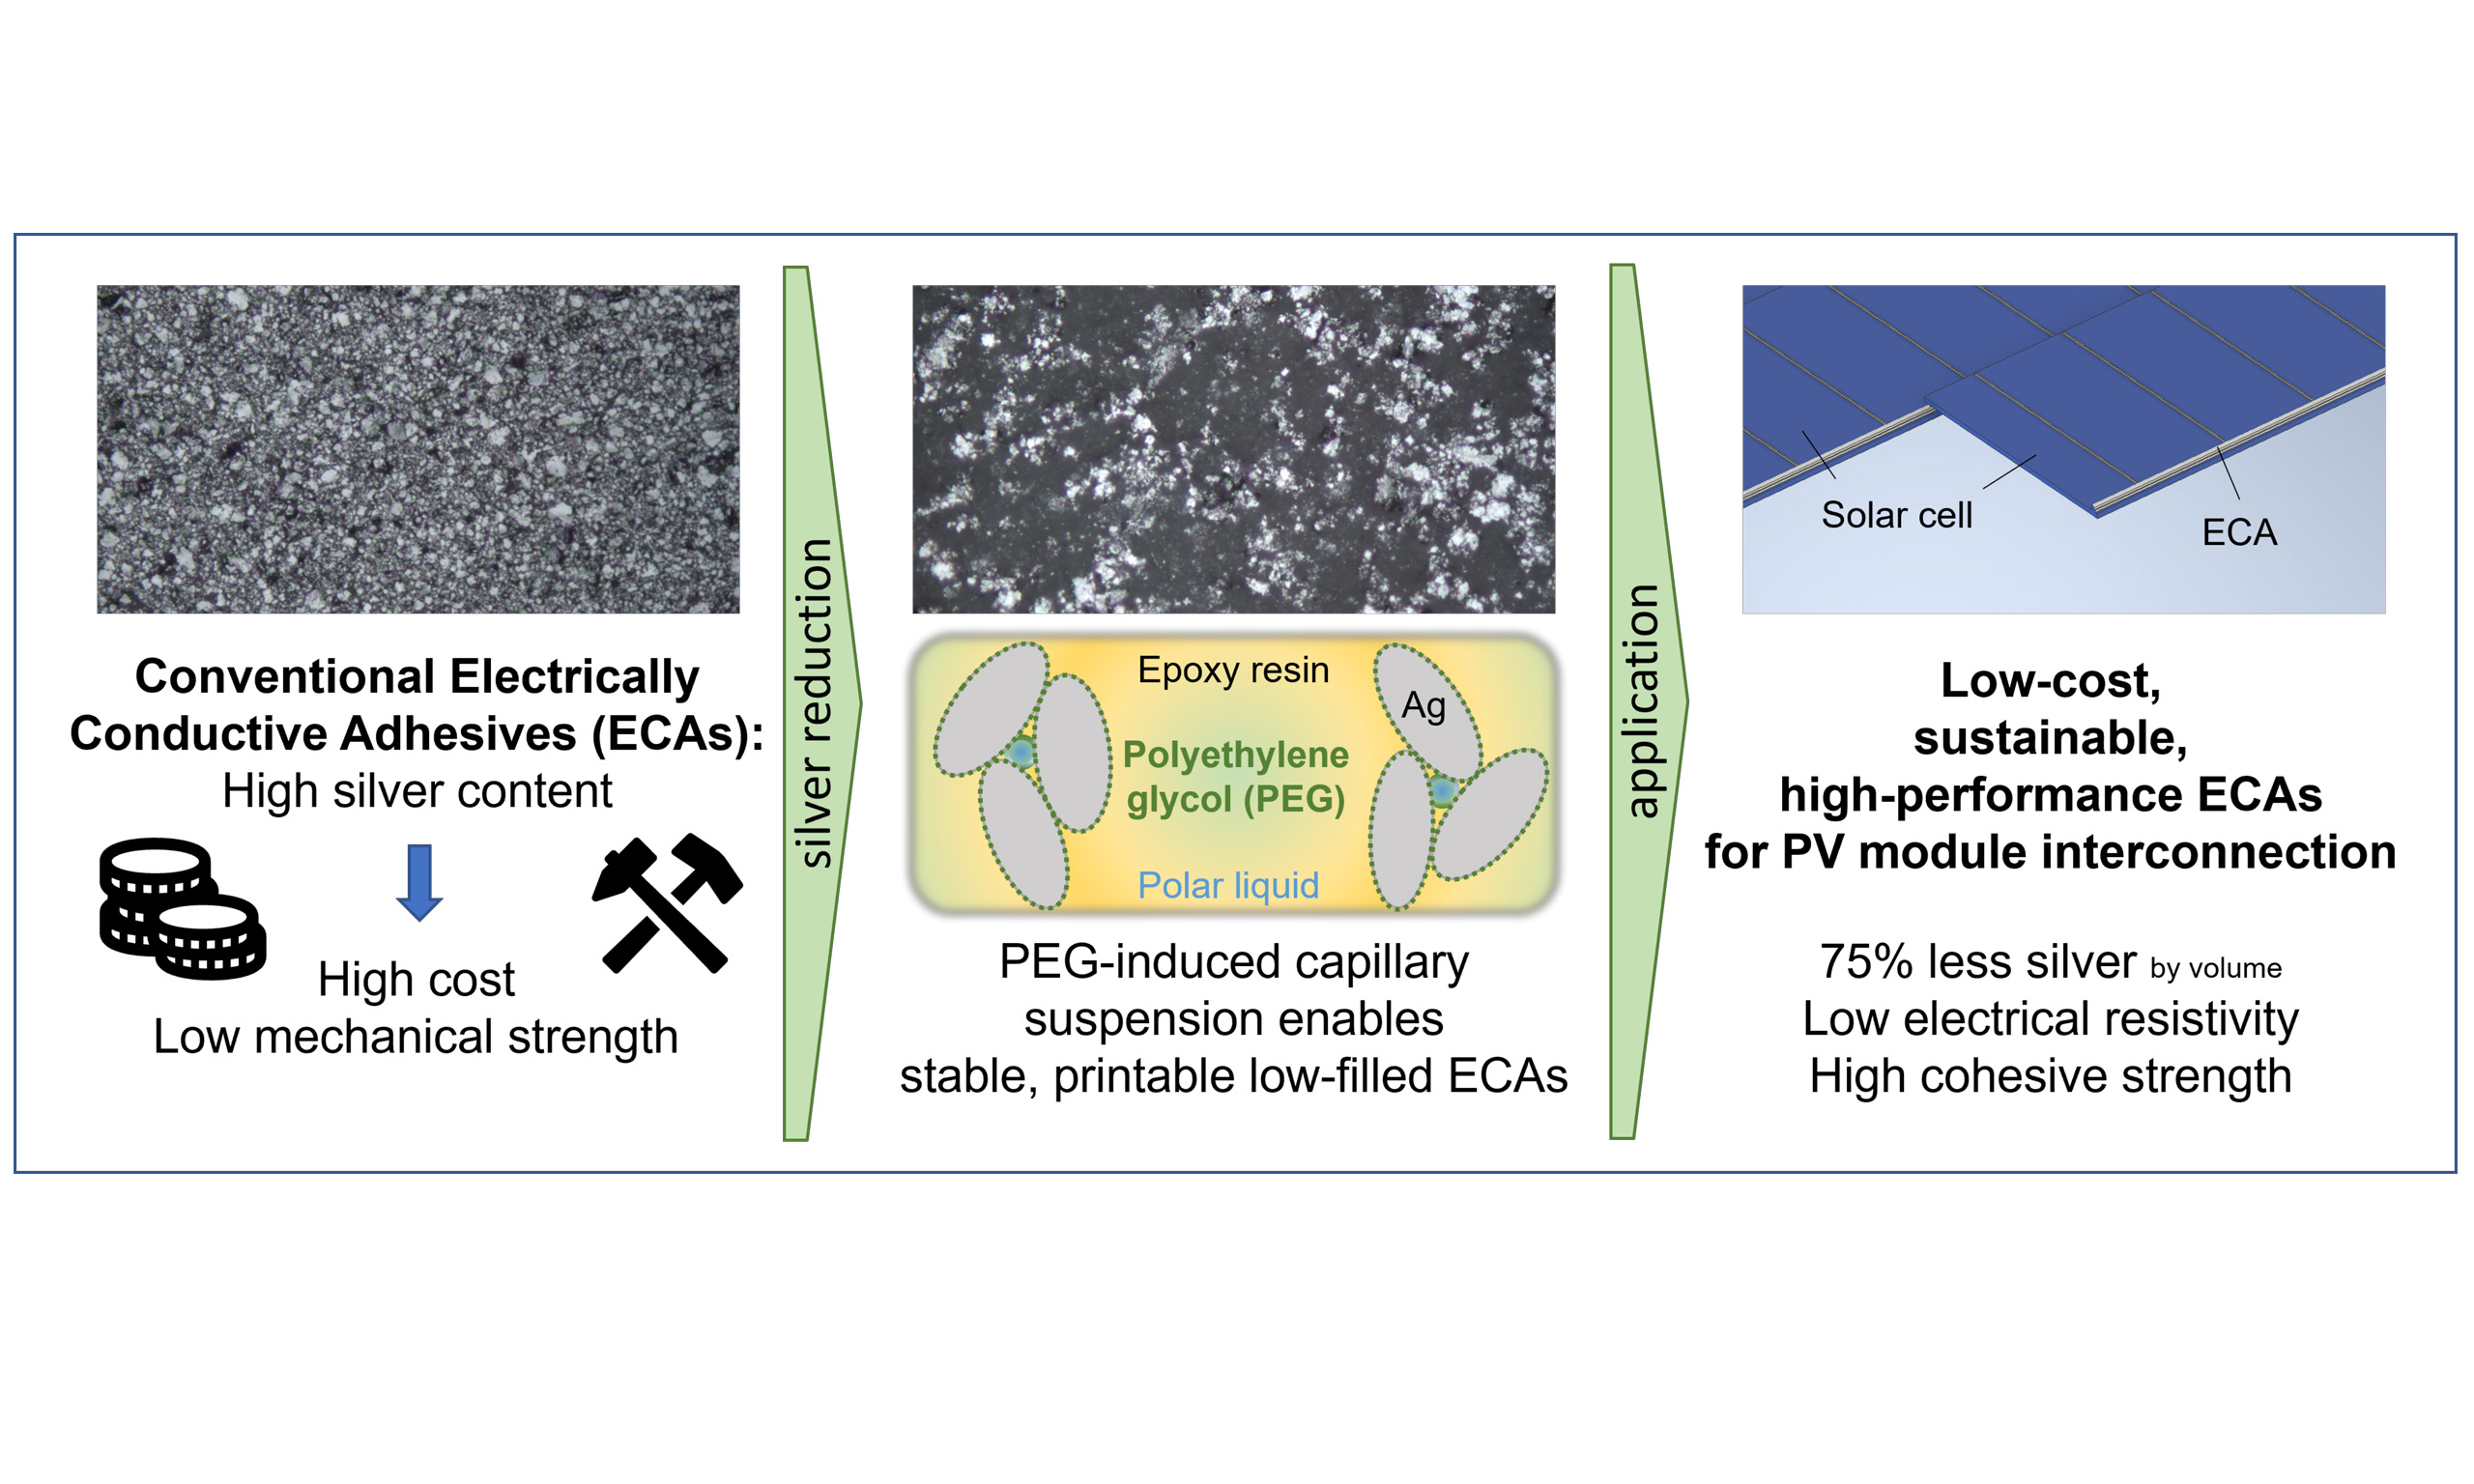
Electrically conductive adhesives (ECAs) represent a low-temperature alternative to solder in electronic and photovoltaic applications. Their electrical performance relies on a conductive filler content typically ranging from 20-30 vol% silver flakes, which ensures percolation and high conductivity but raises cost and sustainability concerns. Here, we demonstrate that an ECA comprising an epoxy resin, a non-miscible polar fluid and silver flakes used in commercial products meets the specifications for shingled solar cell interconnection in terms of volume and contact resistivity as well as mechanical strength at a silver content of only 4 vol%. Such a low-filled ECA, however, suffers from poor stability against de-mixing and its flow properties are not suitable for screen printing or dispensing. This can be remedied by adding a small amount of polyethylene glycol (PEG) 200. PEG 200 partially dissolves in the epoxy resin but also in the polar fluid, thereby reducing the three-phase contact angle of the polar fluid on the silver flake surface. This appears to enable the formation of a “capillary” state capillary suspension with 2-3 vol% added PEG, which provides a high yield stress guaranteeing high stability and good application behavior. The corresponding coarsening of the microstructure does not affect the electrical properties. The application of this concept enables the formulation of an ECA that meets industrial performance criteria even at very low particle content. The transfer to other filler systems, such as silver-coated copper or glass particles, is straightforward and offers a pathway toward robust, cost-effective, and sustainable ECAs for next-generation photovoltaic modules.
Keywords
INTRODUCTION
Electrically conductive adhesives (ECAs) are composite materials consisting of a polymer matrix and a conductive filler, serving the dual function of mechanical and electrical interconnection. The mechanical properties are primarily determined by the polymer matrix, which is typically based on epoxy resins, although silicone- and acrylate-based systems are also employed[1,2]. The electrical properties, in contrast, are largely determined by the conductive filler, most commonly silver due to its high electrical conductivity and chemical stability[3,4]. Both, mechanical strength and electrical conductivity depend on the filler content. Whereas mechanical properties, such as tensile or lap-shear strength, generally decrease with increasing filler loading, electrical conductivity arises from the formation of sample-spanning conductive pathways[5].
At low filler contents, the electrical conductivity of the composite is dominated by the insulating polymer matrix, typically ranging from 1012 to 1015 Ω·cm[6]. At a certain filler content, the so-called percolation threshold, the particles form conductive pathways throughout the ECA, and the conductivity increases by several orders of magnitude. The percolation threshold depends on particle size, shape, and surface properties, which influence colloidal interactions. Flake-shaped particles are often preferred over spherical ones due to their higher surface-to-volume ratio and, therefore, lower percolation threshold[7]. Commercially available ECAs typically contain 20 vol% to 30 vol% silver. Increasing the silver volume fraction beyond this range yields only marginal improvements in conductivity while weakening both the cohesive and adhesive strength of the composite[8]. As such, ECAs are widely used in circuit board assembly and die attachment applications, e.g.[8].
In recent years, ECAs have gained considerable attention in the photovoltaic (PV) industry as a replacement for conventional solder bonds, primarily due to their low-temperature processing capability[9,10]. The comparatively low Young’s Modulus of ECAs relative to solder materials enables a novel solar module layout. In the shingled interconnection architecture, solar cells overlap like roof tiles and are directly bonded to one another[11,12]. Recent studies have identified key performance requirements for ECAs in shingled solar cell interconnections. These are a volume resistivity below 10-2 Ω·cm[9], a contact resistivity below
Considering the growing demand for renewable energy and the associated expansion of PV installations, material supply is becoming an increasing concern. Today, approximately 20% of the annual silver production is demanded by the PV industry[15]. Consequently, silver consumption for solar cell metallization per watt-peak is expected to decrease by 50% over the next decade[16]. Since ECAs represent an additional source of silver in solar modules, reducing the silver content in these adhesives is essential from both economic and resource availability perspectives. Therefore, concepts to lower the silver fraction in ECAs while maintaining low electrical resistivity are of considerable interest.
During the manufacturing process, silver flakes are often coated with lubricants. Chemically, these lubricants are salts formed by the reaction of fatty acids used in the milling process with silver[17]. While such lubricants enhance the dispersibility of the flakes and influence the rheological properties of the adhesive, they deteriorate electrical conductivity[18]. Extensive research has therefore focused on removing these lubricants from the silver particle surface to improve conductivity[19-24]. Various approaches have been explored, including pre-treatment with short-chain (di)carboxylic acids[19] or their direct incorporation into the ECA formulation[20], as well as the use of sulfuric acid[21], aldehydes[22], coupling agents[23] and thermal treatment[24]. As a result, ECAs containing 67-80 wt% silver (app. 20-30 vol%) have achieved volume resistivities in the range of 5 ×10⁻⁴ Ω·cm. to 4 ×10⁻³ Ω·cm.
By applying the capillary suspension concept to ECAs, the percolation threshold can be significantly reduced[25]. In this approach, a small fraction of secondary, non-miscible liquid phase is added to the ECA, leading to the formation of a particle network stabilized by capillary forces. Furthermore, the secondary liquid can act as a carrier for additives that remove the lubricant layer directly at the particle-particle contact points. In a previous study[13], we demonstrated that this concept enables the formation of a percolated particle network at filler contents between 5 and 10 vol% while still meeting the requirements for solar cell shingling. The high electrical conductivity achieved at such low particle loadings suggests the potential to further reduce the filler content. However, at very low particle loadings (≤ 5 vol%), the previously employed secondary liquid was insufficient to ensure colloidal stability in the uncured state. Such low-filled ECAs typically exhibit no or only a weak yield stress and low viscosity; thus, they are prone to sedimentation or phase separation, and their flow behavior is not suitable for dispensing or screen printing processes. Although stability and flow behavior may be adjusted by adding established rheology modifiers, this can deteriorate the electrical properties of the cured ECA.
Polyethylene glycol (PEG) with low molecular weight has been reported to enhance the electrical conductivity of ECAs[17]. Lu et al.[17] proposed that PEG facilitates the removal of the fatty acids from the particle surface. However, their study focused on highly-filled ECA with 80 wt% (30 vol%) silver. In the present study, PEG 200 is introduced into low-filled ECAs containing only 5 vol% silver or less. We demonstrate that PEG 200 induces morphological changes within the ECA, enhancing stability and printability in the uncured state, while also improving the cohesive strength of the cured composite. These effects are attributed to the formation or reinforcement of a capillary suspension network, even at low filler contents, enabled by PEG 200. As low electrical resistivity is maintained, this concept offers significant potential for reducing silver consumption in solar cell interconnection technologies.
EXPERIMENTAL
Materials
The ECA investigated in this study consists of an epoxy resin, a polar liquid and silver flakes (x50,3 app. 11 µm in diameter, thickness: 100 nm), which were provided by Protavic International (France). PEG 200 [average molecular weight: 190-210 Da, glass transition temperature (10 K·min-1): -89 °C, viscosity (25 °C): 0.05 Pa·s] was purchased from Sigma-Aldrich (Germany).
ECA preparation
ECAs with silver contents ranging from 1 vol% to 20 vol% were prepared. A low-filled ECA containing
Electrical characterization
Volume resistivity was measured by 4-point-measurement with a 2450 SourceMeter (Keithley, USA). Three ECA lines of 4 mm width and 0.1 mm thickness were applied onto glass substrates using a doctor-blade through a stencil, cured, and measured three times each at a current of 100 mA. Mean values
Contact resistivity measurements were adapted from[11]. An ECA line was cured on a circuit board featuring ten silver fingers. Joint resistance RJ, ECA bulk resistance RB, and finger resistance RF were measured using a 4-point-measurement. Contact resistivity ρc was calculated according to Eq. 3[11]:
where A denotes the contact area. Mean values and standard deviations were derived from 28 data points.
Rheological characterization
Yield stress was measured using a rotational rheometer (MARS, ThermoFisher, Germany) equipped with a plate-plate geometry. Shear stress was increased from 0.1 Pa to 1,000 Pa in 81 logarithmic steps. The resulting deformation was plotted against shear stress in a double-logarithmic diagram. The yield stress was determined as the intersection point of tangent fits to the regimes of elastic deformation and viscous flow[26]. Each sample was measured three times, and mean values and standard deviations were calculated.
Mechanical characterization
Lap-Shear strength was measured according to[27] using carbon-steel as the substrate. The bonding area was app. 15 mm2. Three measurements per formulation were performed using a tensile testing machine (TA.XT plus Texture Analyser, Stable Micro Systems, UK) at a crosshead speed of 0.2 mm·s-1. For the determination of Young’s Modulus, ten specimens per formulation were prepared in accordance with DIN EN ISO 20753, type A22[28] and pulled at a crosshead speed of 0.01 mm·s-1. For both parameters, mean values and standard deviations were calculated.
Long-term stability validation
Moisture uptake
To determine moisture uptake in the uncured state, an ECA formulation without curing agent (5 vol% silver, 3 vol% PEG) was prepared and dried at 120 °C using a moisture analyzer (HX204, Mettler Toledo, Switzerland , resolution: ±0.0001 g). Samples were subsequently stored at -20 °C for one month prior to a second measurement. Each measurement was performed in triplicate. To determine moisture uptake in the cured ECA, three specimens (5 vol% silver, 3 vol% PEG) prepared for volume resistivity measurements were weighed using a precision balance (ME204T/00, Mettler Toledo, Switzerland, resolution: ±0.0001 g). Samples were stored under standard laboratory conditions for one month and re-weighed every seven days, resulting in six measurement points.
Simplified thermal cycling
Four specimens for resistivity characterization were subjected to 35 temperature cycles between 20 and 85 °C, which each cycle lasting 20 min. Electrical performance was determined before and after cycling.
Damp heat exposure
Four specimens for resistivity characterization, of which two were covered with temperature-resistant tape, were placed in an oven at 85 °C above a water bath. Electrical performance was measured before and after
Optical microscopy of ECAs
Microstructural analysis of uncured and cured ECAs was conducted using an optical microscope (Leica DMRX, Leica, Germany) at 100× magnification. To quantify the particle area coverage and the mixing quality, microscope image sections with dimensions of 1000 × 1250 pixels were analyzed. The microscope images were converted to black and white using a threshold value of 125 (greyscale range: 0-255), where white pixels represent silver particles and black pixels correspond to the epoxy resin, polar liquid and PEG. The homogeneity of the particle/polymer mixture was determined using the mixing quality parameter according to
where pi denotes the fraction of white pixels in subsection i and
Polymer characterization
Differential scanning calorimetry (DSC; DSC 214 Polyma, Netzsch, Germany) was used to determine the glass transition temperature Tg of the components and ECA formulations. Samples were cooled to -130 °C and subsequently heated to -20 °C at a rate of 10 K·min-1 for two cycles. Tg was determined from the step-change in the heat flow during the heating cycle as the temperature corresponding to half of the enthalpy change.
Contact angle, interfacial tension, and turbidity determination
For contact angle determination, silver particles were compressed into flat discs. A droplet of secondary liquid (polar liquid and PEG) was set on the particle surface within the surrounding main liquid (polymer and PEG). A shadow image of the drop was recorded and analyzed using the Drop Shape Analyzer (DSA, Krüss, Germany) software. Drop shape analysis was performed five times per liquid combination, and mean values and standard deviations were calculated. Interfacial tension was determined using the pendant drop method. Sample turbidity was characterized by measuring the optical density at app. 600 nm using a photometer (Implen OD600, Implen, Germany). Each sample was measured three-times relative to a reference sample.
RESULTS AND DISCUSSION
PEG 200 enhances the mechanical properties of ECAs
The components of a commercially available ECA, consisting of an epoxy resin, silver flakes, and a small amount of polar liquid, were employed in this study. In a previous study[13], the silver flake volume fraction was increased from 5 vol% to 20 vol%. Even at a low filler content of only 5 vol%, the cured ECA exhibited a volume resistivity below 10-2 Ω·cm [Figure 1A], which is sufficient for application in solar cell shingling. Increasing the filler content led to a further reduction in volume resistivity. At higher filler contents
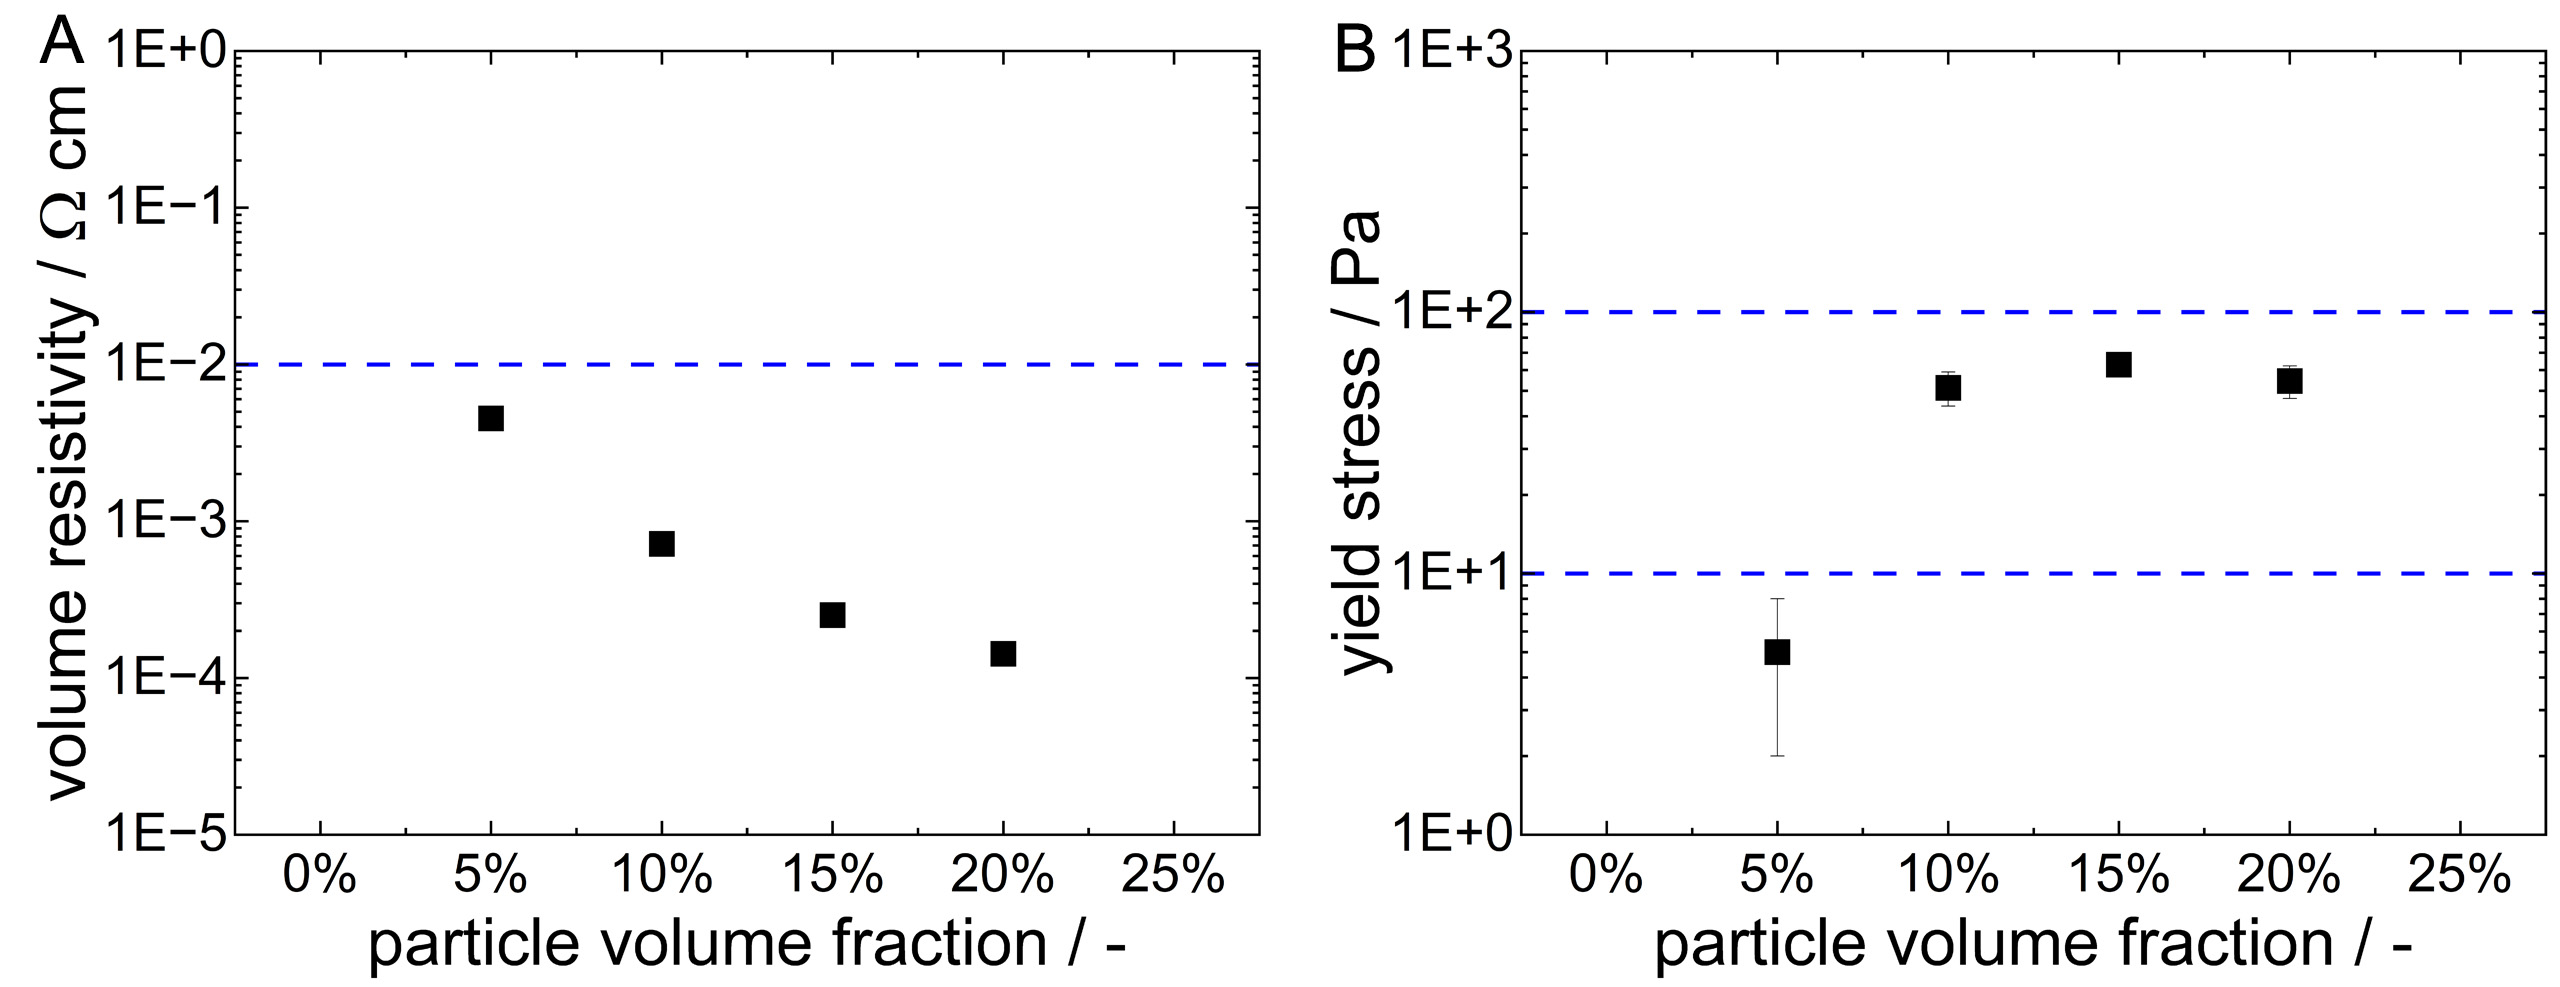
Figure 1. (A) Volume resistivity and (B) yield stress of ECAs where the silver volume fraction is adjusted between 5 and 20 vol%. The dashed blue lines indicate the maximum allowable volume resistivity and the minimum and maximum yield stress required for solar cell interconnection, respectively. Data was taken from[13]. The squares indicate the mean values, and the error bars denote the standard deviation obtained from 9 (volume resistivity) and 3 (yield stress) measurements, respectively. ECAs: Electrically conductive adhesives.
As shown in Figure 2, the addition of polyethylene glycol with an average molecular weight of 200 Dalton (PEG 200) enhances the yield stress of such a low-filled ECA and its lap-shear strength in the cured state. For an ECA containing 5 vol% silver flakes, the addition of 1 vol% PEG 200 (relative to the epoxy resin) increases the yield stress from (5 ± 3) Pa to (32 ± 1) Pa [Figure 2A]. Upon further addition of PEG 200, the yield stress decreases again and vanishes at 10 vol% PEG 200. A similar non-monotonic trend is observed for the lap-shear strength [Figure 2B]. In the absence of PEG, the ECA exhibits a lap-shear strength of (17 ± 4) MPa, which increases to a maximum of (28 ± 3) MPa at 3 vol% PEG 200. Even at a high PEG 200 content of
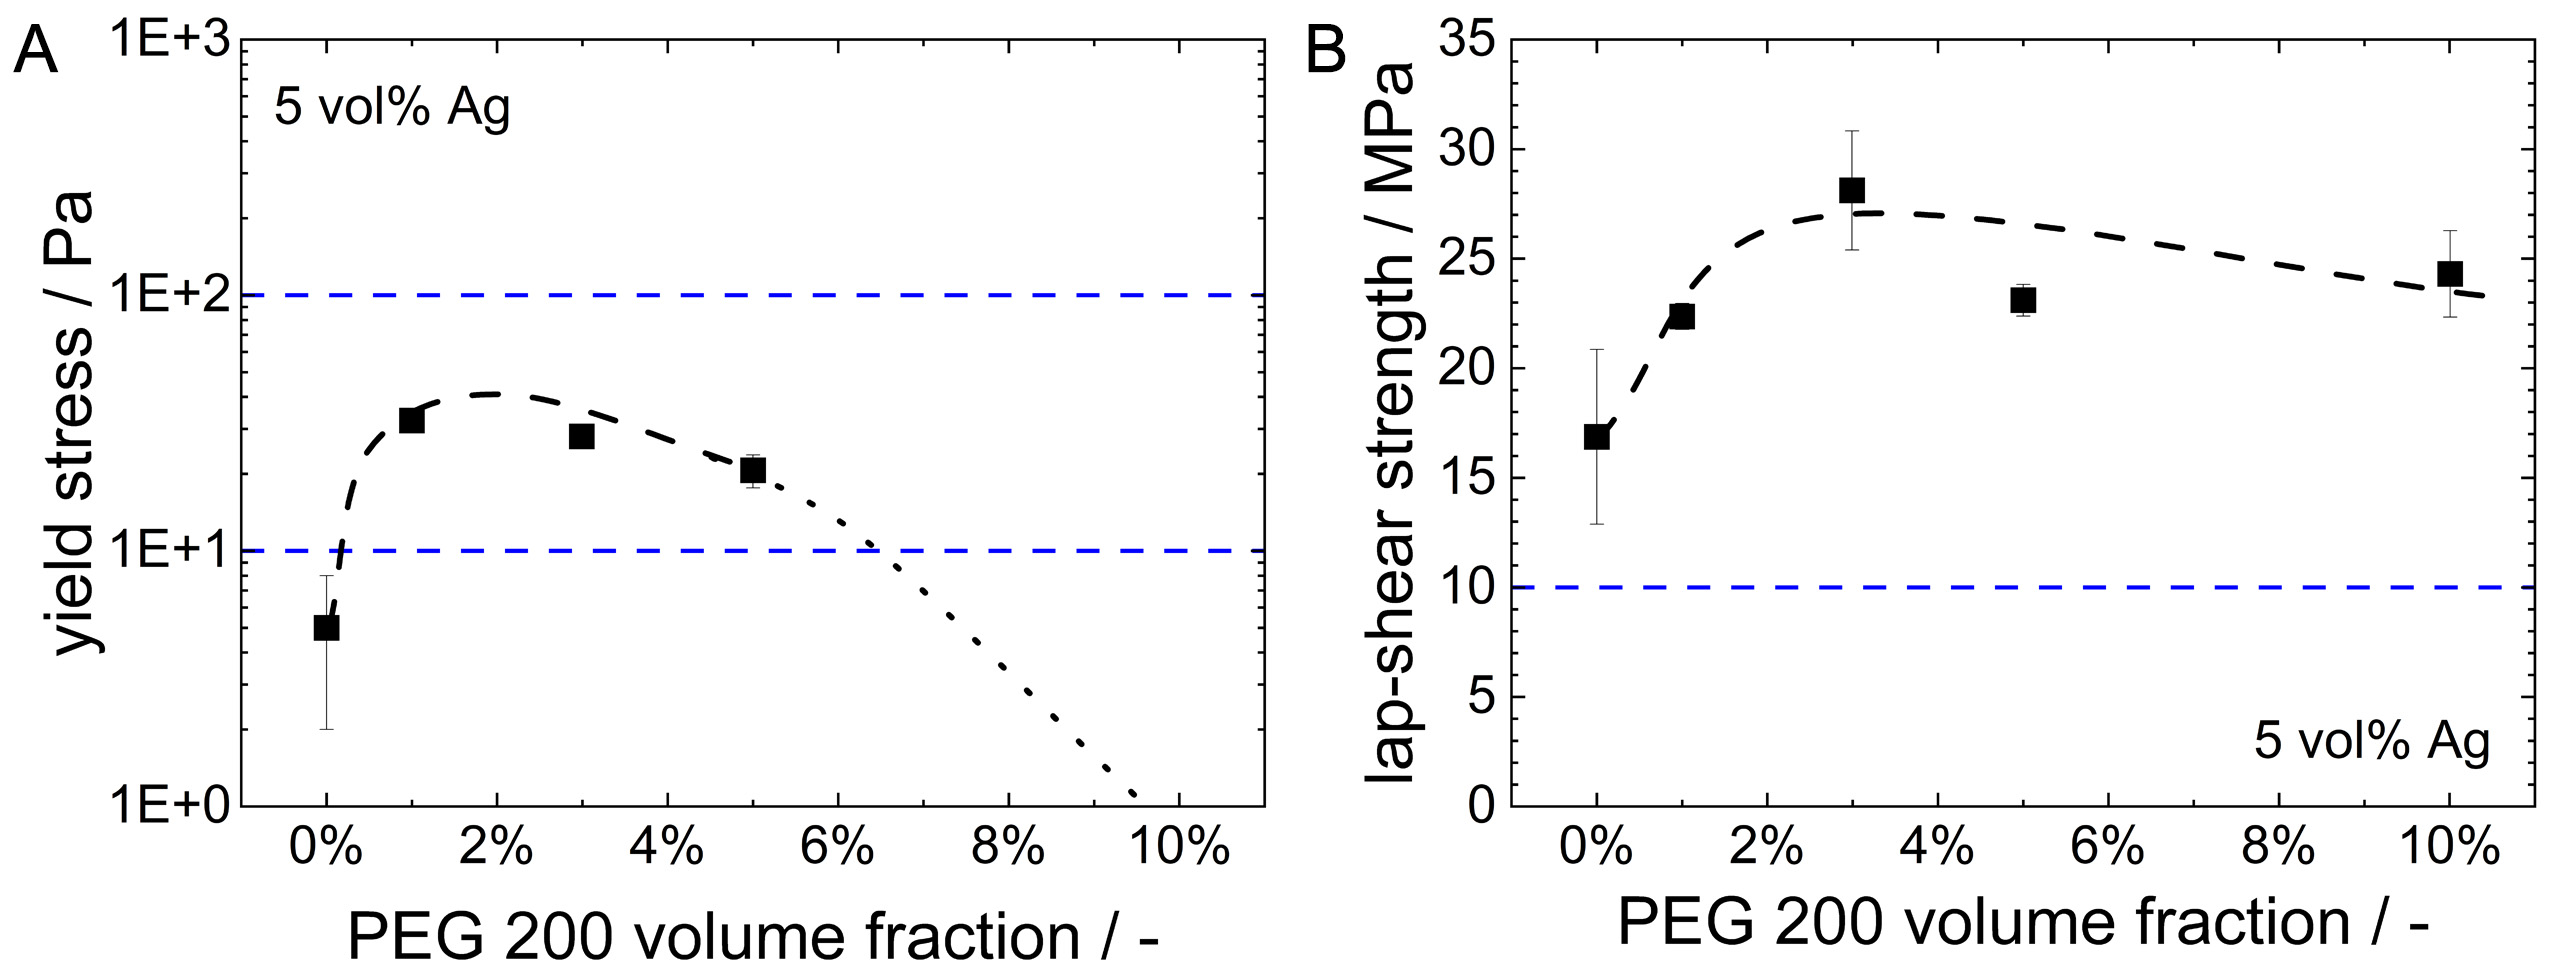
Figure 2. (A) Yield stress and (B) lap-shear strength of an ECA containing 5 vol% silver as a function of PEG 200 volume fraction
Remarkably, volume and contact resistivity remain unaffected by the addition of PEG. The volume resistivity remains merely unchanged at app. (0.4 ± 0.04) × 10-2 Ω·cm [Figure 3A], while the contact resistivity is
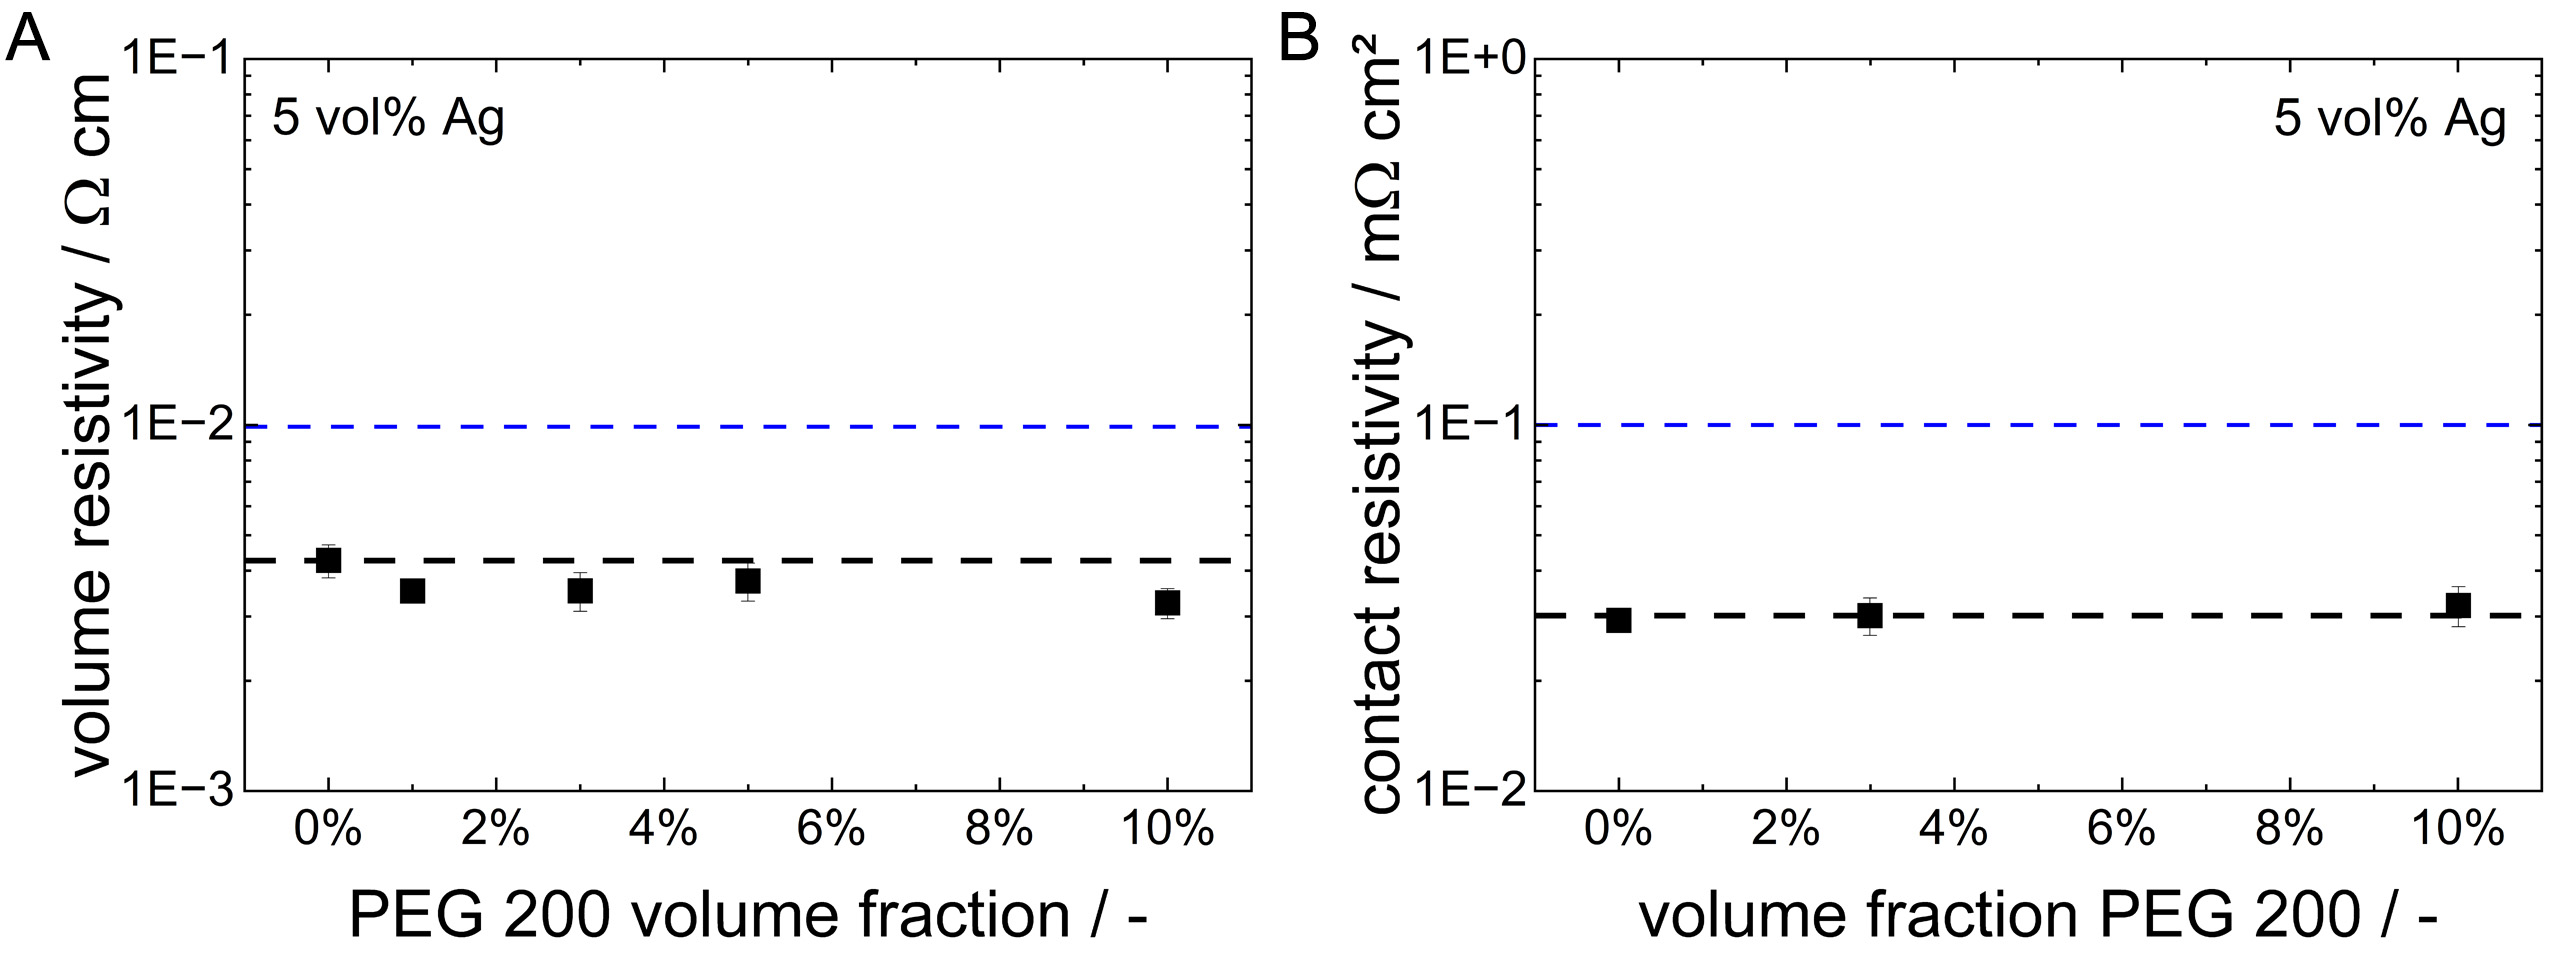
Figure 3. (A) Volume resistivity and (B) contact resistivity of an ECA containing 5 vol% silver as a function of PEG 200 volume fraction (0-10 vol%). Dashed black lines are to guide the eye, while dashed blue lines indicate the maximum allowable volume and contact resistivity for solar cell interconnection, respectively. The squares indicate the mean values, and the error bars denote the standard deviation obtained from 9 (volume resistivity) and 28 (contact resistivity) measurements, respectively. ECA: Electrically conductive adhesive; PEG: polyethylene glycol.
For the ECA containing 5 vol% silver flakes, the maximum yield stress is observed at 1 vol% PEG 200, whereas the maximum in lap-shear strength occurs at 3 vol% PEG 200. Therefore, a PEG 200 content corresponding to half the particle volume was selected for subsequent experiments. To determine the minimum required silver content, the silver volume fraction was further reduced in steps of 1 percentage points. Formulations containing 3 vol% silver flakes or more exhibit a yield stress. At 4 vol% particles (with
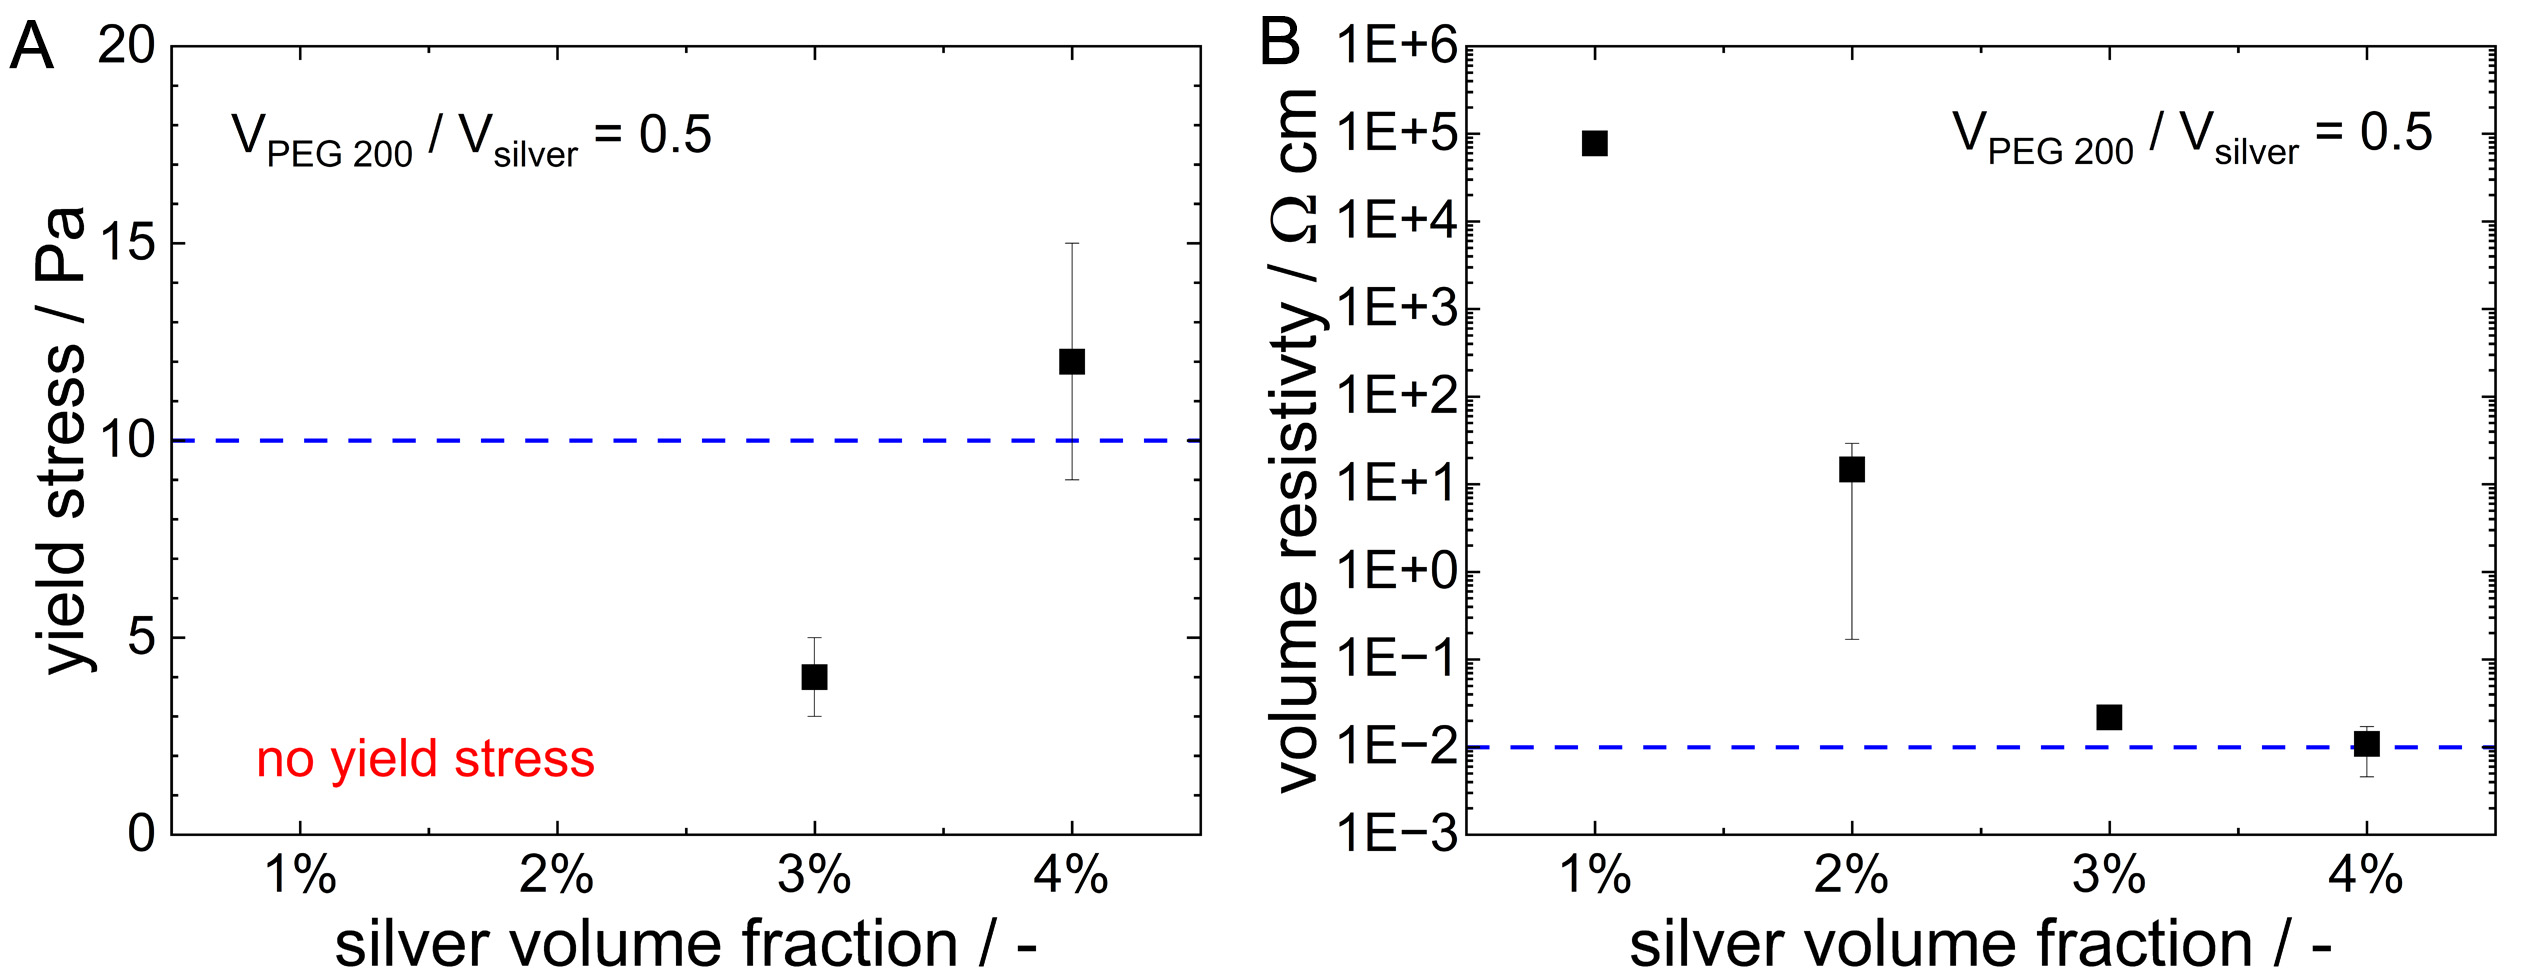
Figure 4. (A) Yield stress and (B) volume resistivity of ECAs with silver volume fractions between 1 and 4 vol% at a fixed PEG 200-to-silver volume ratio of 0.5. The dashed blue lines indicate the minimum yield stress required for solar cell interconnection and the maximum allowable volume resistivity, respectively. The squares indicate the mean values, and the error bars denote the standard deviation obtained from 3 (yield stress) and 9 (volume resistivity) measurements, respectively. ECAs: Electrically conductive adhesives; PEG: polyethylene glycol.
Since PEG is known to be hygroscopic and moisture plays a critical role in solar cell operation, moisture uptake was evaluated for both uncured and cured ECA samples. No measurable moisture content was detected in the uncured sample, and the mass of the cured samples remained constant over one month during storage under standard laboratory conditions. For all samples, including 3 replicates per formulation, variations were within the measurement uncertainty of the balances. These results indicate that no significant water uptake occurs in the investigated ECAs containing PEG.
Beyond initial performance, ECAs must withstand stresses encountered during work life. In shingled solar modules, these stresses primarily arise from changing environmental conditions, such as temperature fluctuations and therefore, thermomechanical stresses due to mismatched coefficients of thermal expansion of the different materials in the PV module, as well as moisture exposure. On ECA level, four specimens each were subjected to simplified thermal cycling and damp heat testing. After aging, the electrical performance of the ECA containing 4 vol% silver and 2 vol% PEG varied only within the measurement uncertainty compared to the initial values. At module level, stress testing is conducted according to IEC 61215-2. Most common are the thermal cycling test (MQT 11), in which modules are cycled between -40 and 80 °C, as well as the damp heat test (MQT 13), involving storage at 85 °C and 85% rel. humidity. Modules produced with ECAs containing the same components as those used in this study, but in different concentration, exhibited a competitive initial module efficiency of (19.6 ± 0.2)% and limited relative efficiency losses of
In comparison with commercially available ECAs dedicated to or suitable for PV applications, the ECA containing 4 vol% silver exhibits comparable or superior electrical and mechanical performance despite its very low silver filler content. Specifically, it achieves a yield stress of (12 ± 3) Pa, a volume resistivity of
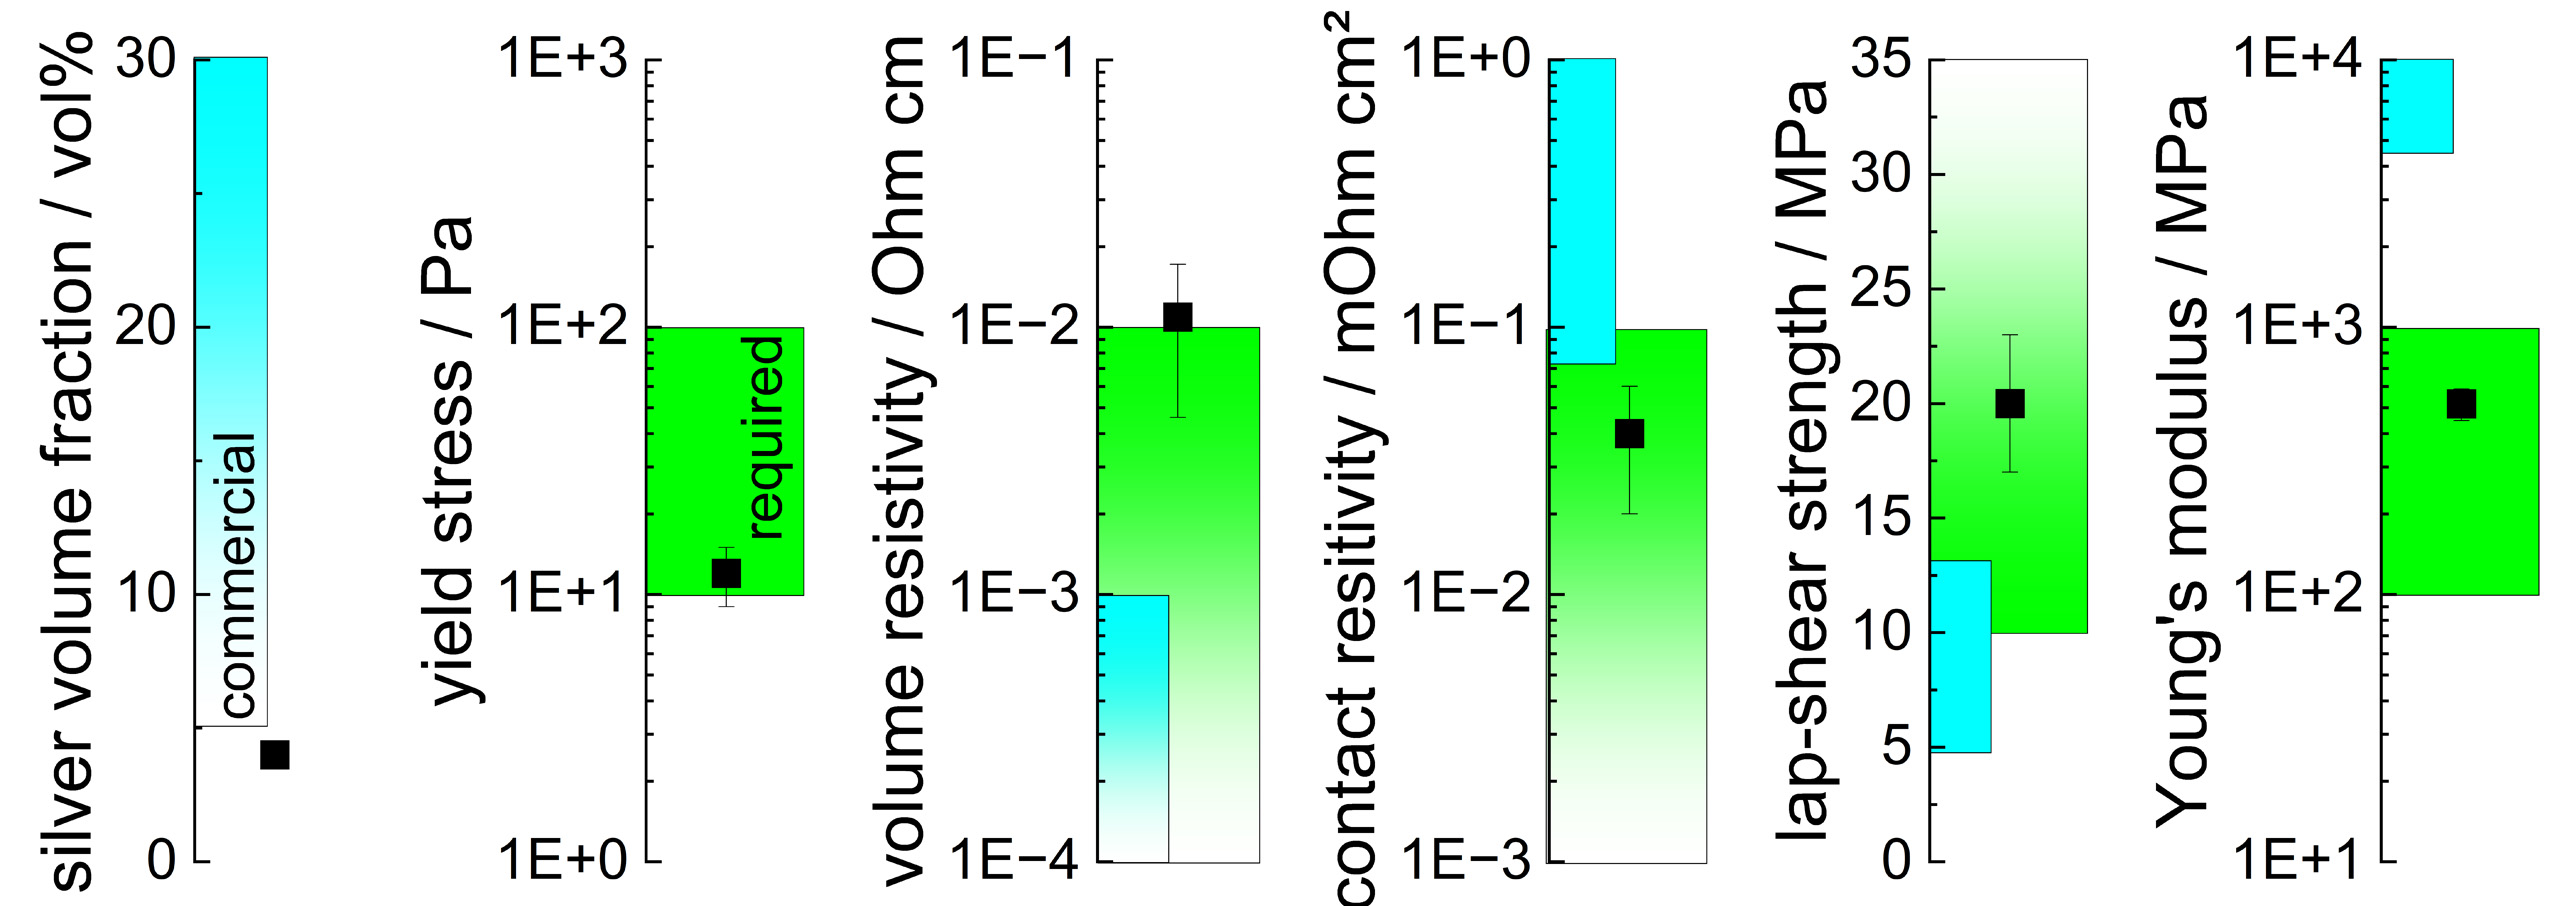
Figure 5. Properties of an ECA containing 4 vol% silver and 2 vol% PEG. Black squares indicate mean values, and error bars represent the standard deviation obtained from 3 (yield stress and lap-shear strength), 9 (volume resistivity), 28 (contact resistivity), and 10 (Young’s Modulus) measurements. Result are compared with values reported for commercial products (blue boxes) and the requirements for solar cell shingling (green boxes). ECA: Electrically conductive adhesive; PEG: polyethylene glycol.
In conclusion, PEG 200 effectively stabilizes low-filled ECAs against de-mixing or sedimentation by inducing a yield stress in the range of 10-100 Pa, thereby enabling processing via screen-printing and dispensing. The corresponding cured ECAs meet all relevant electrical and mechanical requirements for solar cell shingling. Thus, PEG 200 enables a significant reduction in silver consumption for solar cell interconnection, allowing the use of ECAs containing as little as 4 vol% silver instead of conventional systems with 20-30 vol% silver.
PEG 200 potentially promotes the formation of a capillary suspension
PEG 200 has previously been reported to partially remove the organic fatty acid layer, which forms on the silver surface during particle processing[17], resulting in a decreased volume resistivity. However, in the present study, no such decrease in resistivity was observed. Instead, thermogravimetric analysis indicates PEG 200 absorbs onto the silver surface (see Supplementary Figure 2), partially replacing rather than removing the fatty acid layer. Notably, the molecular weight of PEG 200 is comparable to that of commonly reported fatty acids typically on the particle surface, such as stearic acid (284 g/mol) or oleic acid
PEG 200 primarily enhances the mechanical properties of the ECA in both the uncured and cured states. To further investigate this effect, light microscopy images of the uncured and cured samples were taken. No structural changes were observed upon curing, indicating that the particle arrangement is largely preserved during crosslinking. Representative micrographs of cured samples containing 5 vol% silver flakes and varying PEG 200 content (0-10 vol%) are shown in Figure 6. The original greyscale images were converted into binary images using a threshold value of 125 (greyscale range: 0-255). An overlay of the original and processed images is provided in the Supplementary Materials [Supplementary Figure 3]. In the binary images, black pixels represent the epoxy resin, including the polar liquid and PEG where applicable, while white pixels represent the silver particles. The average area fraction of white pixels of app. 32% exceeds the actual particle content of 5 vol%. This discrepancy can be attributed to the preferential alignment of flake-shaped particles parallel to the sample surface, and to some extent to the optical depth of field of the microscope lens. The two-dimensional images capture features within a depth of several micrometers rather than an infinitesimally thin plane, thereby giving the impression of a higher particle loading. From the images, a morphological evolution in particle distribution is evident with increasing PEG 200 content. The initially homogeneous particle distribution transitions into a progressively heterogeneous microstructure. This change is quantitatively reflected by an increase in the average characteristic length of polymer-rich regions (black areas) from (31 ± 1) µm to (59 ± 4) µm [Figure 7A], indicating a microscale phase separation induced by PEG addition. Consistently, the mixing quality parameter decreases from (67 ± 4)% to (48 ± 3)%
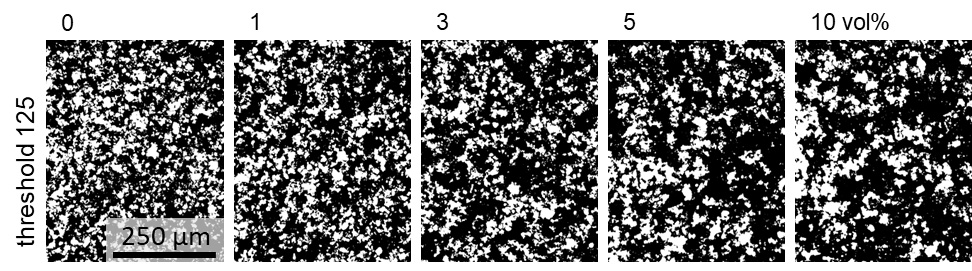
Figure 6. Microstructure of ECAs with varying PEG 200 content, illustrated by light microscopy images of the surface of cured ECA sample which contain 5 vol% silver flakes and 0-10 vol% PEG. ECAs: Electrically conductive adhesives; PEG: polyethylene glycol.
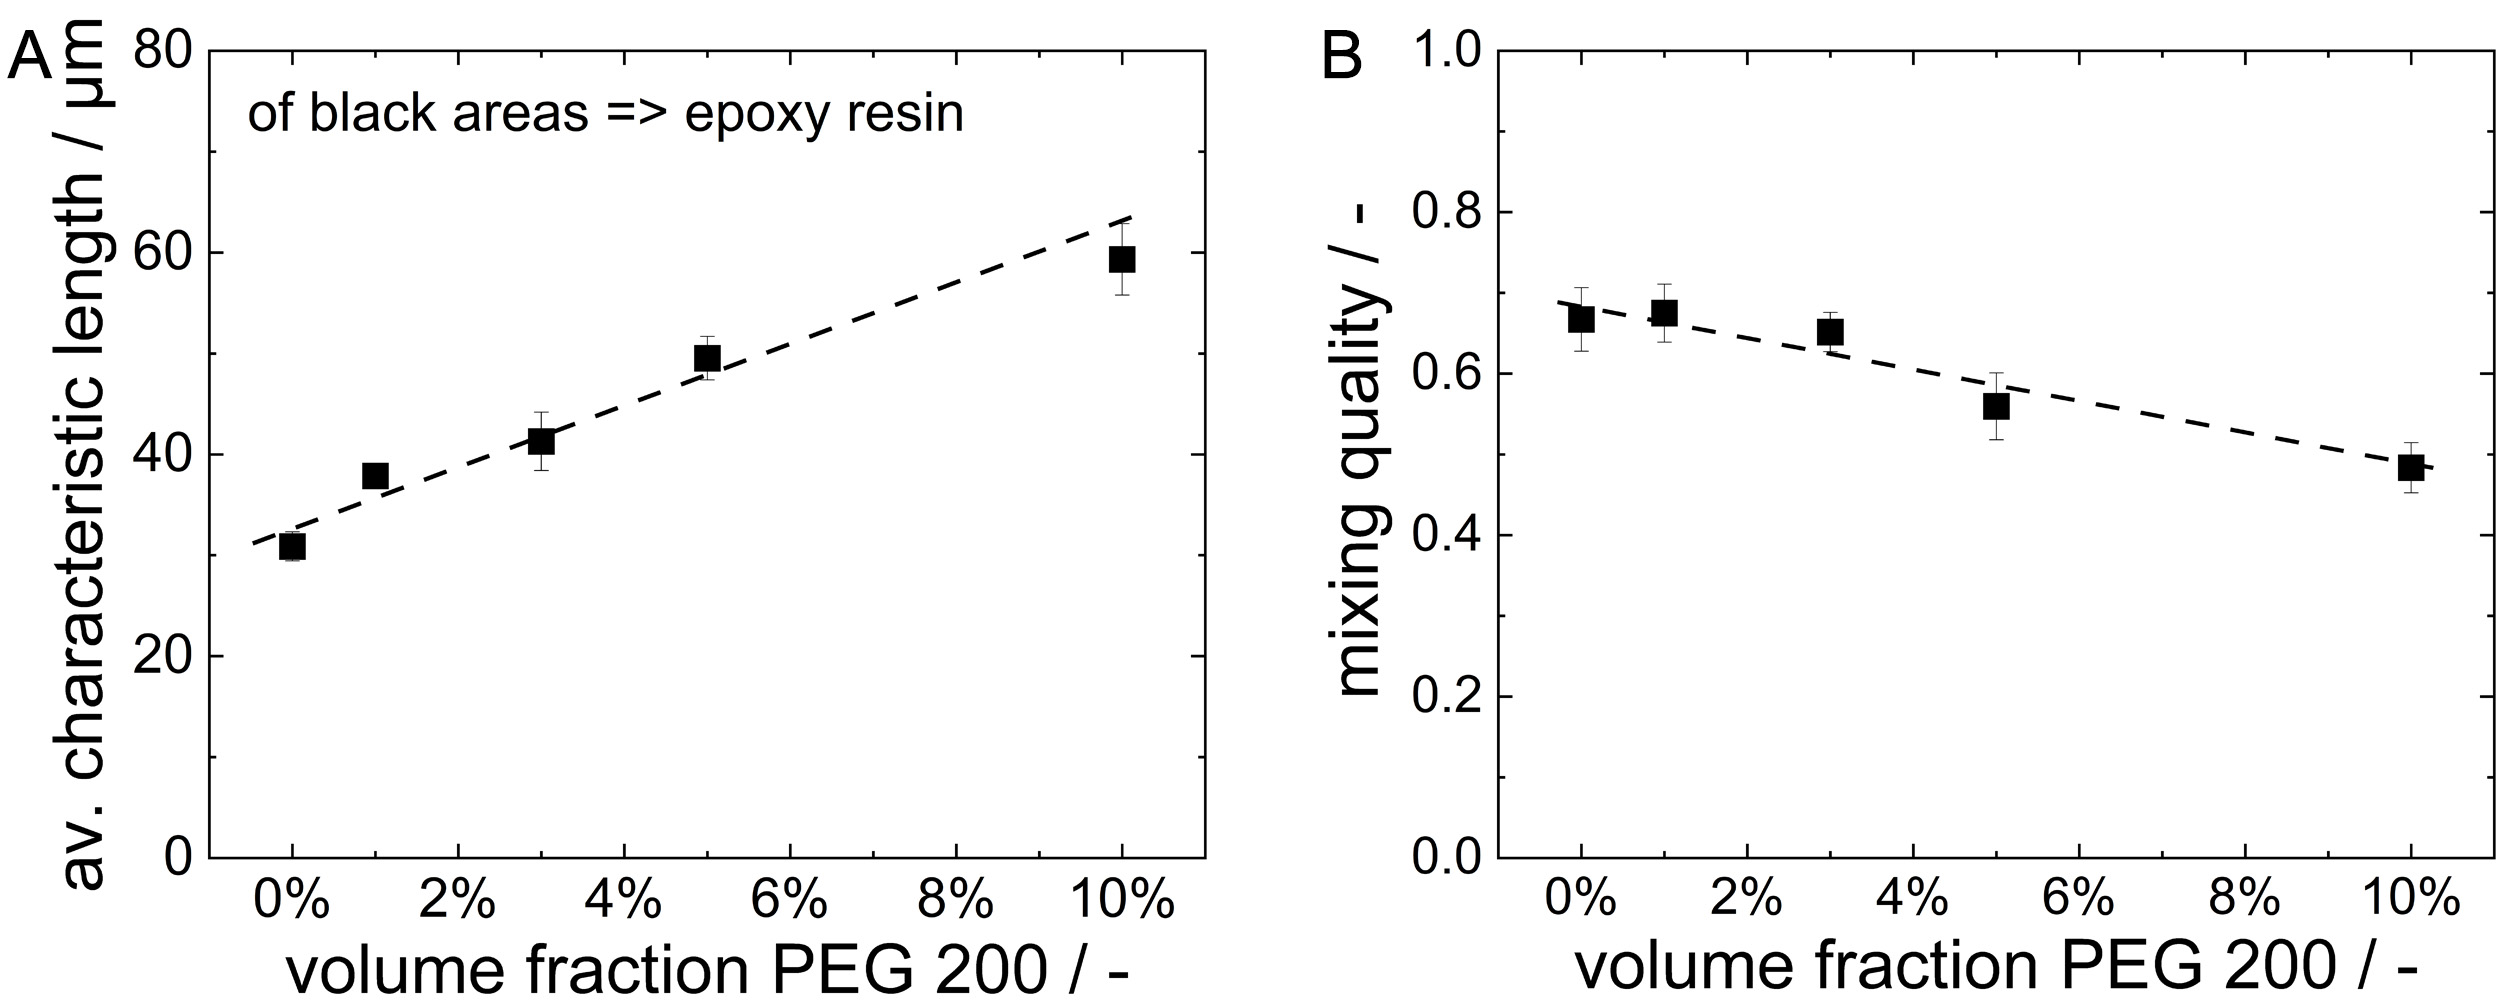
Figure 7. (A) Average characteristic length of the polymer-rich regions (black areas which represent the epoxy resin) and (B) mixing quality parameter (Eq. 4) as a function of PEG 200 content in ECAs containing 5 vol% silver. Dashed black lines are to guide the eye. The squares indicate the average values, and the error bars denote the standard deviation obtained from 4 images per formulation, as exemplarily shown in Figure 6. ECAs: Electrically conductive adhesives; PEG: polyethylene glycol.
While the morphological analysis reveals a monotonic coarsening of the microstructure with increasing PEG 200 content, both yield stress and lap-shear strength [Figure 2] exhibit non-monotonic behavior. Regarding the mechanical strength of solid composite materials, Gordon et al.[36] demonstrated that the cohesion of composites strongly depends on particle distribution and orientation. The increasing microheterogeneity with increasing PEG 200 content may lead to an enhancement in lap shear strength. This effect is, however, counteracted by the increasing PEG 200 content itself, which does not participate in the curing reaction. Therefore, PEG 200 does not contribute to the cohesive strength, contrarily, it substitutes up to 10 vol% of the cured polymer matrix. Consequently, the cohesive strength decreases at high PEG contents, resulting in an optimum at 3 vol% added PEG 200.
The increase in yield stress upon addition of PEG [Figure 2A] indicates the formation or reinforcement of a strong, uniform particle network. At higher PEG contents, however, this network appears to transition into a structure of weakly bound particle agglomerates, resulting in a reduction of both strength and yield stress. Such a transition from well-distributed particles to a strongly bound, uniform particle network and subsequently to a network of weakly bound particle agglomerates is typical for capillary suspensions[37] and is consistent with the observed microstructural evolution in the investigated ECAs.
Capillary suspensions[25] are ternary solid-liquid-liquid systems in which a small amount of an immiscible secondary liquid is added to a binary suspension. The secondary liquid induces the formation of a sample-spanning, so-called percolating particle network, resulting in a strong yield stress and pronounced shear thinning behavior. When the secondary liquid preferentially wets the particles (three-phase contact angle < 90°), strong pendular bridges form between the particles and accordingly this is called the “pendular” state. The strength of a “pendular” state suspension is governed by the capillary force acting on each particle bridge, which depends on the interfacial tension between the main and secondary liquid phase and the three-phase contact angle[38]. A large fraction of preferentially wetting secondary liquid may lead to so-called spherical agglomeration, i.e. the formation of large compact agglomerates, which at high enough particle loading self-assemble into a weakly bound percolating network, hence resulting in a decrease of yield stress compared to a uniform pendular network[39]. In systems in which the bulk liquid preferentially wets the particles (three-phase contact angle between 90° and app. 145°), particles assemble around droplets of the secondary liquid, shielding it from the main liquid, forming clusters that reduce the free energy of the system. These particle clusters self-assemble into a percolating particle network, referred to as the “capillary” state, and again result in a strong yield stress and pronounced shear thinning of the suspension. The cluster configuration and hence the yield stress of the suspension primarily depend on the three-phase contact angle and the amount of secondary liquid[25].
A necessary requirement for the formation of a capillary suspension is the presence of a distinct, immiscible secondary liquid phase. However, DSC results [Supplementary Figure 4] show that PEG 200 is miscible with both the epoxy resin and the polar liquid, as evidenced by single glass transition temperatures in their respective mixtures, located between the Tg of the pure components. In contrast, epoxy resin and the polar liquid are non-miscible, as confirmed by a finite interfacial tension of (7.7 ± 0.2) mN·m-1 between the phases.
DSC results for ECAs containing 5 vol% silver flakes and varying PEG 200 contents are depicted in Figure 8A. The curves exhibit a glass transition at -56 °C, corresponding to the epoxy resin (lower diagram in Figure 8A). This Tg decreases with increasing PEG 200 content, confirming partial dissolution of PEG 200 in the resin. Additionally, a second glass transition appears for the ECAs containing PEG 200 at app. -85 °C, the glass transition temperature of PEG 200 (upper diagram in Figure 8A). The relatively small step height of this lower Tg reflects the low mass fractions of PEG (0-6.5 wt%) and polar liquid (0.4 wt%). The presence of the glass transition between -80 and -90 °C is further confirmed at higher heating rates, where the signal becomes more pronounced [Supplementary Figure 5]. As the fraction of polar liquid remains constant, the increasing intensity of the low-temperature glass transition must be attributed to PEG 200. It is therefore concluded that PEG partially contributes to the secondary liquid phase volume. Quantitative analysis suggests that app. 17% of the PEG 200 in the ECA containing a total of 5 vol% PEG contributes to the secondary liquid phase. For the ECA with 10 vol% PEG 200, this fraction increases to 26%. This corresponds to secondary liquid volume fractions of 0.8 and 2.6 vol%, resp., in addition to the 0.5 vol% polar liquid. An increase in secondary liquid volume fraction was confirmed by determination of the absorbance at 600 nm of samples containing epoxy resin, polar liquid and different volume fractions of PEG 200. The absorbance is a measure for turbidity and increases slightly with increasing PEG 200 content [Figure 8B], indicating an increase in the number and/or size of dispersed secondary liquid droplets.
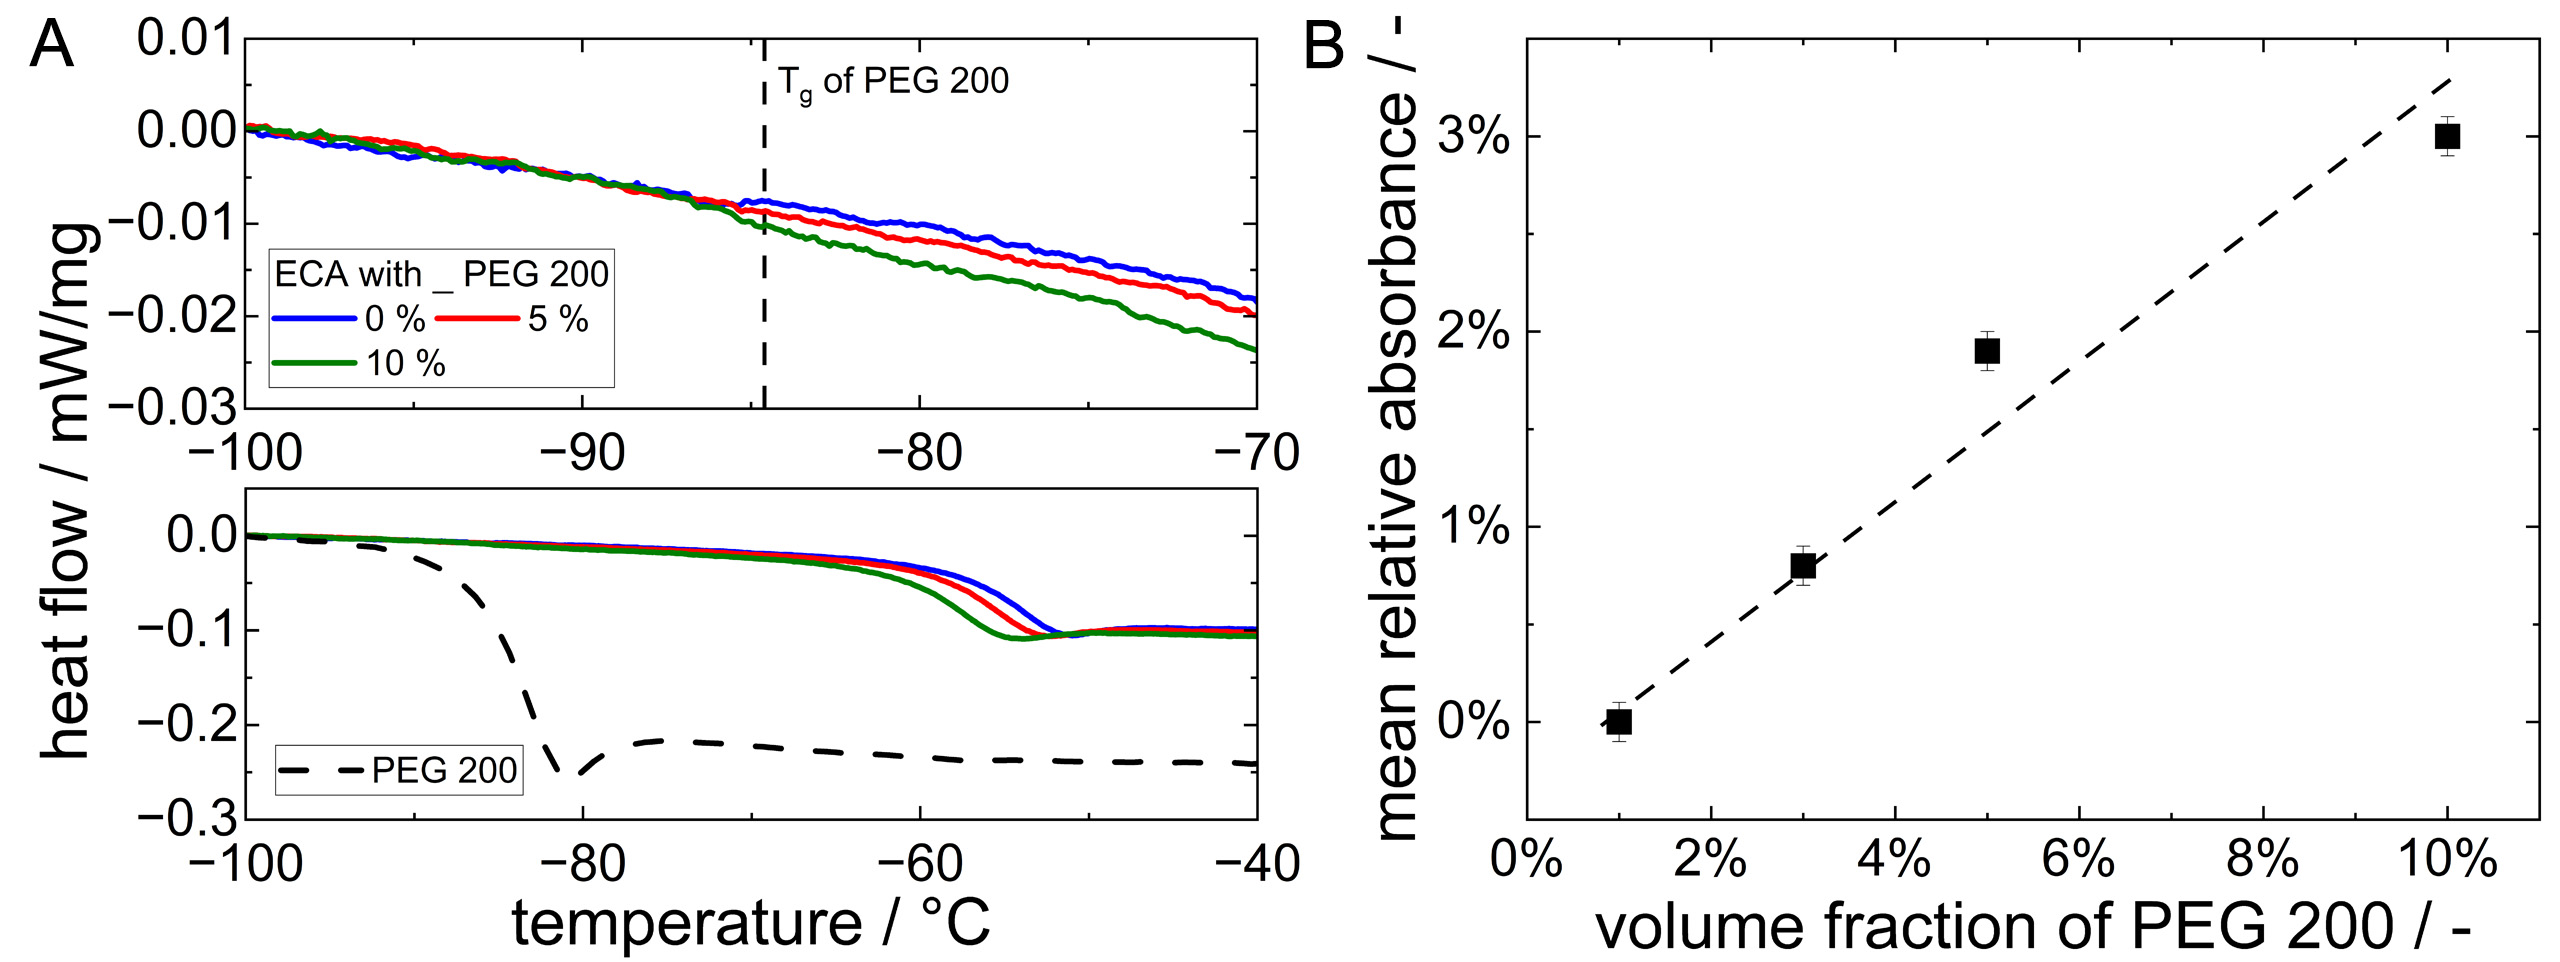
Figure 8. (A) DSC analysis of ECAs containing 5 vol% silver and varying of PEG 200 content. The heat flow of pure PEG 200 is shown as reference. The lower diagram depicts the temperature range from -100 to -40 °C, while the upper diagram provides a detailed view of the temperature range between -100 and -70 °C. All measurements were performed at a heating rate of 10 K·min-1; (B) Mean relative absorbance of epoxy-polar liquid-PEG 200 mixtures as a function of PEG 200 content, determined at a wavelength of 600 nm using an Implen OD600. The dashed line is to guide the eye. The squares indicate the mean values, and the error bars denote the standard deviation obtained from 3 measurements. ECA: Electrically conductive adhesive; PEG: polyethylene glycol; DSC: differential scanning calorimetry.
To assess whether the formation of a capillary suspension is possible and to identify which state of capillary suspension may form in the ECA, the three-phase contact angle of a PEG/polar liquid mixture including
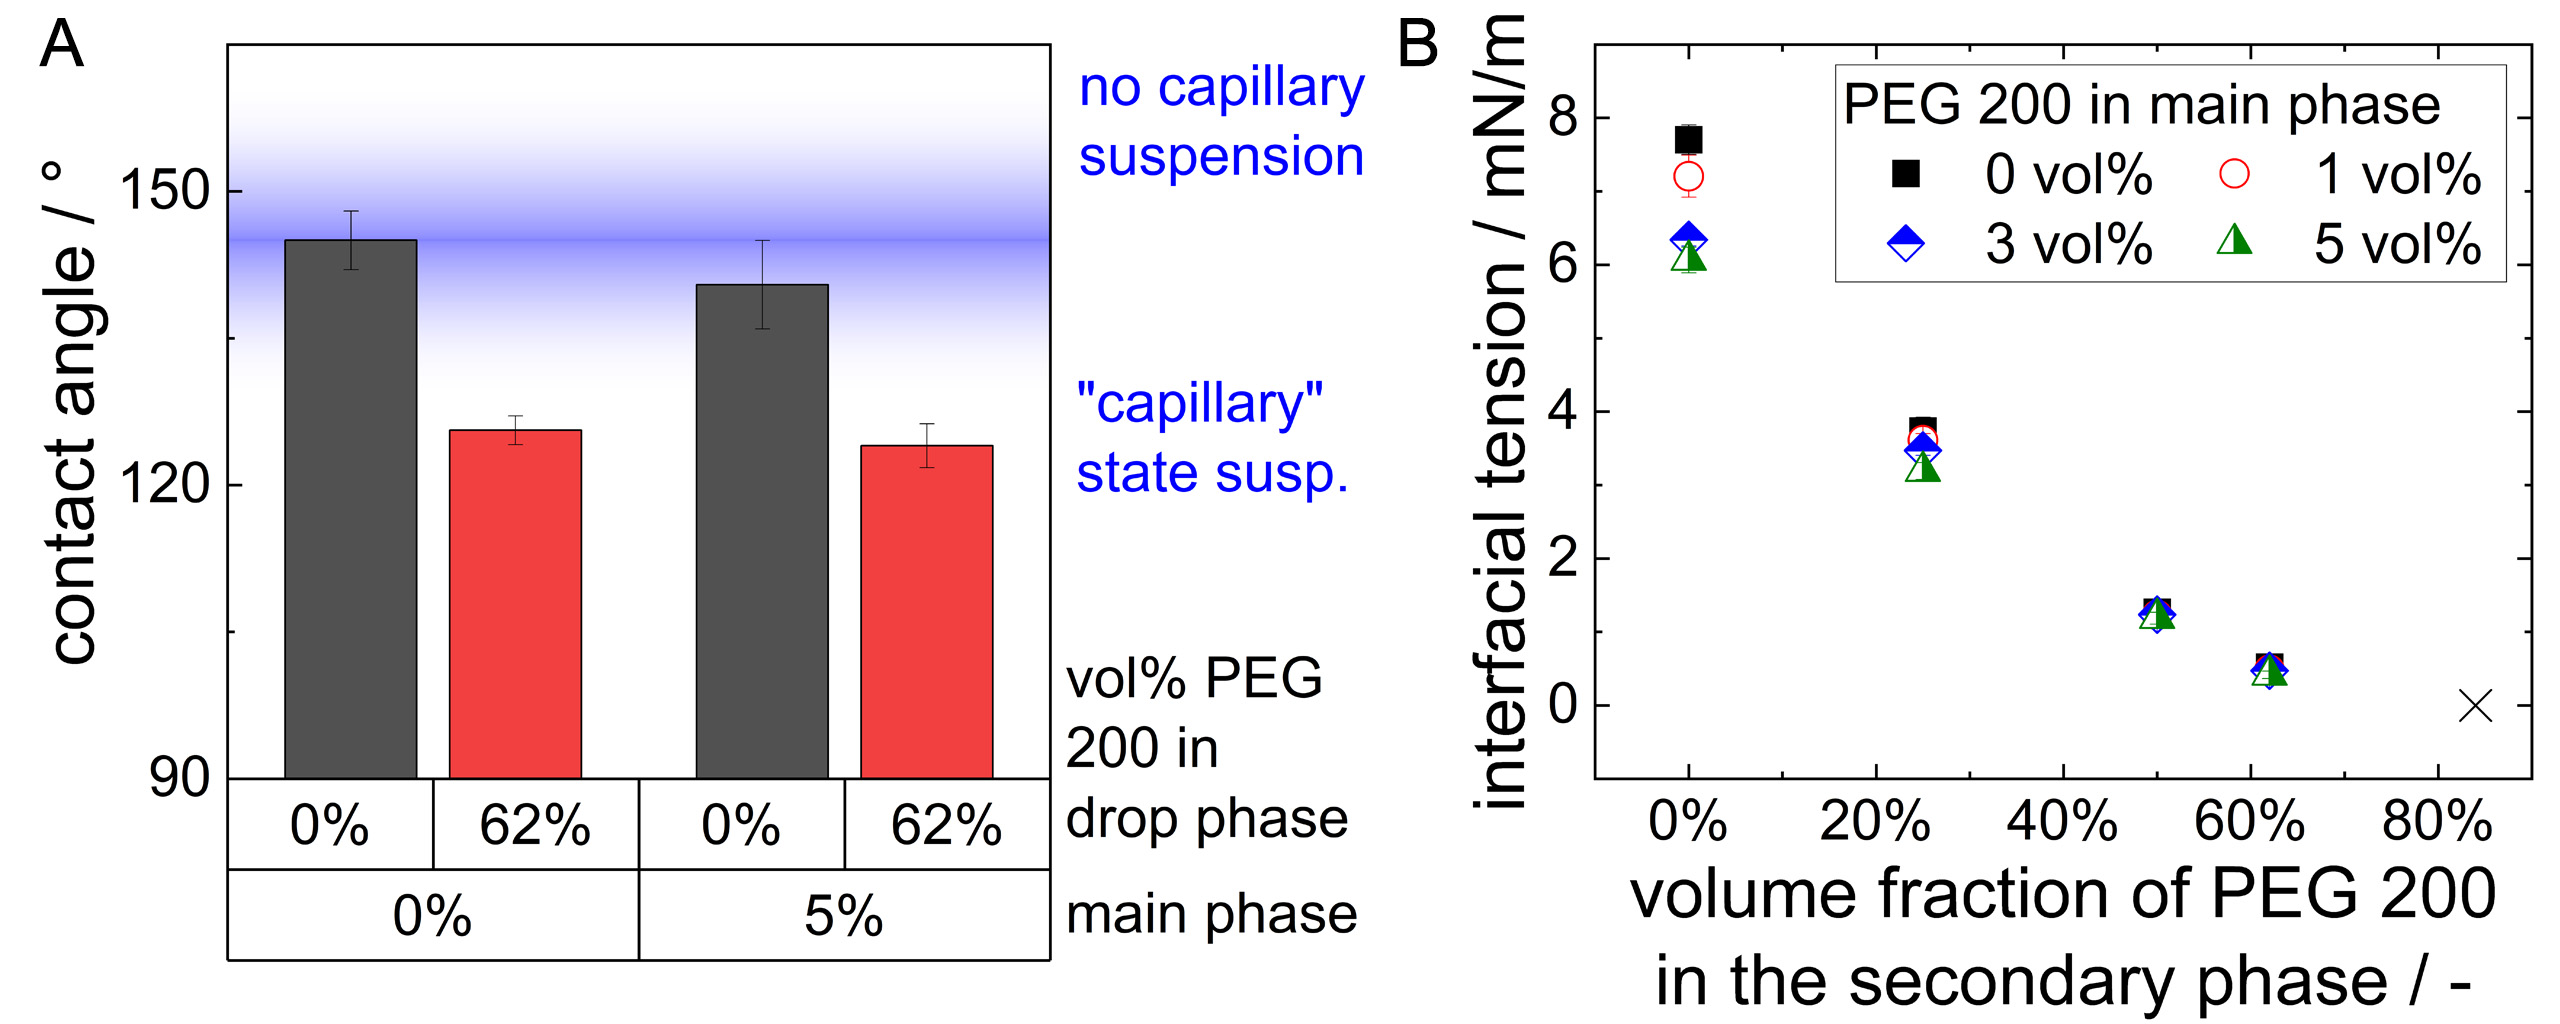
Figure 9. (A) Three-phase contact angle of polar liquid and a PEG/polar liquid mixture including a fraction of 62% PEG 200 on silver flakes when covered by epoxy resin or epoxy resin with 5 vol% PEG 200, the blue shaded area indicates the estimated contact angle range above which no more capillary suspension is formed [25]; (B) interfacial tension between the epoxy resin with varying PEG 200 content between
Figure 9B shows the interfacial tension between different mixtures of polar liquid and PEG 200 and epoxy resin. Obviously, the addition of PEG 200 to the secondary phase leads to a drastic drop in interfacial tension and hence should weaken a capillary suspension network[25]. While a mixture of polar liquid and PEG 200 is needed to reduce the three-phase contact angle and enable the formation of a sample spanning particle network controlled by capillary forces which is characterized by a strong yield stress, the capillary force decreases with decreasing interfacial tension, i.e. increasing PEG 200 fraction in the polar liquid/PEG mixture and accordingly the yield stress decreases [Figure 2A]. Finally, the PEG/polar liquid mixture including 84 vol% PEG 200, as calculated for the ECA containing 5 vol% silver and 10 vol% PEG 200, does not form stable droplets in the epoxy resin (with or without PEG 200), as evidenced by pendant drop experiments. The liquid pulls threads and the phase surface is crumply [Supplementary Figure 6], i.e. there is no finite interfacial tension anymore. This explains the disappearance of a yield stress in the ECA containing 10 vol% PEG 200 [Figure 2A].
CONCLUSION AND OUTLOOK
Electrically conductive adhesives have become highly attractive for applications in the photovoltaic industry. However, their typically high silver content of 20-30 vol% poses both supply and economical challenges. A previous study demonstrated that the application of the capillary suspension concept enables a reduction of the silver content to below 10 vol%. Nevertheless, the selected secondary liquid did not sufficiently stabilize the ECA against sedimentation at filler contents below 5 vol%, although the electrical performance remained promising.
The present study demonstrates that the addition of a small amount of PEG 200 enhances both the yield stress and lap-shear strength of ECAs containing as little as 5 vol% silver, while maintaining low volume and contact resistivity. PEG 200 partially dissolves in both the epoxy resin and the polar liquid acting as a secondary liquid phase. This decreases the three-phase contact angle of the secondary phase against the used silver flakes and thus appears to enable the formation of a strong capillary suspension in the capillary state, even at low filler contents. As a result, the particle distribution transitions from a homogeneous dispersion to a percolating particle network, thereby preventing particle sedimentation. At the same time, the addition of PEG 200 decreases the interfacial tension between the two liquid phases, which possibly weakens the capillary suspension with increasing PEG 200 volume fraction, as reflected by the observed decrease in yield stress. An optimal PEG-to-particle volume ratio of app. 0.5 was identified.
To fully exploit the requirements for solar cell shingling, the silver volume fraction was further reduced to
DECLARATIONS
Acknowledgements
The authors would like to thank Vincent Charlot, Frederic Durand and Simon Malandain of PROTAVIC INTERNATIONAL for their professional support and material supply, Klara Urbschat (Institute for Chemical Technology and Polymer Chemistry, KIT) for conducting the TGA measurements and Iliya Stoev (Institute for Biological and Chemical Systems, KIT) for performing the optical density measurements.
Authors’ contributions
Conceptualization, methodology, investigation, writing - original draft, writing - review & editing, visualization: Kronsbein, M.
Writing - review & editing, supervision, funding acquisition: Willenbacher, N.
Availability of data and materials
The research contains confidential data. Some results of supporting the study are presented in the Supplementary Materials. Other raw data that support the findings of this study are not shared.
AI and AI-assisted tools statement
During the preparation of this manuscript, the AI tool ChatGPT (version GPT-5.3, released 2026-02-05) was used solely for language editing. The tool did not influence the study design, data collection, analysis, interpretation, or the scientific content of the work. All authors take full responsibility for the accuracy, integrity, and final content of the manuscript.
Financial support and sponsorship
This work was funded by the German Federal Ministry of Economic Affairs and Energy (BMWE) as part of the project “Mod30+” with grant number 03EE1160.
Conflicts of interest
All authors declared that there are no conflicts of interest.
Ethical approval and consent to participate
Not applicable.
Consent for publication
Not applicable.
Copyright
© The Author(s) 2026.
Supplementary Materials
REFERENCES
1. Devoto, M. I.; Wienands, K.; Rudolph, D.; et al. Validation of methodology to determine the contact resistivity of ECA-based bonds grounded on end-contact resistance measurements using redundant and modified TLM test structures. Sol. Energy. Mater. Sol. Cells. 2023, 262, 112518.
2. Hartweg, B.; Fisher, K.; Niverty, S.; Chawla, N.; Holman, Z. Analysis of electrically conductive adhesives in shingled solar modules by X-ray imaging techniques. Microelectron. Reliab. 2022, 136, 114627.
3. Son, H.; Lim, H.; Moon, J.; Jun, D.; Ju, B.; Kim, S. Investigating the reliability of electrically conductive adhesives for shingled photovoltaic Si modules. Sol. Energy. Mater. Sol. Cells. 2022, 236, 111403.
4. Devoto, M. I.; Timofte, T.; Halm, A.; Tune, D. Contact resistivity of ECA bonded joints. In proceedings of the 9th workshop on metallization and interconnection for crystalline silicon solar cells, Genk, Belgium; October 5-6, 2020; AIP Publishing LLC, 2021; Vol. 2367, pp 020011.
5. Ronayette, N.; Poncelet, O.; Sousa Nobre, S.; Barthélémy, S.; Bellet, D.; Monna, R. Reduction of silver content in electrically conductive adhesives for low-temperature interconnection of solar cells. Sol. Energy. Mater. Sol. Cells. 2025, 292, 113762.
6. Devoto Acevedo, M. I.; Wells, R.; Großer, S.; et al. The effects of increasing filler loading on the contact resistivity of interconnects based on silver-epoxied conductive adhesives and silver metallization pastes. Prog. Photovolt. Res. Appl. 2024, 33, 143-57.
7. Kayacı, H. U.; Ozdemir, G. U.; Karahalli, M. E.; et al. Waterbased electrically conductive adhesive for PERC-type shingled solar cells. Sol. Energy. Mater. Sol. Cells. 2025, 285, 113525.
8. Zhang, F.; Tang, N.; Jiang, Q.; et al. Progress in polyacrylate‐based electrically conductive adhesives: Featured properties, preparation, applications, and perspectives. Polym. Compos. 2024, 45, 5781-803.
9. Rößler, T.; Von Kutzleben, D.; Klasen, N.; et al. Progress in shingle interconnection based on electrically conductive adhesives at Fraunhofer ISE. In Proceedings of the 10th workshop on metallization and interconnection for crystalline silicon solar cells, Genk, Belgium, November 15-16, 2021; AIP Publishing LLC, 2022; Vol. 2709, pp 020012.
10. Tune, D.; Rößler, T.; Oreski, G.; et al. The sun is rising on conductive adhesives. Photovoltaics. International. 2022. https://solar-media.s3.amazonaws.com/assets/Pubs/PVI%2047/02%20-%20ISCKonstanz-etc-PVI47.pdf (accessed 2026-04-30).
11. Devoto, M. I.; Timofte, T.; Halm, A.; et al. Improved measurement of the contact resistivity of ECA-based joints. In 38th European Photovoltaic Solar Energy Conference and Exhibition, 2021; pp 627-30. https://www.researchgate.net/profile/Maria-Devoto-Acevedo/publication/356222230_Improved_Measurement_of_the_Contact_Resistivity_of_ECA-Based_Joints/links/645de3fa4353ba3b3b5e14ff/Improved-Measurement-of-the-Contact-Resistivity-of-ECA-Based-Joints.pdf (accessed 2026-04-30).
12. Klasen, N.; Weisser, D.; Rößler, T.; Neuhaus, D. H.; Kraft, A. Performance of shingled solar modules under partial shading. Prog. Photovolt. Res. Appl. 2021, 30, 325-38.
13. Kronsbein, M.; Böck, L.; Dyhr, K.; Rößler, T.; Willenbacher, N. Less is more: enabling low-filled electrically conductive adhesives for shingled solar cell interconnection using the capillary suspension concept. Sol. Energy. Mater. Sol. Cells. 2025, 287, 113603.
14. Abdel Latif, N.; Lamsairhri, R.; Rößler, T. Characterization of mechanical strength of shingle joints using die shear tests. SiliconPV. Conf. Proc. 2024, 1.
15. World silver survey 2025. Washington: The silver institute; 2025. https://silverinstitute.org/wp-content/uploads/2025/04/World_Silver_Survey-2025.pdf (accessed 2026-05-08).
16. VDMA. International technology roadmap for photovoltaic (ITRPV) 2023 results. Frankfurt Am Main: 2024. https://www.qualenergia.it/wp-content/uploads/2024/06/ITRPV-15th-Edition-2024-2.pdf (accessed 2026-04-30).
17. Lu, D.; Tong, Q. K.; Wong, C. A study of lubricants on silver flakes for microelectronics conductive adhesives. IEEE. Trans. Comp. Packag. Technol. 1999, 22, 365-71.
18. Fukumoto, S.; Makimoto, K.; Ohta, K.; Nakamura, T.; Matsushima, M.; Fujimoto, K. Change in electrical conductivity of electrically conductive adhesives during curing process. J. Mater. Sci. 2022, 57, 11189-201.
19. Zhang, W.; Liu, J.; Liu, H.; et al. Surface functionalization of micrometer silver flakes for fabricating high-performance electrically conductive adhesives. ACS. Appl. Electron. Mater. 2022, 4, 5387-96.
20. Yi Li, .; Kyoung-sik Moon, .; Wong, C. Electrical property improvement of electrically conductive adhesives through in-situ replacement by short-chain difunctional acids. IEEE. Trans. Comp. Packag. Technol. 2006, 29, 173-8.
21. Tan, F.; Qiao, X.; Chen, J. Removal of chemisorbed lubricant on the surface of silver flakes by chemicals. Appl. Surf. Sci. 2006, 253, 703-7.
22. Liu, H.; Lai, H.; Chen, J.; Zhang, X. Enhancing conductivity of silver-based conductive adhesives via biomass-derived aldehydes: Interfacial modification and network densification. Int. J. Adhes. Adhes. 2026, 147, 104259.
23. Zhang, W.; Wang, J.; Liu, H.; et al. Surface treatment of micron silver flakes with coupling agents for high-performance electrically conductive adhesives. Int. J. Adhes. Adhes. 2023, 122, 103300.
24. Li, C.; Li, Q.; Cheng, L.; et al. Conductivity enhancement of polymer composites using high-temperature short-time treated silver fillers. Compos. Part. A. Appl. Sci. Manuf. 2017, 100, 64-70.
25. Koos, E. Capillary suspensions: particle networks formed through the capillary force. Curr. Opin. Colloid. Interface. Sci. 2014, 19, 575-84.
26. Schramm, G. A practical approach to rheology and rheometry. https://docs.qq.com/pdf/DTmRrcnlDTHJrUWR0?u=f91238d64bf64010bc5ef0de0b065f15 (accessed 2026-05-08).
27. ASTM D1002: 2010. Standard test method for apparent shear strength of single-lap-joint adhesively bonded metal specimens by tension loading (Metal-to- Metal) 2010. https://www.standardsmedia.com/Standard-Test-Method-for-Apparent-Shear-Strength-of-Single-Lap-Joint-Adhesively-Bonded-Metal-Specimens-by-Tension-Loading-Metal-to-Metal-1488795-standard.html (accessed 2026-04-30).
28. DIN EN ISO 20753:2024-03. DIN-Normenausschuss Kunststoffe (FNK), Plastics Standards Committee. https://www.dinmedia.de/de/norm/din-en-iso-20753/376084817 (accessed 2026-05-08).
29. Von Damnitz, L.; Anders, D. A review on the mixing quality of static mixers. ChemEngineering 2025, 9, 128.
30. Kronsbein, M.; Böck, L.; Rößler, T.; Willenbacher, N. Low-filled electrically conductive adhesives based on silver-coated glass and copper particles. Sol. Energy. Mater. Sol. Cells. 2026, 299, 114228.
31. Devoto Acevedo, M. I.; Großer, S.; Wienands, K.; et al. Influence of micro- and macrostructure when determining the contact resistivity of interconnects based on electrically conductive adhesives. Sol. Energy. Mater. Sol. Cells. 2023, 260, 112490.
32. Zhang, W.; Liu, J.; Zhang, L.; et al. The synergistic effect of micron spherical and flaky silver-coated copper for conductive adhesives to achieve high electrical conductivity with low percolation threshold. Int. J. Adhes. Adhes. 2022, 114, 102988.
33. Hamrah, Z. S.; Pourabdoli, M.; Lashgari, V.; Mohammadi, M. D. Effect of time, temperature and composition on the performance of conductive adhesives made of silver-coated copper powder. Int. J. Adhes. Adhes. 2022, 114, 103114.
34. Hamrah, Z. S.; Lashgari, V.; Mohammadi, M. D.; Uner, D.; Pourabdoli, M. Microstructure, resistivity, and shear strength of electrically conductive adhesives made of silver-coated copper powder. Microelectron. Reliab. 2021, 127, 114400.
35. Cheng, N.; Sun, Z.; Yu, X.; Yu, Q.; Zhao, J. Effect of flake silver-plated copper particles on the property enhancement of electrically conductive adhesives. Phys. Chem. Chem. Phys. 2023, 25, 10022-32.
36. Gordon, R.; Orias, R.; Willenbacher, N. Effect of carboxymethyl cellulose on the flow behavior of lithium-ion battery anode slurries and the electrical as well as mechanical properties of corresponding dry layers. J. Mater. Sci. 2020, 55, 15867-81.
37. Jarray, A.; Feichtinger, A.; Scholten, E. Linking intermolecular interactions and rheological behaviour in capillary suspensions. J. Colloid. Interface. Sci. 2022, 627, 415-26.
38. Bossler, F.; Koos, E. Structure of particle networks in capillary suspensions with wetting and nonwetting fluids. Langmuir 2016, 32, 1489-501.
Cite This Article
How to Cite
Download Citation
Export Citation File:
Type of Import
Tips on Downloading Citation
Citation Manager File Format
Type of Import
Direct Import: When the Direct Import option is selected (the default state), a dialogue box will give you the option to Save or Open the downloaded citation data. Choosing Open will either launch your citation manager or give you a choice of applications with which to use the metadata. The Save option saves the file locally for later use.
Indirect Import: When the Indirect Import option is selected, the metadata is displayed and may be copied and pasted as needed.
About This Article
Copyright

Data & Comments
Data
0


Comments
Comments must be written in English. Spam, offensive content, impersonation, and private information will not be permitted. If any comment is reported and identified as inappropriate content by OAE staff, the comment will be removed without notice. If you have any queries or need any help, please contact us at [email protected].