

fig2
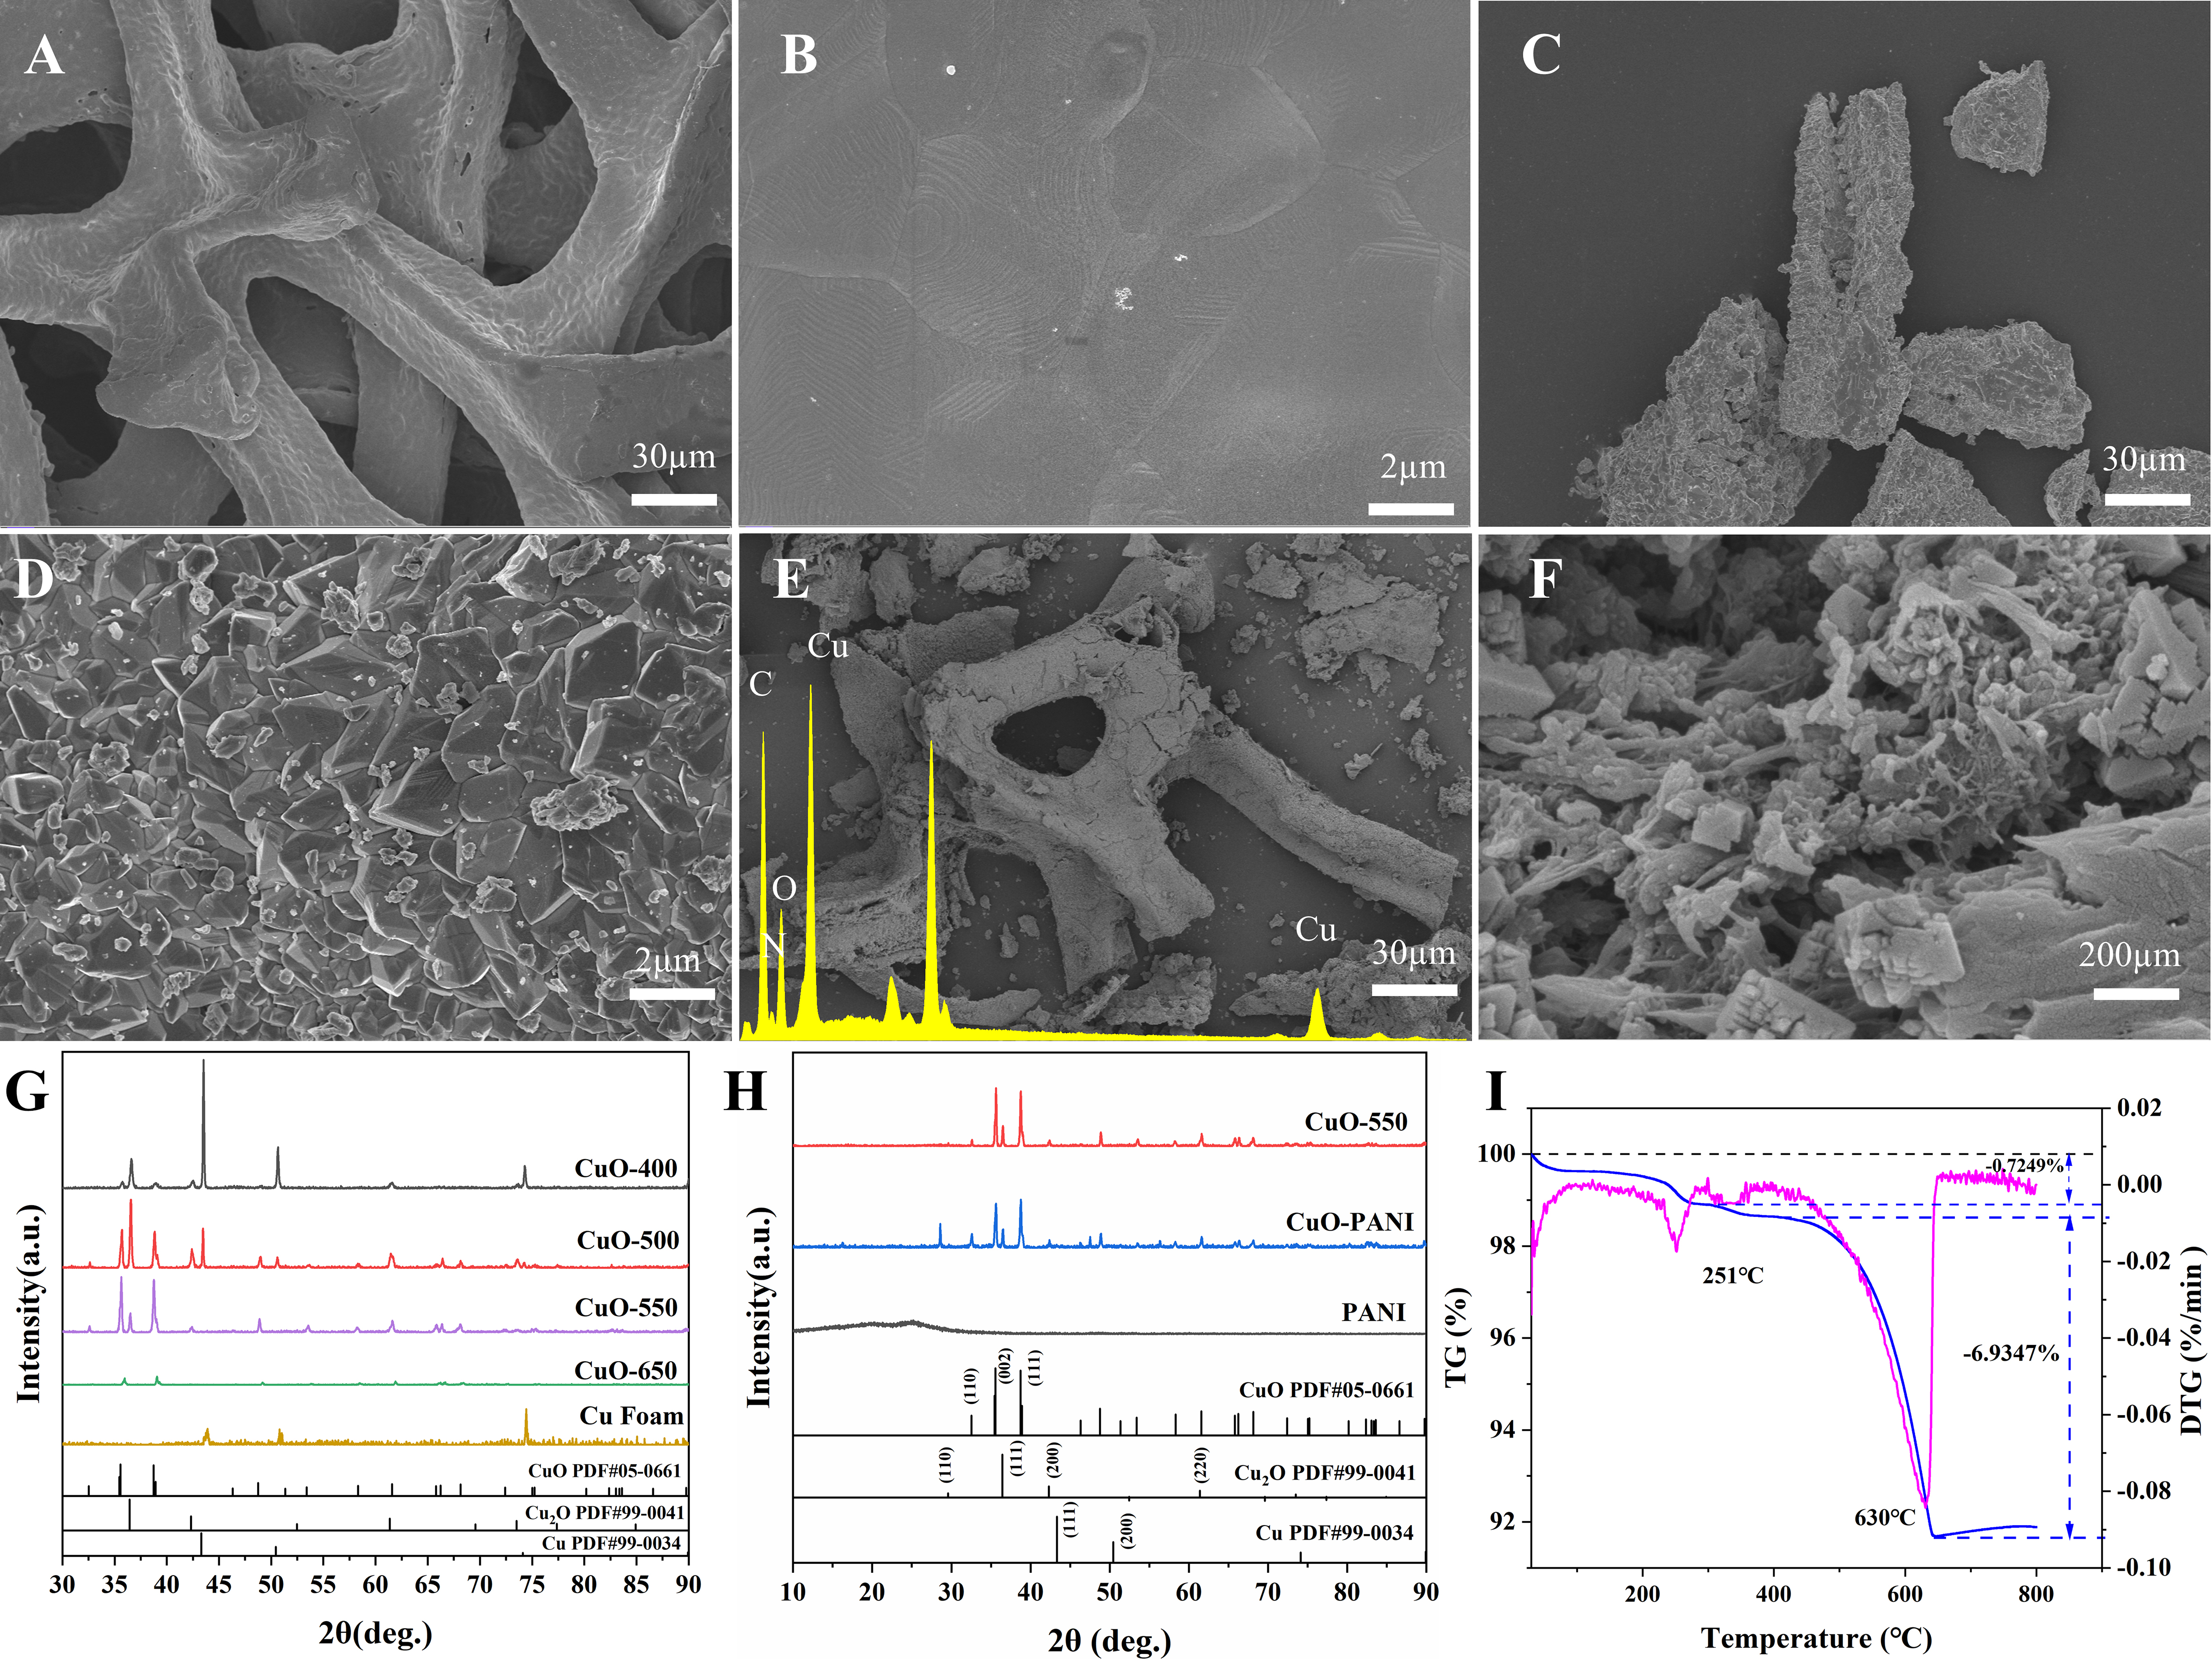
Figure 2. SEM images of (A) and (B) Cu foam, (C) and (D) CuO foam, (E) and (F) CuO-PANI-2; (G) and (H) XRD patterns of the as-synthesized samples; (I) TG analysis curves of CuO-PANI-2. SEM: Scanning electron microscopy; PANI: polyaniline; XRD: X-ray diffraction; TG: thermogravimetric.


