


Advances in carbon footprint on cotton and its textile products from life cycle perspective
 0
0 Abstract
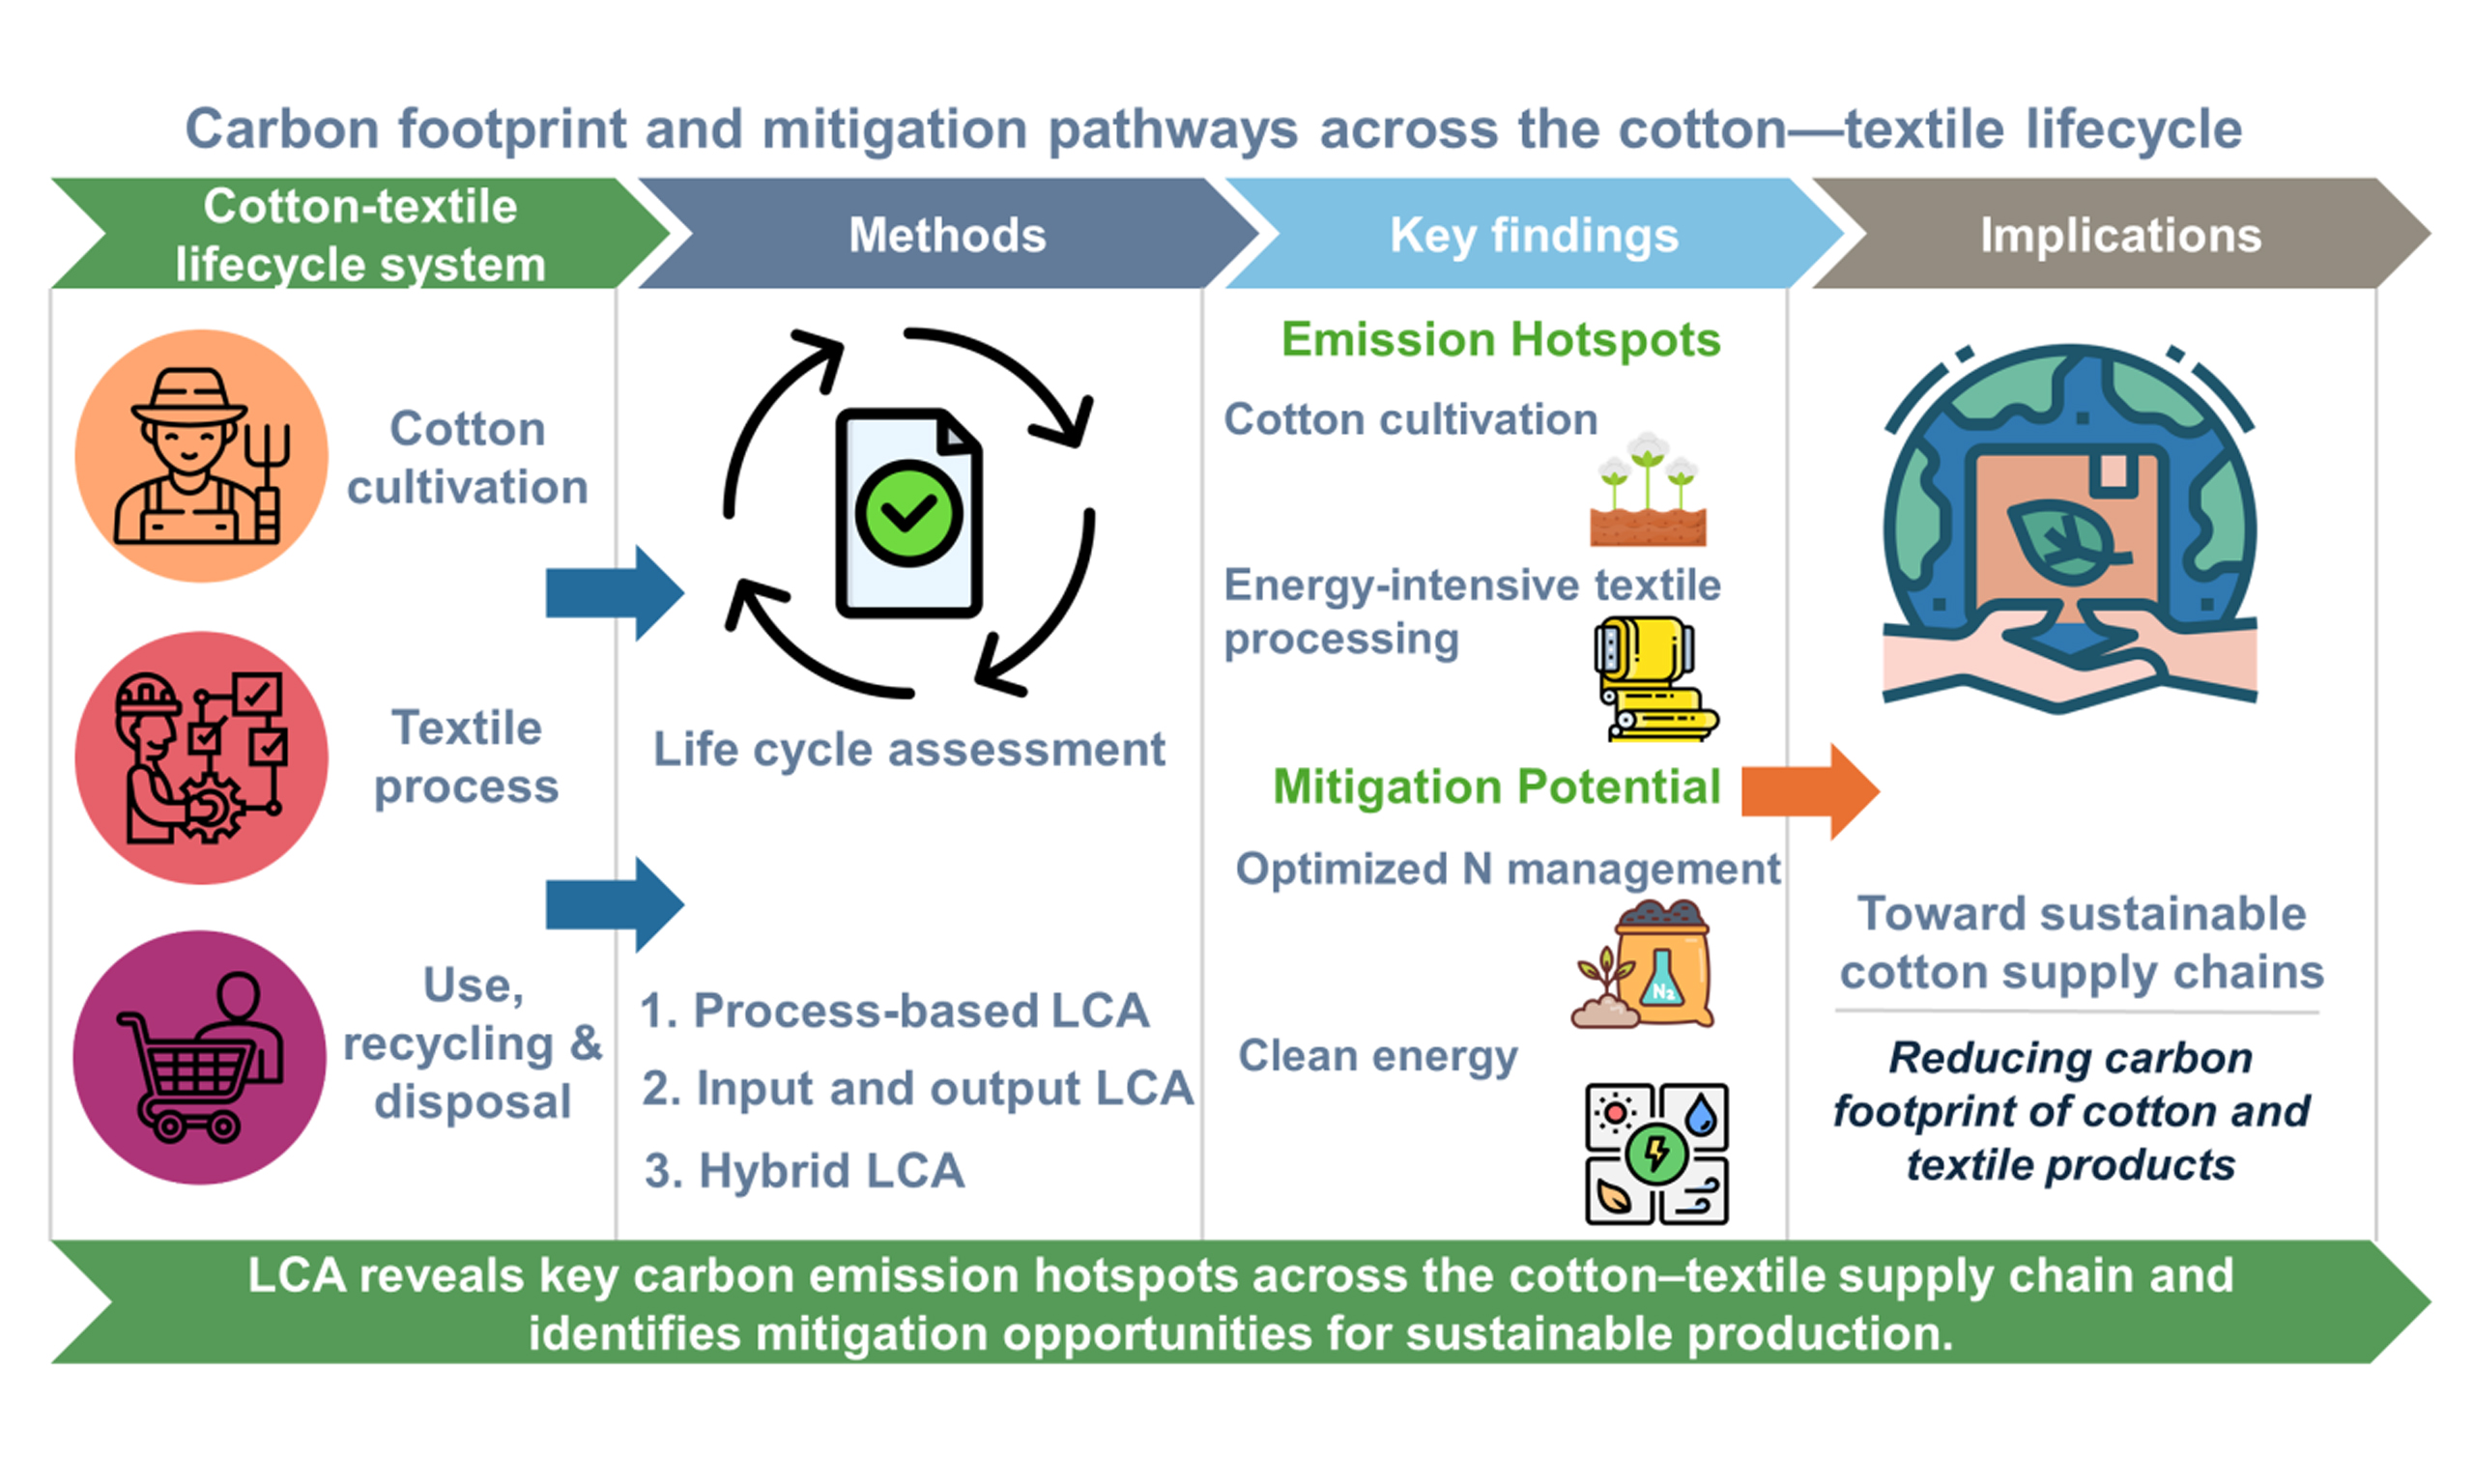
The cotton and textile sector are among the most energy- and emission-intensive global production systems, but studies on the carbon footprint of cotton and textile products remain fragmented. Substantial inconsistencies exist in system boundaries, methodological choices, and data sources, which limit study results comparability and policy setting. Here, we systematically clarify lifecycle system boundaries spanning cotton cultivation, textile manufacturing, product use, and end-of-life management, with particular attention to the treatment of foreground and background emissions, transportation processes, and soil carbon dynamics. Across stages, we identify consistent emission hotspots driven by fertilizer-induced N2O emissions, energy-intensive dyeing and finishing processes, consumer laundering behavior, and recycling pathways. Looking ahead, we highlight key priorities for advancing the field, including the development of harmonized global cotton-textile life cycle assessment databases, the adoption of digital and dynamic carbon accounting tools, the establishment of unified product carbon labeling systems, and the integration of circular economy principles toward low- and zero-carbon textile value chains.
Keywords
INTRODUCTION
The global average annual production of cotton exceeds 25 million tonnes, and it is the most widely used natural fiber in textile manufacturing[1]. Global textile and garment market was valued at approximately USD 920~961 billion in the early 2020s and accounts for around 2% of global GDP, supporting millions of jobs across production, processing, and trade sectors[2]. In addition to its economic benefits, the global cotton and textile industry is also one of the most energy- and emission-intensive sectors, increasing significantly to environmental pressure and climate change[3]. A global estimate indicates that textile production (including natural and synthetic fibers) accounts for approximately 8%~10% of global greenhouse gas emissions (GHGs), exceeding the combined emissions from international aviation and maritime transport[4,5]. As the most widely used natural fiber, the cotton textile supply chain relies heavily on fossil-fuel-based electricity and thermal energy for wet-processing operations, resulting in a relatively high carbon footprint[1]. As nations strengthen climate governance in response to the Paris Agreement, textile value chains have drawn increasing attention due to their multi-region cooperative production and high emission intensity[6]. Many countries and regions have introduced relevant policies, including but not limited Carbon Border Adjustment Mechanism (CBAM), extended producer responsibility schemes, and national carbon-neutrality commitments, which have further emphasized the strategic importance of accurately quantifying and reducing emissions in textile value chain[7]. In this context, carbon footprint accounting has become a key requirement for global trade, low-carbon supply-chain transformation, and compliance with emerging climate regulations. Understanding and accounting for emissions from the textile industry are therefore essential for developing effective mitigation strategies and promoting a transition toward more sustainable production and consumption.
As one of the most widely used natural fibers, cotton cultivation and textile manufacturing in general are considered an energy-intensive chain due to substantial background and foreground emissions. In general, cotton cultivation needs various agricultural inputs, mainly including fertilizers, pesticides, irrigation water, and diesel for field operations[8,9]. To be specific, nitrogen (N) fertilizers are the most important contributing factors to emissions, its background emissions primarily originate from production, processing and transportation processes, while foreground include field direct and indirect emissions (IPCC, 2021). Field direct emissions mainly refer to soil nitrous oxide (N2O) emissions, while indirect emissions refer to soil ammonia (NH3) volatilization, nitrate N (NO3-) leaching and run off[10]. For phosphatic and potash fertilizer, pesticides, seeds and diesel oil, their emissions are generated during production, manufacturing, and transportation. It is worth noting that emissions from electricity for irrigation, labor and diesel combustion are mainly generated in fields[11]. In addition, due to differences in crop straw processing methods, the approach to returning straw to the field also consider for both direct and indirect emissions from the straw[12-14]. In arid and semi-arid regions (e.g., Central Asia, India, and western China), energy-intensive irrigation practices (e.g., high-frequency irrigation) further aggravate the carbon emission of cotton cultivation[15]. After cotton harvesting, the cotton ginning, spinning, weaving, dyeing, finishing, garment assembly and transportation, all of which consume large amounts of electricity and heat, leading to high emissions. Wet-processing operations rely heavily on steam generated from fossil fuels, while mechanical processes such as spinning and weaving are electricity-dependent and labor intensive[16]. Besides, the complexity, length, and geographical dispersion of textile value chains often lead to inefficient energy use and substantial transportation-related emissions[17]. As a result, cotton-to-textile production exhibits a cumulative emissions profile that is difficult to manage without systematic lifecycle assessment. Addressing the high-emission characteristics of these stages is crucial to achieving carbon reduction targets within the textile sector and enhancing the sustainability performance of cotton-based products.
Global climate policy frameworks have increasingly shaped the development trajectory of the textile sector, elevating the urgency of reliable carbon footprint accounting for cotton and textile products[18]. In parallel, the European Union CBAM introduces carbon-based trade requirements that directly affect emissions-intensive products and are expected to expand to textile goods soon[19]. China, as the world's largest producer, consumer, and exporter of cotton and textile, its emission intensity and total amount both rank among the top nations globally[20]. Due to China’s "dual-carbon" goals, peaking carbon emissions before 2030 and achieving carbon neutrality by 2060, further accelerate domestic efforts to decarbonize high-impact industries, including cotton cultivation and textile processing[20]. Although relevant policies have been introduced, studies on textile carbon footprints remain limited. Most studies focus on isolated stages such as cotton farming, spinning, or dyeing, resulting in incomplete assessments that overlook cross-stage interactions and cumulative impacts[21]. Moreover, inconsistent system boundaries, varying data sources, and methodological differences (e.g., soil carbon calculation or not) hinder comparability across studies. Therefore, this lack of systematic and standardized evaluation limits the effectiveness of policy design and industrial decision-making.
Currently, environmental assessment encompasses various methodologies, including but not limited Life cycle assessment (LCA), regulatory impact assessments, and system-oriented approaches such as ecosystem service evaluation and environmentally extended input and output analysis, which provide a comprehensive framework for quantifying environmental impacts across scales[22]. Compared with other methods, LCA has become a main evaluation method for quantifying the carbon footprint of products due to its systematic, standardized, and science-based approach[23]. LCA is a bottom-up method that evaluates environmental burdens across all relevant stages of a product’s life-from raw material extraction and cultivation to manufacturing, distribution, use, and end-of-life treatment. While LCA-based carbon footprint is an index used to compare the total amount of greenhouse gases that an activity, product, company or country adds to the atmosphere. Carbon footprints are usually reported in tonnes of emissions (CO2-equivalent) per unit of comparison. Such units can be for example tonnes CO2-eq per year, per kilogram of cotton, per piece of clothing and so forth[24]. This cradle-to-grave perspective is valuable for cotton and textile products, because their emissions are distributed across multiple processes spanning agriculture, industry, logistics, and consumer behavior. As carbon disclosure and CBAM policies gain prominence, LCA-based carbon footprint accounting enables companies and governments to benchmark emissions, identify hotspots, and design targeted mitigation strategies[25]. The number of LCA studies has been increasing year by year, with China, the United States, and India accounting for the largest share [Figure 1]. Furthermore, LCA facilitates comparability among products by providing transparent and verifiable datasets, supporting carbon-labeling, green procurement, and supply chain decarbonization[26]. As climate change intensifies and the international carbon market expands, LCA is evolving toward more standard and more accurate carbon footprint, consolidating its role as the dominant tool for guiding low-carbon transformation in the textile sector.
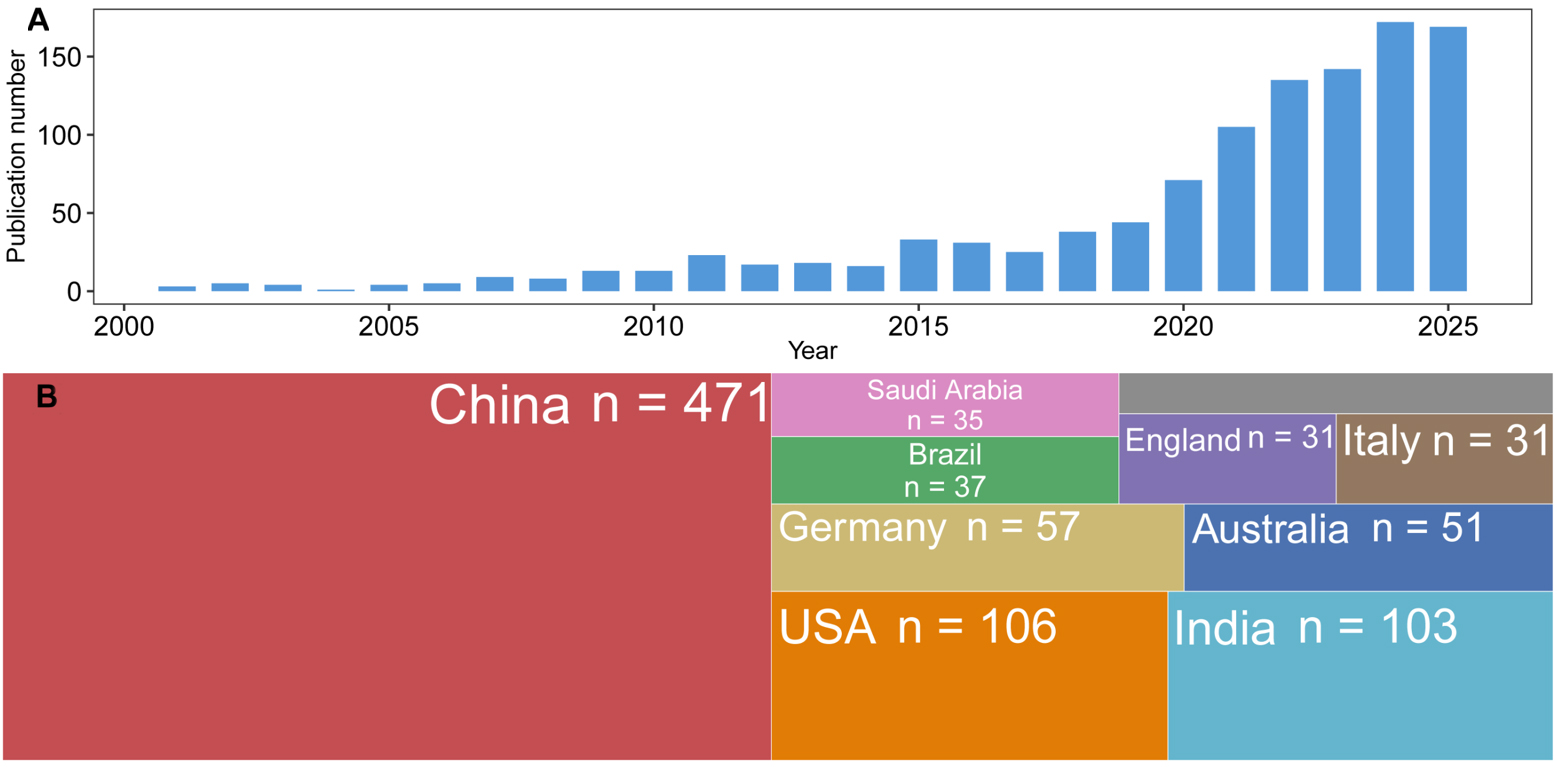
Figure 1. Publication numbers of different years (A) and regions (B) of cotton and textile carbon footprints. Data source: Web of Science core database (https://webofscience.clarivate.cn/wos/woscc/smart-search); Keywords: TS = ("Cotton" OR "Textile" and "Carbon footprint*" OR "CF"). The figure was created by R software (version 4.1.0) and did not involve any copyright issues.
This study aims to provide a comprehensive and systematic review of carbon footprint accounting for cotton and textile products by integrating methodological, institutional, and empirical perspectives. Specifically, the research synthesizes the major LCA approaches applied in the textile domain, examines the international and national standard systems (including ISO 14067, the GHG Protocol, PAS 2050, EU CBAM requirements, and China GB/T 24067-2024), and evaluates their implications for boundary setting, data quality, and comparability. Furthermore, the study also analyzes carbon emission characteristics across key lifecycle stages, from cotton cultivation and textile manufacturing to product use, recycling, and end-of-life management, and identifies dominant emission hotspots, and finally clarifies current knowledge gaps and practical limitations. Building on these insights, this study proposes future optimization pathways focused on improving LCA database quality, enhancing data standardization, advancing digital carbon accounting technologies, and promoting circular and cleaner textile systems. Overall, the research contributes a holistic analytical framework that supports policymakers, industry stakeholders, and researchers in advancing scientifically robust, transparent, and actionable carbon footprint assessments for cotton and textile products.
METHODS COMPARING OF LCA BASED CARBON FOOTPRINT
LCA methodologies applied to cotton and textile products generally fall into three mainstream categories: process-based LCA, input and output LCA, and hybrid LCA. Each approach has distinct analytical strengths and limitations, due to differences in data requirements, system boundaries, and research objectives[27].
Process-based life cycle assessment (P-LCA) is grounded in bottom-up engineering modeling and follows the ISO 14040/14044 framework. It quantifies emissions by tracing material and energy flows along specific production processes. In cotton and textile systems, P-LCA is frequently combined with farm production records, spinning process data, or dyeing energy inventories to estimate stage-level contributions[28]. It provides high-resolution, product-specific emission estimates and can be used in enterprise-level assessments of cotton cultivation, spinning, dyeing, and garment manufacturing. However, its major limitation lies in data intensity, because comprehensive process data are often difficult and costly to obtain, leading to potential truncation errors when upstream or indirect processes are omitted[29].
Input-output LCA is based on economic input-output tables and Leontief inverse matrices, capturing intersectoral monetary flows across the entire economy. In textile research, IO-LCA typically integrates sectoral production value, output volume, and energy statistics to estimate embodied emissions at national or regional scales. As a top-down approach, it captures indirect and economy-wide impacts that are often overlooked in process studies. This makes IO-LCA particularly suitable for macro-level policy evaluation, international trade analysis, and scenarios involving complex supply chains[30]. Nevertheless, its sector-level aggregation results in low granularity and reduced accuracy for product-level studies, limiting its application to detailed textile process modeling[31].
Hybrid LCA combines the process resolution of P-LCA with the system completeness of IO-LCA. By embedding process-level data within an economic input-output framework, hybrid approaches reduce truncation error while preserving analytical detail[32]. This approach minimizes the truncation issues of P-LCA while overcoming the aggregation constraints of IO-LCA, making it well suited for multi-stage, globally dispersed textile systems. Despite being methodologically complex and computationally demanding, hybrid LCA offers the most comprehensive framework for capturing both micro-level process emissions and macro-level spillover effects.
GLOBAL CARBON POLICY AND STANDARD SYSTEM
At past two decades, global many countries and organizations have issued international and national standards to guide product-level carbon footprint accounting, which provide methodological consistency at country and region level to support global climate governance[33] [Table 1]. Among international frameworks, ISO 14067 serves as the most influential standard for quantifying the carbon footprint of products, specifying system boundary definition, data quality, emission factor selection, and reporting rules (ISO 14067). Additionally, World Resources Institute and World Business Council for Sustainable Development developed the GHG Protocol Product Standard offers flexible but detailed guidelines that emphasize transparency and stakeholder engagement, making it widely adopted by global brands and supply chain actors[34]. The United Kingdom published PAS 2050 provides one of the earliest standardized approaches for lifecycle GHG quantification, and it remains influential in consumer goods sectors (PAS 2050). Under the circumstances, the EU CBAM introduces carbon-based trade regulations, requiring exporters to provide verified, standardized carbon intensity data that aligns with EU methodologies. Although textiles are not included in CBAM’s initial scope, ongoing discussions indicate likely future expansion to emission-intensive textile products. In China, the release of the GB/T 24067-2024 Product Carbon Footprint Standard marks an important step toward establishing a unified national system[35]. The standard aligns with ISO principles while adapting to China’s industrial structure, database conditions, and verification systems, thereby improving comparability across domestic studies and facilitating international communication. In addition, sector-specific standards for cotton lint, cotton yarn, and dyed fabrics are being developed or have recently been released. Across these standards, system boundaries typically follow two dominant scopes: cradle-to-gate, covering emissions from raw material extraction to product manufacturing, and cradle-to-grave, which additionally includes product use and end-of-life phases[36]. Data requirements vary but generally emphasize temporal relevance, geographic representativeness, and methodological transparency. For cotton and textile products, these standards offer clear implications. Harmonized carbon accounting enables enterprises to meet export compliance requirements, particularly for markets with strict carbon disclosure obligations. It also supports the development of carbon labeling systems, helping brands communicate environmental performance to consumers and strengthening supply chain decarbonization efforts. As global carbon policies tighten, alignment with international standards will become increasingly essential for the competitiveness and sustainability of cotton-based textile products.
Carbon policies/standards for cotton textiles that have been published in different regions or sectors
| Policy & standard | Type | Applicable product stage | Boundary type | Relevance to cotton textiles |
| EU CBAM | Trade policy | Exported textile products | Cradle-to-gate | Affects disclosure of embodied emissions in exported yarn/fabrics |
| ISO 14067 | International standard | All product forms | Cradle-to-gate/grave | Methodological basis for CF quantification |
| GHG Protocol Product Standard | International guideline | Product-level | Flexible | Widely adopted by multinational brands |
| PAS 2050 | UK standard | Consumer goods | Cradle-to-grave | Early product carbon footprint framework |
| GB/T 24067 | China national standard | General product CF | Cradle-to-gate | Foundational national framework |
| Cotton lint CF standard (China) | Sector-specific | Lint | Agricultural boundary | Defines farm-level accounting |
| Cotton yarn CF standard (China) | Sector-specific | Yarn | Gate-to-gate | Focus on spinning electricity |
| Dyed fabric CF standard (China) | Sector-specific | Fabric | Gate-to-gate | Emphasizes dyeing/finishing emissions |
LIFE CYCLE CARBON FOOTPRINT ACCOUNTING FRAMEWORK FOR COTTON AND TEXTILE PRODUCTS
System boundaries and function unit definition
Defining system boundaries is essential in lifecycle carbon footprint accounting, as it determines the processes and emission sources included in the assessment. For cotton and textile products, the lifecycle is typically divided into agricultural production, industrial processing, product use, and end-of-life management [Figure 2].
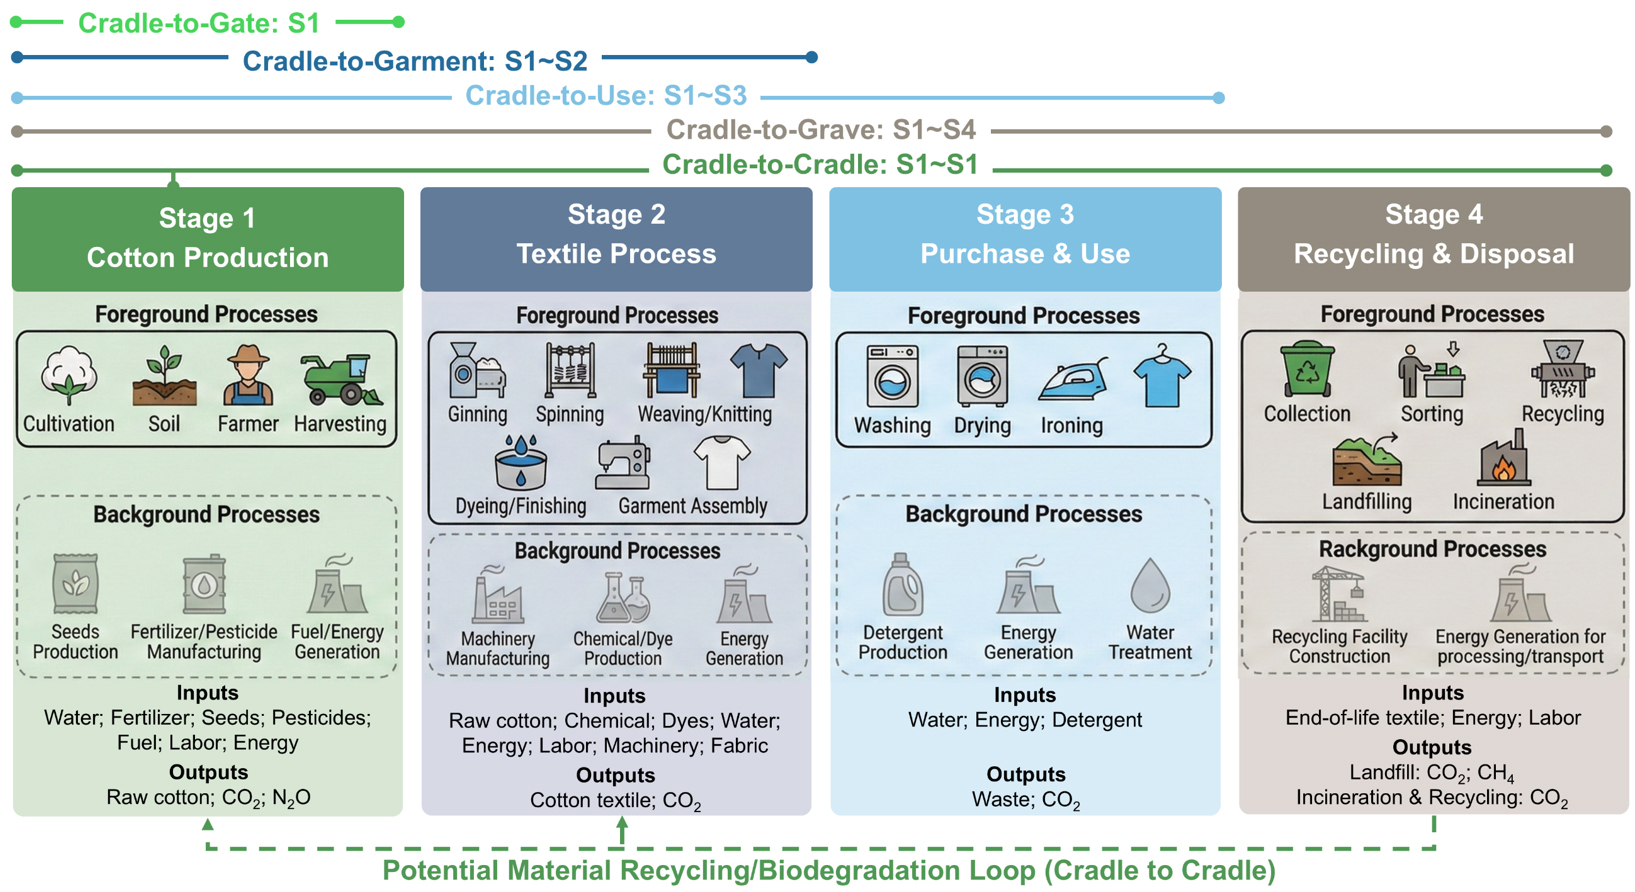
Figure 2. Different carbon footprint system boundaries of cotton and textile products according to study aims and contents. The figure was created by Microsoft PowerPoint 2019 and did not involve any copyright issues.
Cotton production
In field cotton production, the most used system boundary is the "cradle-to-gate", the system’s background emissions are defined as those arising from the manufacture and transportation of crop inputs (e.g., fertilizers and pesticides), and foreground emission covers all activities from seed sowing to seed cotton harvesting, including tillage, fertilizer and pesticide application, irrigation, and other field operations[37,38]. To be specific, foreground emission includes direct and indirect emission, in which direct emission including soil N2O from N fertilization, diesel combustion for machinery, on-farm electricity (e.g., for irrigation pumps), and on-site fuel use. These are calculated using farm-level activity data (kg N applied, litres diesel, kWh electricity) combined with process- or country-specific emission factors and empirical models from N to N2O conversion (IPCC default equations or country-calibrated emission factors). Background emissions are also known as upstream emissions, which are from production of fertilizers, pesticides, seeds, and agrochemicals (typically occur at manufacturing facilities outside the farm). These are calculated by multiplying applied quantities by emission factors (e.g., Ecoinvent, CLCP or national LCI for fertilizer production). Indirect N losses (volatilization, leaching) are also estimated using IPCC factors and accounted as indirect emissions where applicable.
However, whether to include soil carbon sequestration depends on the goal and scope of the study as well as data availability. Some LCA studies incorporate soil organic carbon (SOC) changes to capture net carbon gains or losses resulting from agricultural practices[39]. Yet many standardized protocols treat soil carbon sequestration as optional, because these agreements or documents often involve large-scale carbon footprint accounting, monitoring changes in SOC across entire regions or countries is prohibitively costly and impractical[40,41]. It is worth noting that ISO 14067 and PAS 2050 permit inclusion of soil carbon sequestration only when robust, long-term, and geographically representative data are available. In cotton systems, SOC changes may be included under specific conditions-such as reduced tillage, residue retention, or organic amendments-but are often excluded when reliable field data are not accessible. Thus, soil N2O emissions are routinely included, whereas soil carbon sequestration is included only when justified by specific conditions.
Textile processing
This boundary includes cotton ginning, spinning, weaving/knitting, dyeing and finishing, and garment manufacturing. Energy use (electricity, steam, fuels) and process chemicals are key contributors in this stage, and inter-factory transportation may be included depending on boundary definitions. In textile processing stage, foreground emissions measured at the facility (kWh electricity, GJ thermal/steam, m3 gas, litres fuel oil). Process-specific direct emissions (e.g., on-site combustion, wastewater treatment plant emissions) are included as foreground when measured. Dyeing/finishing process emissions (e.g., chemical decomposition, on-site wastewater gas emissions) are estimated also according to multiplying applicated quantities by emission factors. Site meters, fuel invoices and process logs are primary sources for activity data. Background emissions including upstream manufacture of auxiliary inputs (dyes, auxiliaries, packing materials), embodied emissions of purchased machinery (often treated as background or capital goods allocation), and grid electricity mix (if only grid-average data is used). These are modelled using LCI datasets (Ecoinvent, national LCI or sector datasets) or via IO/MRIO where supply-chain breadth is required. However, many studies also do not include background emission due to limited data acquisition[21,27].
Consumer use and end-of-life management
The textile uses phase covers washing, drying, ironing, and garment lifetime. Foreground emissions mainly refer to emissions from garment use and care, which includes laundering frequency, washing temperature, drying practice, and ironing[42]. Background emissions including upstream production of consumer appliances, municipal waste treatment infrastructure, and average waste management emissions are modelled via LCI databases. End-of-life processes include reuse, mechanical or chemical recycling, landfilling, and incineration. For end-of-life, on-site or municipal treatment (recycling, landfill, incineration with/without energy recovery) may be modelled as foreground when site-specific data for collection and treatment are available (e.g., company take-back schemes)[43]. If recycling, background substitution effects (i.e., avoided virgin production) are often estimated using displacement factors from databases or literature.
Carbon emissions accounting
The carbon footprint of cotton and textile products is typically quantified using activity-based emission accounting, which integrates both energy consumption and material consumption within the system boundary. The general calculation framework follows[44]:
where A represents the activity data - such as electricity use, fertilizer application, fuel consumption, or chemical inputs, and EF denotes the corresponding emission factor derived from databases. This dual-accounting approach ensures that both energy-related emissions (e.g., electricity, steam, diesel, natural gas) and material-related emissions (e.g., fertilizers, pesticides, textile chemicals) are incorporated into the assessment.
Reported carbon footprints of cotton textile products vary widely, typically ranging from 15 to 50 kg CO2-eq per kg textile, depending on system boundaries, energy structure, and use-phase assumptions[1,20,26]. For a cotton T-shirt, cradle-to-grave carbon footprints are commonly reported in the range of 2~7 kg CO2-eq per item[21]. Across the lifecycle, the major emission sources include agricultural inputs, particularly N fertilizers, pesticides, irrigation energy, and diesel used for field operations. Soil N2O emissions linked to N applications are a mandatory component in dryland carbon accounting. Industrial energy consumption, such as electricity in spinning and weaving, and steam or thermal energy in dyeing and finishing. These processes often represent the most emission-intensive stages. Transportation emissions, arising from the movement of cotton, semi-finished yarn or fabric, and finished garments along geographically dispersed supply chains. Wastewater treatment, especially during dyeing and finishing, contributes both direct process emissions and indirect energy-related emissions.
Data and emission factors
Accurate carbon footprint accounting relies heavily on the selection of appropriate emission factors and high-quality onsite data. Emission factors for cotton and textile product LCAs can originate from multiple levels, each with varying levels of specificity and reliability. International databases, such as Ecoinvent and the IPCC emission factor guidelines, offer broad coverage and are widely used for cross-country assessments[45]. National databases, including the CHINA-LCA database or U.S. LCI database, provide country-specific energy structures and industrial processes, improving geographical relevance. Industry-level datasets, such as those developed by Cotton Incorporated or sectoral LCI datasets, incorporate process-specific information relevant to cotton cultivation, spinning, dyeing, and finishing. In some cases, enterprise-level datasets-based on factory energy use, chemical inventories, or wastewater treatment records-offer the highest precision but may lack generalizability. Therefore, different databases adopt distinct assumptions regarding energy structures, industrial technologies, system boundaries, and allocation rules. As a result, identical activity data (e.g., 1 kg of nitrogen fertilizer, 1 kWh of electricity, or 1 kg of dye) may be associated with substantially different emission factors across databases[46,47]. For instance, the emission factor for electricity in Ecoinvent typically reflects a European grid mix with a higher share of renewables, whereas national databases often reflect coal-dominated electricity systems. These discrepancies can lead to variations of 20%~50% or more in the quantified carbon footprints, even when the foreground process data remain the same[48]. Appropriate selection requires balancing specificity, availability, and comparability depending on the study’s goals[49]. Despite the differences of system boundary and object, the foreground calculations should use site-specific EFs where possible; background calculations should rely on reputable LCI databases (e.g., Ecoinvent) or national databases (e.g., CHINA-LCA) to preserve comparability.
What’s more, ensuring data quality is crucial for robust LCA outcomes. Standard LCA guidelines emphasize three key dimensions of quality control: temporal representativeness (data should reflect the relevant period and technology update cycle), geographical representativeness (data must match regional energy structures, climate conditions, and agricultural practices), and technological representativeness (data must correspond to the specific process configurations and machinery used)[50].
Given the inherent variability in agricultural systems and textile production processes, uncertainty analysis is essential for interpreting results. Monte Carlo simulation is commonly used to evaluate the propagation of uncertainties by repeatedly sampling probability distributions for activity data and emission factors. Sensitivity analysis identifies key parameters that most influence model outcomes, helping researchers prioritize data collection efforts and assess the robustness of conclusions. Together, these methods enhance credibility, reduce bias, and support evidence-based decision-making in carbon footprint accounting for cotton and textile products[51].
Despite the availability of multiple international and national databases, current carbon footprint studies of cotton and textile products still face significant limitations in terms of data quality and regional representativeness. In particular, there is a lack of high-quality, spatially explicit LCA databases that accurately reflect agricultural practices, electricity structures, and industrial technologies in different production regions. Many studies rely on default or foreign datasets that may not adequately capture local production conditions, thereby introducing systematic bias and limiting cross-study comparability. These data gaps constitute a major constraint for robust and policy-relevant carbon accounting in the cotton-textile supply chain.
EMISSION HOTPOTS AND OPPORTUNITIES FOR MITIGATION
Across most studies, the relative contribution of lifecycle stages typically follows the order: textile manufacturing (40%~60%) > cotton cultivation (20%~40%) > use phase (10%~30%) > end-of-life (< 10%), although substantial variation exists among regions and product types[2,27,52].
Cotton cultivation
Agriculture production represents a major contributor to the total carbon footprint of cotton and textile products due to its intensive use of fertilizer, energy, and water resources[53]. Within the agricultural stage, nitrogen fertilizer production and fertilizer-induced soil N2O emissions often account for 50%~80% of total cultivation-related GHG emissions, making nitrogen management the dominant mitigation lever[11]. Pesticide production, although typically contributing a smaller share, adds additional upstream emissions to the overall footprint. Irrigation energy is another critical factor, especially in water-scarce regions where groundwater pumping or long-distance water transport requires significant electricity or diesel use[54]. Field operations-such as tillage, sowing, and harvesting-further contribute to emissions through diesel combustion in agricultural machinery[39]. Among these sources, soil N2O emissions are particularly important because they are directly influenced by N fertilization rates, soil moisture, and climatic conditions.
At the same time, there are substantial opportunities for emission reduction through improved agricultural practices. Field studies have reported that optimized nitrogen management and precision fertilization can reduce N2O emissions by approximately 15%~35%, depending on soil type and climate conditions[55]. Drip irrigation systems in arid cotton-producing regions have also been shown to reduce energy consumption for pumping while improving nitrogen use efficiency, thereby lowering the overall carbon footprint per unit yield[56]. In some cases, integrated water-fertilizer management has reduced agricultural-stage emissions by more than 20% compared to conventional broadcasting practices[1] [Figure 3]. The adoption of green manure and organic soil amendments can partially substitute synthetic fertilizers while improving soil health[57,58]. Additionally, mechanical electrification, including electric tractors and solar-powered irrigation pumps, offers promising pathways for reducing reliance on diesel fuel and transitioning toward lower-carbon agricultural systems[59]. Collectively, these strategies highlight the substantial mitigation potential within cotton cultivation and the importance of integrating sustainable farming practices into textile supply chain decarbonization efforts.
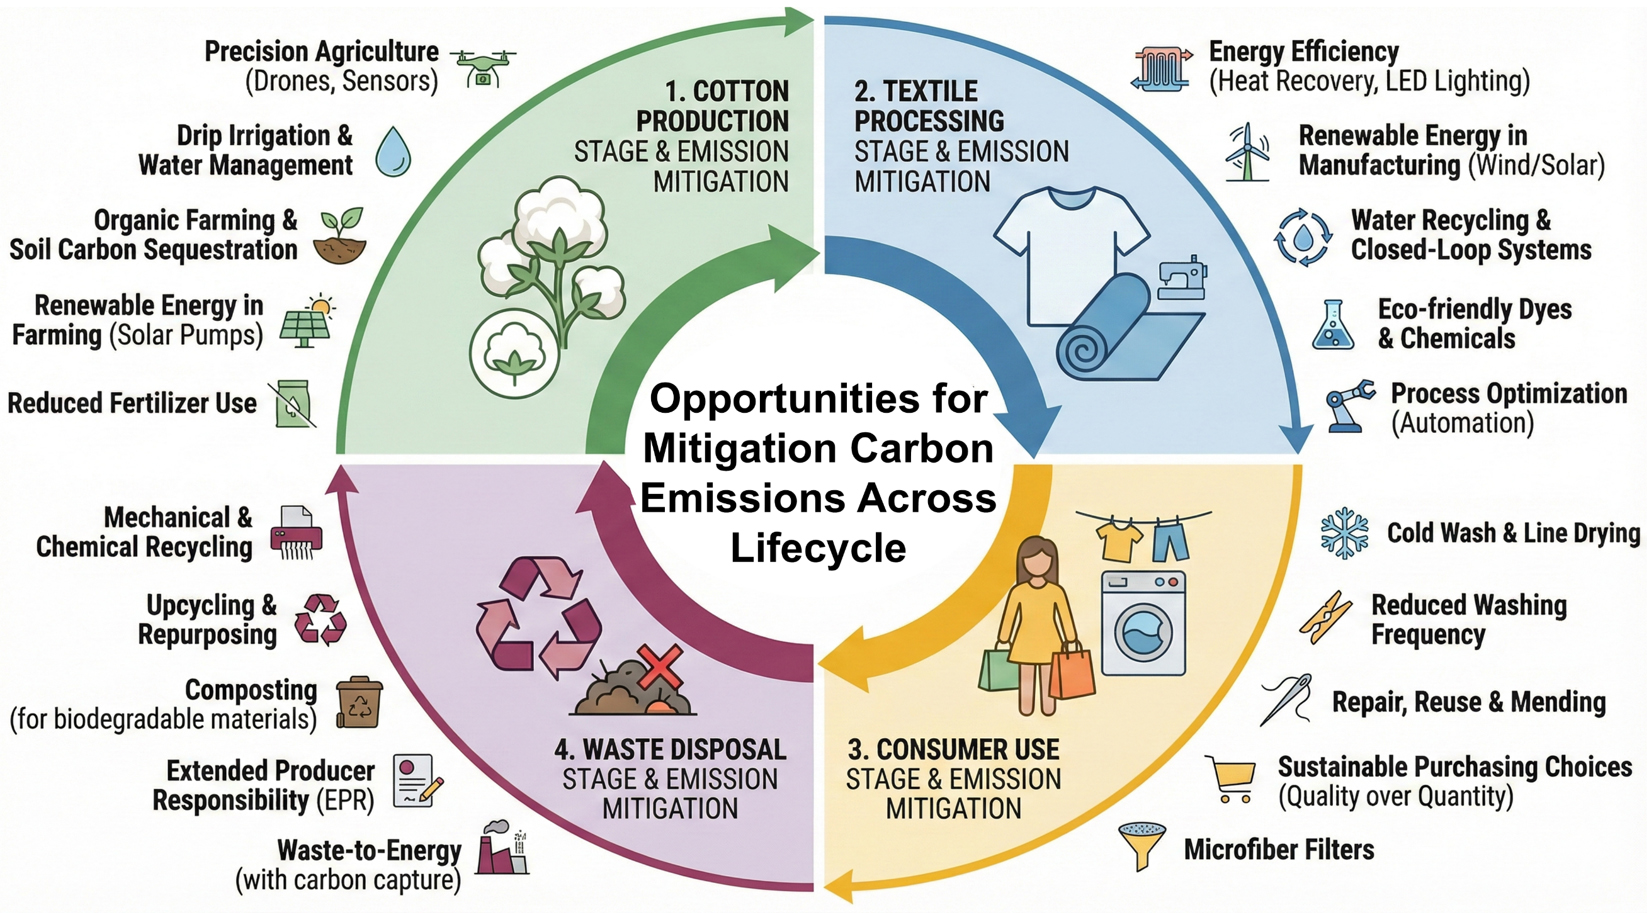
Figure 3. Opportunities for mitigating carbon emissions across cotton and textile lifecycles for different stages. The figure was created by Microsoft PowerPoint 2019 and did not involve any copyright issues.
Textile manufacturing
The textile manufacturing includes many industrial processes, cotton ginning, spinning, weaving or knitting, dyeing and finishing, and garment assembly, each contributing distinctively to the overall carbon footprint of cotton-based textile products[60]. Among these processes, dyeing and finishing are consistently identified as the most carbon-intensive steps, frequently contributing 30%~50% of total manufacturing-stage emissions, largely due to thermal energy demand and hot-water use[16]. In addition to the thermal energy demand of dyeing and finishing, the electricity consumption of spinning and weaving/knitting processes represents another critical source of emissions. These operations are highly electricity-intensive due to continuous high-speed mechanical motion, air suction systems, and humidity control requirements[61]. Reported electricity use for spinning typically ranges from 2.5~4.5 kWh per kg yarn, while weaving/knitting may require 0.8~2.5 kWh per kg fabric, depending on machinery type and production efficiency[62]. In contrast, ginning and garment manufacturing tend to generate lower emissions but remain important due to the cumulative impact of electricity use and material processing. A defining characteristic of this stage is the reliance on diverse heat sources, including coal-fired boilers, natural gas, fuel oil, or centralized steam supply[63]. Regions with coal-dominated energy structures, such as parts of South Asia and China, exhibit significantly higher carbon intensities compared to areas where natural gas or renewable energy sources are prevalent. Consequently, the decarbonization of textile manufacturing is closely linked to broader energy system transitions.
In recent years, cleaner production measures and energy-saving retrofits have demonstrated substantial potential for emission reductions. These include waste heat recovery systems, high-efficiency boilers, low-liquor ratio dyeing machines, variable-frequency drive motors, and digital automation of production lines[64] [Figure 3]. Energy efficiency retrofits such as high-efficiency motors, variable frequency drives, and waste heat recovery systems in dyeing processes have been reported to reduce energy consumption by 10%~25%[65]. Moreover, replacing coal-based thermal systems with natural gas or renewable electricity can substantially decrease emission intensity, particularly in regions where grid carbon intensity remains high. Electrification of steam generation and adoption of solar thermal systems in dyeing units have demonstrated measurable reductions in manufacturing-stage emissions. Additionally, water recycling and chemical optimization in dyeing and finishing not only reduce environmental impacts but also decrease energy demand through improved process efficiency[52].
Use stage
The consumer use stage represents a significant component of the carbon footprint for cotton-based textile products, largely driven by consumer behavior related to laundering and garment care. Key emission sources include washing frequency, water consumption, and the energy required for heating water and operating washing machines and dryers. In many regions, the electricity used for laundering has a relatively high carbon intensity, making washing practices a major determinant of use-phase emissions[42]. Moreover, tumble drying substantially increases energy demand compared to air drying, leading to higher associated emissions. The lifespan of garments also plays an important role. Longer use durations dilute the environmental burdens associated with production, effectively reducing the carbon footprint per wear[66]. Conversely, fast fashion trends and short usage cycles increase lifecycle emissions by accelerating the turnover of garments and raising demand for new products. Behavioral factors, such as washing clothes unnecessarily frequently, using high-temperature settings, or relying heavily on mechanical drying, can significantly elevate emissions during the use stage.
Consumer awareness and sustainable care practices offer opportunities for emission reduction. Measures such as lowering washing temperatures, adopting cold-water detergents, reducing wash frequency, maximizing garment durability, and opting for natural drying can collectively reduce energy demand and emissions [Figure 3]. Lowering washing temperature from 60 to 30°C can reduce use-phase emissions by approximately 30%~40%, depending on electricity mix. Extending garment lifespan by one year has also been estimated to reduce lifecycle carbon footprint per wear by 20% or more[1]. Educational campaigns and carbon labeling systems may further encourage low-impact choices by informing consumers about the environmental consequences of everyday garment care decisions[67]. Overall, the use stage highlights the importance of consumer behavior in shaping the lifecycle carbon footprint of cotton textile products and underscores the need for strategies that promote more responsible garment use.
Recycling and disposal
The end-of-life stage of cotton-based textile products plays an increasingly important role in determining their overall carbon footprint, particularly as circular economy strategies gain prominence. For a long time, conventional disposal pathways (incineration and landfilling) widespread globally. Incineration generates direct CO2 emissions, while landfilling contributes to long-term environmental pressures and resource loss, although cotton’s biodegradability mitigates some methane risks compared with synthetic fibers[5]. Nevertheless, both methods result in the permanent removal of materials from productive use, limiting opportunities for emission reduction.
In contrast, recycling pathways offer substantial potential to reduce lifecycle emissions by displacing virgin cotton production and extending material utility [Figure 3]. Mechanical recycling of cotton textiles can reduce emissions by 20%~50% compared to virgin fiber production, although fiber quality degradation remains a challenge. Chemical recycling technologies, while more energy-intensive, may enable higher material recovery rates and closed-loop systems, potentially offsetting upstream agricultural emissions when power by low-carbon energy sources. Despite quality limitations, mechanical recycling significantly reduces energy consumption and environmental impacts compared with producing new cotton fibers[68]. Chemical recycling including cellulose dissolution or depolymerization technologies, enables the recovery of high-quality regenerated fibers, such as lyocell-like materials, from post-consumer cotton waste[6]. Although more energy-intensive and technologically complex than mechanical methods, chemical recycling offers the advantage of generating fibers with properties comparable to virgin materials and supporting closed-loop textile-to-textile recycling. Extending garment lifespans through reuse, repair, and second-hand markets provides another highly effective strategy for reducing lifecycle emissions. Each additional use cycle distributes the environmental burdens of production across more wears, thereby lowering the per-use carbon footprint[69]. In total, the recycling and disposal stage presents critical opportunities for carbon mitigation. Transitioning away from linear disposal models toward diversified circular pathways-combining mechanical recycling, emerging chemical recycling technologies, and garment longevity strategies-can substantially improve the sustainability performance of cotton textile systems.
CONCLUSIONS AND PERSPECTIVE
This study aimed to systematically review carbon footprint research on cotton and textile products from a life-cycle perspective and to clarify methodological and boundary-related challenges across the value chain. The findings highlight those differences in system boundaries, database selection and accounting approaches substantially influence reported results and shape the identification of emission hotspots. Across the supply chain, agricultural inputs, energy-intensive processing and use-phase energy consumption emerge as structurally important contributors, while methodological integration remains fragmented. Advancing harmonized databases, digitalized carbon accounting and circular design integration will be essential to support more consistent, transparent and decision-relevant carbon assessments in the cotton and textile sector.
In the future, several research and industrial priorities can enhance the robustness and practicality of carbon footprint accounting for cotton and textile products. First, there is a critical need to develop high-quality, regionally representative LCA databases for both agriculture and textile processing. A global cotton-textile LCA database, harmonized with ISO 14040/14067 principles, would greatly improve data comparability and reduce uncertainty across studies. Second, the integration of digital carbon accounting technologies has the potential to transition carbon footprint from static estimates to real-time, dynamic monitoring systems. Third, establishing standardized product carbon footprint labeling systems will be essential for communicating environmental performance to consumers and supporting low-carbon procurement across global supply chains. Digital carbon labels can facilitate market differentiation while enabling regulatory compliance in regions with emerging carbon border measures. Finally, accelerating the integration of circular economy principles and green design in the textile sector will be crucial for advancing toward zero-carbon and circular textile systems.
DECLARATIONS
Authors’ contributions
Made substantial contributions to the conception and design of the study and writing, Performed data analysis and writing: Zhang, Z.
Performed proof-reading and providing administrative support: Wang, Z.;Wang, J.; Huang, W.; Wu, F.; Chen, J.
Performed technical and material support: Pan, Z.; Li, P.; Sun, G.; Li, J.; Zhang, Y.; Zhao, W.; Zhai, M.; Li, X.
Availability of data and materials
Not applicable.
AI and AI-assisted tools statement
We declared that Al and Al-assisted technologies have been only used for improving its readability and language in the manuscript.
Financial support and sponsorship
This work was financially supported by the Tianshan Talent Training Program (2024TSYCQNTJ0026), National Natural Science Foundation of China (32401968), Natural Science Foundation of Xinjiang Uygur Autonomous Region (2024D01B91), and China Postdoctoral Science Foundation (2024T171024, 2024M763621).
Conflicts of interest
All authors declared that there are no conflicts of interest.
Ethical approval and consent to participate
Not applicable.
Consent for publication
Not applicable.
Copyright
© The Author(s) 2026.
REFERENCES
1. Zhang, Z.; Huang, J.; Yao, Y.; et al. Environmental impacts of cotton and opportunities for improvement. Nat. Rev. Earth. Environ. 2023, 4, 703-15.
2. Zhang, L.; Leung, M. Y.; Boriskina, S.; Tao, X. Advancing life cycle sustainability of textiles through technological innovations. Nat. Sustain. 2022, 6, 243-53.
3. Kranthi, K. R.; Stone, G. D. Long-term impacts of Bt cotton in India. Nat. Plants. 2020, 6, 188-96.
4. Niinimäki, K.; Peters, G.; Dahlbo, H.; Perry, P.; Rissanen, T.; Gwilt, A. The environmental price of fast fashion. Nat. Rev. Earth. Environ. 2020, 1, 189-200.
5. Sovbetov, I. Carbon footprint embodied in global fiber trades. J. Nat. Fibers. 2025, 22, 2503970.
6. Sandin, G.; Peters, G. M. Environmental impact of textile reuse and recycling - A review. J. Clean. Prod. 2018, 184, 353-65.
7. Tolentino-Zondervan, F.; Divito, L. Sustainability performance of Dutch firms and the role of digitalization: the case of textile and apparel industry. J. Clean. Prod. 2024, 459, 142573.
8. Witt, T. W.; Ulloa, M.; Pelletier, M. G.; Mendu, V.; Ritchie, G. L. Irrigation’s effect and applied selection on the fiber quality of Ethyl MethaneSulfonate (EMS) treated upland cotton (Gossypium hirsutum L.). J. Cotton. Res. 2018, 1, 17.
9. Huang, W.; Wu, F.; Han, W.; et al. Carbon footprint of cotton production in China: composition, spatiotemporal changes and driving factors. Sci. Total. Environ. 2022, 821, 153407.
10. Chen, Z.; Xu, C.; Ji, L.; et al. Effects of multi-cropping system on temporal and spatial distribution of carbon and nitrogen footprint of major crops in China. Glob. Ecol. Conserv. 2020, 22, e00895.
11. Zhang, Z.; An, J.; Han, Y.; et al. Advantages of an orychophragmus violaceus-maize rotation in reducing greenhouse gas emissions and reactive nitrogen losses and increasing net ecosystem economic benefits on the North China Plain. J. Clean. Prod. 2021, 317, 128426.
12. Wang, Z.; Wang, G.; Han, Y.; et al. Improving cropping systems reduces the carbon footprints of wheat-cotton production under different soil fertility levels. Arch. Agron. Soil. Sci. 2020, 67, 218-33.
13. Koudahe, K.; Sheshukov, A. Y.; Aguilar, J.; Djaman, K. Irrigation-water management and productivity of cotton: a review. Sustainability 2021, 13, 10070.
14. Feng, L.; Chi, B.; Dong, H. Cotton cultivation technology with Chinese characteristics has driven the 70-year development of cotton production in China. J. Integr. Agric. 2022, 21, 597-609.
15. Wen, Y.; Liu, J.; Dhital, Y.; et al. Integrated effects of plastic film residues on cotton growth and field carbon sequestration under drip irrigation in arid oasis regions. Agr. Ecosyst. Environ. 2022, 339, 108131.
16. Chen, J.; Guo, H.; Pu, X.; Wang, X.; Xi, Y.; Hu, C. Traditional weaving craft for one-piece self-charging power textile for wearable electronics. Nano. Energy. 2018, 50, 536-43.
17. Cristea, A.; Hummels, D.; Puzzello, L.; Avetisyan, M. Trade and the greenhouse gas emissions from international freight transport. J. Environ. Econ. Manag. 2013, 65, 153-73.
18. Paris Agreement. Report of the Conference of the Parties on its 21st session, held in Paris from 30 November to 13 December 2015: addendum. Available from: https://digitallibrary.un.org/record/831052?v=pdf [Last accessed on 3 Apr 2026].
19. Magacho, G.; Espagne, E.; Godin, A. Impacts of the CBAM on EU trade partners: consequences for developing countries. Climate. Policy. 2023, 24, 243-59.
20. Yu, Z.; Yang, Y. Carbon footprint of global cotton production. Resour. Environ. Sustain. 2025, 20, 100214.
21. Wang, S.; Chong, C.; Huang, W.; et al. Tracing the carbon footprint of cotton garments from seed to garment: evidence from an empirical study of multiple sites in China. Resour. Conserv. Recycl. 2025, 217, 108200.
22. Alriksson, S.; Oberg, T. Conjoint analysis for environmental evaluation-a review of methods and applications. Environ. Sci. Pollut. Res. Int. 2008, 15, 244-57.
23. Hammar, T.; Peñaloza, D.; Hanning, A.; Haatanen, N.; Pakkasmaa, J. Life cycle assessment of textile fibre-to-fibre recycling by cellulose carbamate technology. J. Clean. Prod. 2023, 426, 139189.
24. Vitale, G. S.; Iacuzzi, N.; Zingale, S.; Lombardo, S.; Tuttolomondo, T.; Guarnaccia, P. Environmental sustainability of cotton: a systematic literature review of life cycle assessments. J. Agric. Food. Res. 2025, 22, 102069.
25. Brunner, S.; Flachsland, C.; Marschinski, R. Credible commitment in carbon policy. Climate. Policy. 2012, 12, 255-71.
26. Liu, T.; Wang, Q.; Su, B. A review of carbon labeling: standards, implementation, and impact. Renew. Sustain. Energy. Rev. 2016, 53, 68-79.
27. Der Velden NM, Patel MK, Vogtländer JG. LCA benchmarking study on textiles made of cotton, polyester, nylon, acryl, or elastane. Int. J. Life. Cycle. Assess. 2013, 19, 331-56.
28. Beylot, A.; Corrado, S.; Sala, S. Environmental impacts of European trade: interpreting results of process-based LCA and environmentally extended input-output analysis towards hotspot identification. Int. J. Life. Cycle. Assess. 2019, 25, 2432-50.
29. Zhang, Y.; Yan, D.; Hu, S.; Guo, S. Modelling of energy consumption and carbon emission from the building construction sector in China, a process-based LCA approach. Energy. Policy. 2019, 134, 110949.
30. Xiao, M.; Li, X.; Zhang, H.; Meng, H.; Dong, J. Environmental impact assessment and remediation decision-making of a contaminated megasite: combining LCA and IO-LCA. J. Clean. Prod. 2024, 462, 142586.
31. Chang, Y.; Ries, R. J.; Man, Q.; Wang, Y. Disaggregated I-O LCA model for building product chain energy quantification: a case from China. Energy. Build. 2014, 72, 212-21.
32. Yue, D.; Pandya, S.; You, F. Integrating hybrid life cycle assessment with multiobjective optimization: a modeling framework. Environ. Sci. Technol. 2016, 50, 1501-9.
33. Gao, T.; Liu, Q.; Wang, J. A comparative study of carbon footprint and assessment standards. Int. J. Low. Carbon. Technol. 2014, 9, 237-43.
34. Greenhouse Gas Protocol. The World Resources Institute and World Business Council for Sustainable Development: Washington, DC, USA, 2004. Available from: https://ghgprotocol.org/ [Last accessed on 8 Apr 2026].
35. Hou, N.; He, L.; Zhao, S.; Li, R. Research on the carbon footprint grading of viscose fiber based on clean production standards. Cotton. Textile. Technol. 2025, 53, 10.
36. Wu, P.; Xia, B.; Wang, X. The contribution of ISO 14067 to the evolution of global greenhouse gas standards - a review. Renew. Sustain. Energy. Rev. 2015, 47, 142-50.
37. Wang, Z.; Zhai, L.; Xiong, S.; et al. February orchid cover crop improves sustainability of cotton production systems in the Yellow River basin. Agron. Sustain. Dev. 2021, 41, 67.
38. Chai, Q.; Nemecek, T.; Liang, C.; et al. Integrated farming with intercropping increases food production while reducing environmental footprint. Proc. Natl. Acad. Sci. USA. 2021, 118, e2106382118.
39. Zhang, Z.; Wang, J.; Huang, W.; et al. Growing cover crop mixtures are more sustainable than single cover crop in continuous cotton cropping: comprehensive assessment from 3-year field experiment. J. Clean. Prod. 2023, 420, 138350.
40. Gu, B.; Zhang, L.; Van, Dingenen. R.; et al. Abating ammonia is more cost-effective than nitrogen oxides for mitigating PM(2.5) air pollution. Science 2021, 374, 758-62.
41. Huang, W.; Wu, F.; Zhang, Z.; et al. The nitrogen footprint and reactive nitrogen reduction potential of cotton production in China. J. Clean. Prod. 2023, 402, 136808.
42. Caro, D.; Bastianoni, S.; Borghesi, S.; Pulselli, F. M. On the feasibility of a consumer-based allocation method in national GHG inventories. Ecol. Ind. 2014, 36, 640-3.
43. Li, F.; Zhang, K.; Yang, P.; et al. Information exposure incentivizes consumers to pay a premium for emerging pro-environmental food: Evidence from China. J. Clean. Prod. 2022, 363, 132412.
44. Pacetti, T.; Lombardi, L.; Federici, G. Water-energy Nexus: a case of biogas production from energy crops evaluated by Water Footprint and Life Cycle Assessment (LCA) methods. J. Clean. Prod. 2015, 101, 278-91.
45. Pan, Z.; Zhang, Z.; Li, J.; et al. A global synthesis of nitrous oxide emissions across cotton-planted soils. Sustain. Prod. Consum. 2024, 51, 315-26.
46. Bertolini, M.; Duttilo, P.; Lisi, F. Accounting carbon emissions from electricity generation: A review and comparison of emission factor-based methods. Appl. Energy. 2025, 392, 125992.
47. Walling, E.; Vaneeckhaute, C. Greenhouse gas emissions from inorganic and organic fertilizer production and use: a review of emission factors and their variability. J. Environ. Manag. 2020, 276, 111211.
48. Steubing, B.; De, Koning. A.; Merciai, S.; Tukker, A. How do carbon footprints from LCA and EEIOA databases compare? A comparison of ecoinvent and EXIOBASE. J. Ind. Ecol. 2022, 26, 1406-22.
49. Yang, X.; Li, S.; Du, T.; Kang, S.; Siddique, K. H.; Butterbach-Bahl, K. Greenhouse gas emissions and crop-specific emission factors of eight upland crops based on a six-year field experiment in the North China Plain. Sustain. Prod. Consump. 2024, 50, 416-30.
50. Ma, R.; Zou, J.; Han, Z.; et al. Global soil-derived ammonia emissions from agricultural nitrogen fertilizer application: a refinement based on regional and crop-specific emission factors. Glob. Chang. Biol. 2021, 27, 855-67.
51. Harris, E.; Yu, L.; Wang, Y. P.; et al. Warming and redistribution of nitrogen inputs drive an increase in terrestrial nitrous oxide emission factor. Nat. Commun. 2022, 13, 4310.
52. Shahriari-khalaji, M.; Alassod, A.; Nozhat, Z. Cotton-based health care textile: a mini review. Polym. Bull. 2022, 79, 10409-32.
53. Li, P.; Wang, S.; Qi, H.; et al. Soil replacement combined with subsoiling improves cotton yields. J. Cotton. Res. 2019, 2, 25.
54. Zhang, Z.; An, J.; Xiong, S.; et al. Orychophragmus violaceus-maize rotation increases maize productivity by improving soil chemical properties and plant nutrient uptake. Field. Crops. Res. 2022, 279, 108470.
55. You, L.; Ros, G. H.; Chen, Y.; Zhang, F.; de, Vries. W. Optimized agricultural management reduces global cropland nitrogen losses to air and water. Nat. Food. 2024, 5, 995-1004.
56. Xiao, C.; Zhang, F.; Li, Y.; et al. Optimizing drip irrigation and nitrogen fertilization regimes to reduce greenhouse gas emissions, increase net ecosystem carbon budget and reduce carbon footprint in saline cotton fields. Agr. Ecosyst. Environ. 2024, 366, 108912.
57. Zhang, Z.; Wang, J.; Huang, W.; et al. Respective advantages of growing different green manure with nitrogen fertilization in cotton-based cropping systems: insights from a three-year field study. Food. Energy. Security. 2024, 13, e70015.
58. Bai, Z.; Zhang, D.; Wang, Z.; et al. Challenges and strategies in estimating soil organic carbon for multi-cropping systems: a review. Carbon. Footprints. 2024, 3, 19.
59. Zhang, Z.; Wang, J.; Xiong, S.; et al. Orychophragmus violaceus/cotton relay intercropping with reduced N application maintains or improves crop productivity and soil carbon and nitrogen fractions. Field. Crops. Res. 2023, 291, 108807.
60. Chen, F.; Ji, X.; Chu, J.; Xu, P.; Wang, L. A review: life cycle assessment of cotton textiles. Ind. Textila. 2021, 72, 19-29.
61. Peters, G.; Svanström, M.; Roos, S.; Sandin, G.; Zamani, B. 1 - Carbon footprints in the textile industry. In: Handbook of life cycle assessment (LCA) of textiles and clothing, Elsevier. 2015, pp. 3-30.
62. Leal Filho, W.; Dinis, M. A. P.; Liakh, O.; et al. Reducing the carbon footprint of the textile sector: an overview of impacts and solutions. Text. Res. J. 2024, 94, 1798-814.
63. Grishanov, S. 2 - Structure and properties of textile materials. In: Handbook of textile and industrial dyeing. Elsevier; 2011, pp. 28-63.
64. Hrouzková, S.; Szarka, A. Development of a modified QuEChERS procedure for the isolation of pesticide residues from textile samples, followed by GC-MS determination. Separations 2021, 8, 106.
65. Tariq, G.; Sun, H.; Ali, S. Environmental footprint impacts of green energies, green energy finance and green governance in G7 countries. Carbon. Footprints. 2024, 3, 5.
66. Hong, J.; Shen, G. Q.; Feng, Y.; Lau, W. S.; Mao, C. Greenhouse gas emissions during the construction phase of a building: a case study in China. J. Clean. Prod. 2015, 103, 249-59.
67. Latombe, G.; Hui, C.; McGeoch, M. A. Beyond the continuum: a multi-dimensional phase space for neutral-niche community assembly. Proc. Biol. Sci. 2015, 282, 20152417.
68. Zhang, Y.; Wang, L.; Guo, Z.; et al. Revealing the underlying molecular basis of phosphorus recycling in the green manure crop Astragalus sinicus. J. Clean. Prod. 2022, 341, 130924.
Cite This Article
How to Cite
Download Citation
Export Citation File:
Type of Import
Tips on Downloading Citation
Citation Manager File Format
Type of Import
Direct Import: When the Direct Import option is selected (the default state), a dialogue box will give you the option to Save or Open the downloaded citation data. Choosing Open will either launch your citation manager or give you a choice of applications with which to use the metadata. The Save option saves the file locally for later use.
Indirect Import: When the Indirect Import option is selected, the metadata is displayed and may be copied and pasted as needed.
About This Article
Copyright

Data & Comments
Data
0


Comments
Comments must be written in English. Spam, offensive content, impersonation, and private information will not be permitted. If any comment is reported and identified as inappropriate content by OAE staff, the comment will be removed without notice. If you have any queries or need any help, please contact us at [email protected].